
Abstract
Background:
A liquid meal tolerance test (LMTT) has been proposed as a useful alternative to more labor-intensive methods of assessing insulin sensitivity and secretion.
Objective:
This substudy, conducted at the conclusion of a randomized, double-blind crossover trial, compared insulin sensitivity indices from a LMTT (Matsuda insulin sensitivity index [MISI] and LMTT disposition index [LMTT-DI]) with indices derived from minimal model analysis of results from the insulin-modified intravenous glucose tolerance test (IVGTT) (insulin sensitivity index [SI] and disposition index [DI]).
Results:
Participants included men (n = 16) and women (n = 8) without diabetes but with increased abdominal adiposity (waist circumference ≥102 cm and ≥89 cm, respectively) and mean age of 48.9 years. The correlation between SI and the MISI was 0.776 (P < 0.0001). The respective associations between SI and MISI with waist circumference (r = −0.445 and −0.554, both P < 0.05) and body mass index were similar (r = −0.500 and −0.539, P < 0.05). The correlation between DI and LMTT-DI was 0.604 (P = 0.002).
Conclusions:
These results indicate that indices of insulin sensitivity and secretion derived from the LMTT correlate well with those from the insulin-modified IVGTT with minimal model analysis, suggesting that they may be useful for application in clinical and population studies of glucose homeostasis.
Introduction
There are several methods available for measuring insulin sensitivity and secretion, including euglycemic and hyperglycemic clamp procedures and mathematical modeling of data collected during an intravenous glucose tolerance test (IVGTT). 5 –9 These methods are costly and labor-intensive, making them impractical for use in many investigations, particularly large clinical trials and population studies.
A solid meal tolerance test (MTT) providing a combination of carbohydrate, protein, and fat has been found to be an effective stimulus for assessing insulin sensitivity and secretion. 10 –16 However, use of a solid food mixed meal has some disadvantages, including difficulty in standardization across multiple research sites and potential variability introduced by differences in the degree to which subjects chew solid food items. A liquid MTT (LMTT) protocol has the advantage of being simple to prepare and administer in a standardized fashion in multicenter investigations and studies with repeated measurements over time.
Initial assessments conducted by our group indicated that the indices derived from a LMTT, including the Matsuda insulin sensitivity index (MISI) and a disposition index (LMTT-DI), correctly rank groups of subjects with normal fasting glucose, impaired fasting glucose, and T2DM 17 and provide reliable estimates of insulin sensitivity and secretion in repeated tests administered on separate days. 18 The present study provides a direct comparison of the indices derived from the LMTT to analogous indices derived from minimal model analysis of data from the insulin-modified IVGTT in overweight and obese subjects, a population at increased risk for insulin resistance.
Subjects and Methods
Study design
The results described herein are from a substudy of subjects participating in a double-blind, randomized, crossover trial designed to evaluate the effects on insulin sensitivity and secretion of consuming two doses of a resistant starch (15 or 30 g/day) versus a control starch. Treatment periods were 4 weeks in length, separated by 3-week washout periods. At the conclusion of the main trial, subjects who had completed all three treatments were given the option of participating in the LMTT study. Those who agreed to participate remained on the treatment received during the final 4-week treatment period for an additional 1–7 days until the LMTT could be completed. The trial was conducted in adherence to good clinical practice guidelines, including approval of the protocol by an institutional review board (Quorum Review, Inc., Seattle, WA) and provision of written informed consent by all subjects. Subjects were recruited at a single research site in Addison, IL. They were informed of their right to withdraw from the core study or substudy at any time.
Subjects
The main study from which these substudy results were collected was designed to evaluate the effects of resistant starch in overweight and obese men and women. Thus, the participants, generally healthy men and women 18–69 years of age, were selected for increased abdominal adiposity (waist circumference ≥102.0 cm for men and ≥89.0 cm for women). Subjects were excluded from participation if they had a body mass index (BMI) ≥35.0 kg/m2 because of the desire to enroll subjects who were representative of the general U.S. population. Additional exclusion criteria included abnormal laboratory values of clinical importance; history of clinically important endocrine (including type 1 diabetes mellitus or T2DM), cardiovascular, renal, pulmonary, hepatic, biliary, or gastrointestinal disease; a recent history of cancer (except non-melanoma skin cancer), major trauma, or surgical event; or a current active infection. Subjects with extreme habits that, in the opinion of the investigators, had the potential to confound the results were also excluded. This included alcohol and substance abuse as well as atypical dietary patterns (e.g., very low carbohydrate diets or consuming only one meal per day) and exercise habits (e.g., serious athletic training). Use of systemic corticosteroids, antibiotics, or medications known to influence carbohydrate metabolism was not allowed during the study. Women of childbearing potential who were not pregnant or lactating, and did not plan to become pregnant during the study period, were eligible for enrollment if they were using a medically acceptable contraceptive program.
Measurements of insulin sensitivity and secretion
In the core study, an insulin-modified IVGTT was conducted at the end of each 4-week treatment period. Measurements of glucose homeostasis collected in the final IVGTT were compared with indices of insulin sensitivity and secretion calculated from an LMTT completed after the original study. Plasma glucose and insulin concentrations in samples collected during the IVGTT and the LMTT were assessed by Medpace Laboratories (Cincinnati, OH). Plasma glucose level was measured by photometry using a hexokinase reaction, 19 and plasma insulin level was determined via an electrochemiluminescence immunoassay. 20
IVGTT procedure
Each IVGTT was conducted after an overnight fast (9–15 h). An intravenous catheter was placed in the antecubital space in each arm: one for collecting blood samples and the other for injecting glucose and insulin. At t = 0 min, a 300 mg/kg body weight intravenous glucose bolus (50% dextrose solution) was administered over approximately 1.5 min. At t = 20 min, an intravenous bolus of regular human insulin (0.03 U/kg, diluted to 10 mL with normal saline) was administered over approximately 1 min. In total, 21 blood samples were collected at the following pre- and post-glucose infusion timepoints: t = −10, −5, 3, 5, 7, 10, 12, 14, 16, 19, 22, 25, 30, 40, 50, 60, 75, 90, 120, 150, and 180 min.
Plasma glucose and insulin values were entered into the MINMOD MILLENNIUM computer program (version 6.02; R.N. Bergman, University of Southern California, Los Angeles, CA) for determination of insulin sensitivity (SI). 21 –24 Acute insulin response to intravenous glucose (AIRG) was calculated as described previously. 22 The disposition index (DI) of pancreatic β-cell function, a measure of the appropriateness of the amount of insulin secreted for the prevailing level of insulin resistance, was calculated as DI = SI × AIRG. 25
LMTT procedure
The LMTT was conducted after an overnight fast (9–15 h) between 1 and 7 days after the IVGTT. 17 A single intravenous catheter was placed in the antecubital space for collection of venous blood. Subjects were administered a liquid meal, to be consumed within 10 min, that consisted of two 8-oz servings of Ensure® Creamy Milk Chocolate or Homemade Vanilla Shake (Ross Products Division, Abbott Laboratories, Columbus, OH) providing 500 kcal, 80 g of carbohydrate, 12 g of fat, and 18 g of protein. Blood samples were obtained from the indwelling catheter for analysis of plasma glucose and insulin concentrations at t = −1, 30, 60, 90, and 120 min, where t = 0 was the start of the liquid meal consumption.
Plasma glucose and insulin concentrations were used to determine LMTT indices of insulin sensitivity and secretion. The MISI was calculated as 10,000/(G0 × I0 × Gm × Im)0.5 , where G0 and I0 were premeal values for glucose (G) and insulin (I), respectively, and Gm and Im were the respective mean postmeal values during the 120 min of the test. 26 The insulin secretion index (ISI) was calculated as total area under the curve for plasma insulin from 0 to 120 min divided by the total area under the curve for plasma glucose from 0 to 120 min. 27 Pancreatic β-cell function was determined by calculation of the disposition index (LMTT-DI) according to the following formula: MISI × ISI. 27
Statistical analyses
Statistical analyses were generated using SAS version 9.2 and StatView version 5.0 (SAS Institute, Cary, NC). Glucose homeostasis variables from the IVGTT and the LMTT were compared, and the nature and strength of the relationships were assessed using linear regression analysis and Pearson or Spearman correlation coefficients. Values for homeostasis model assessment (HOMA) of insulin sensitivity (HOMA%S) and β-cell function (HOMA%B) were calculated from fasting glucose and insulin values using the calculator available at
Results
Of the 33 subjects randomized in the core study, 24 subjects continued the treatment he or she received during the final phase of the core study and underwent an LMTT. The median (interquartile limits) number of days between the IVGTT and the LMTT was 5.0 days (2.0, 7.0). Demographic and baseline characteristics are presented in Table 1. All subjects were overweight (n = 10 with BMI 25–29.9 kg/m2) or obese (n = 14 with BMI >29.9 kg/m2 and <35.0 kg/m2, which was the upper limit for study qualification) because of the inclusion criteria of the core study. Subjects maintained stable diet and activity patterns throughout the study. No material weight changes were observed during the final 4-week treatment period of the core study (median [interquartile limits] of 0.09 kg [−1.09, 0.64]) or during the period separating the IVGTT and LMTT (0.00 kg [−0.86, 0.41]).
Data are number (%) or mean (SEM) values.
A factor of 6.0 was used to convert insulin values in μU/mL to pmol/L.
Glucose homeostasis variables from the IVGTT and LMTT are presented in Table 2. Pearson correlations between the IVGTT measurements of insulin sensitivity and pancreatic β-cell function, SI and DI, and the LMTT indices of insulin sensitivity and pancreatic β-cell function, MISI and DI-LMTT, are presented in Figures 1 and 2, respectively. The correlations between SI and the MISI (r = 0.776) and between DI and LMTT-DI (r = 0.604) were both statistically significant (P < 0.0001 and P = 0.002, respectively). Log transformation did not improve the associations, and there was no evidence for differences in the strengths of the relationships among men, premenopausal women, and postmenopausal women (data not shown). A sensitivity analysis using Spearman rank correlation showed similar agreement between the indices from the two tests (ρ = 0.809 for SI and MISI and 0.556 for DI and LMTT-DI), suggesting that the results were not unduly influenced by outlying values.
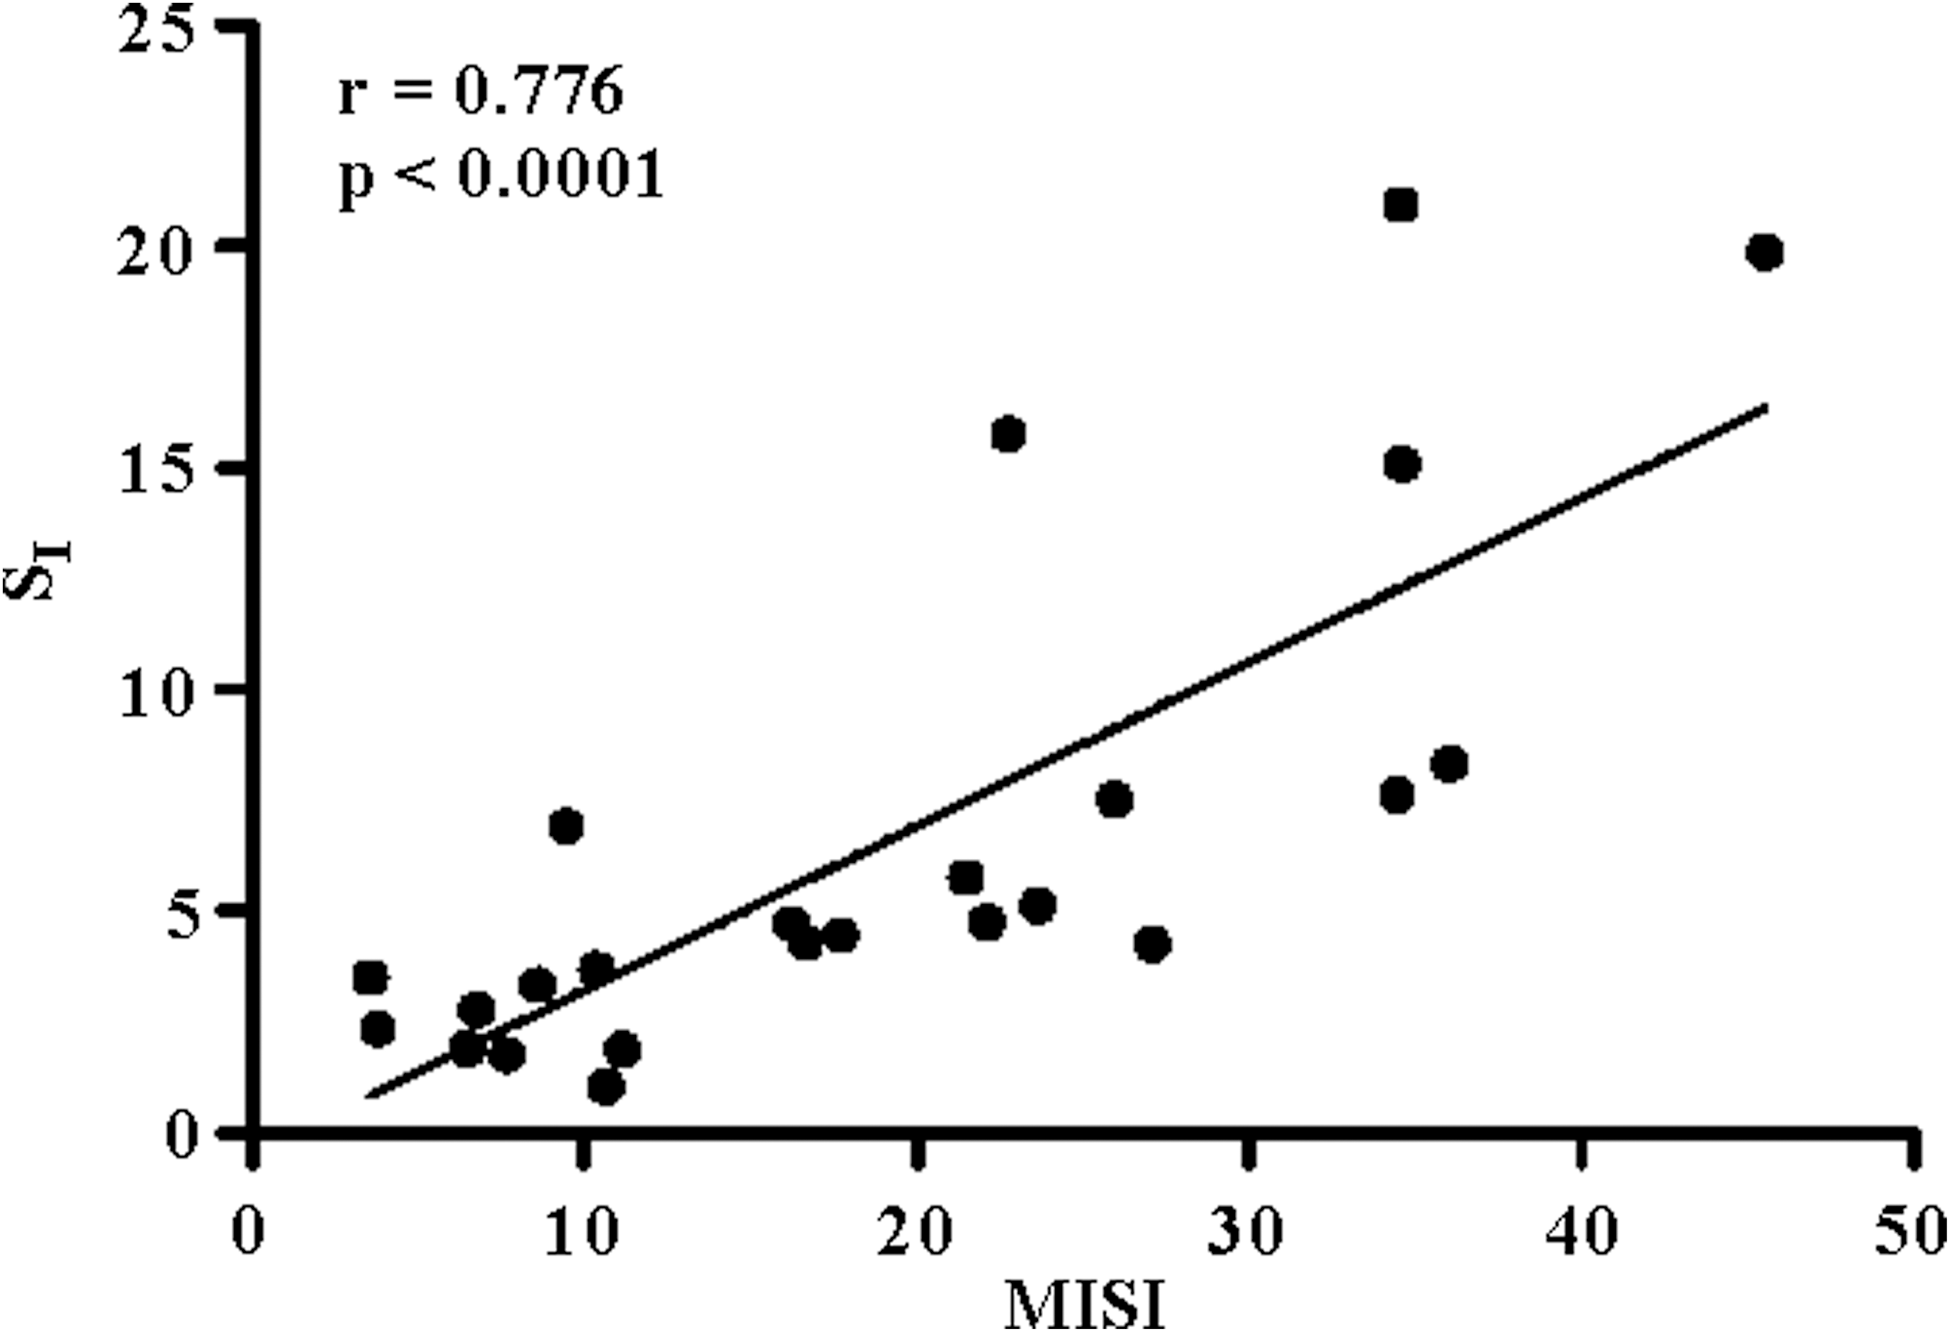
Bivariate fit of intravenous glucose tolerance test insulin sensitivity index (SI) on Matsuda insulin sensitivity index (MISI).
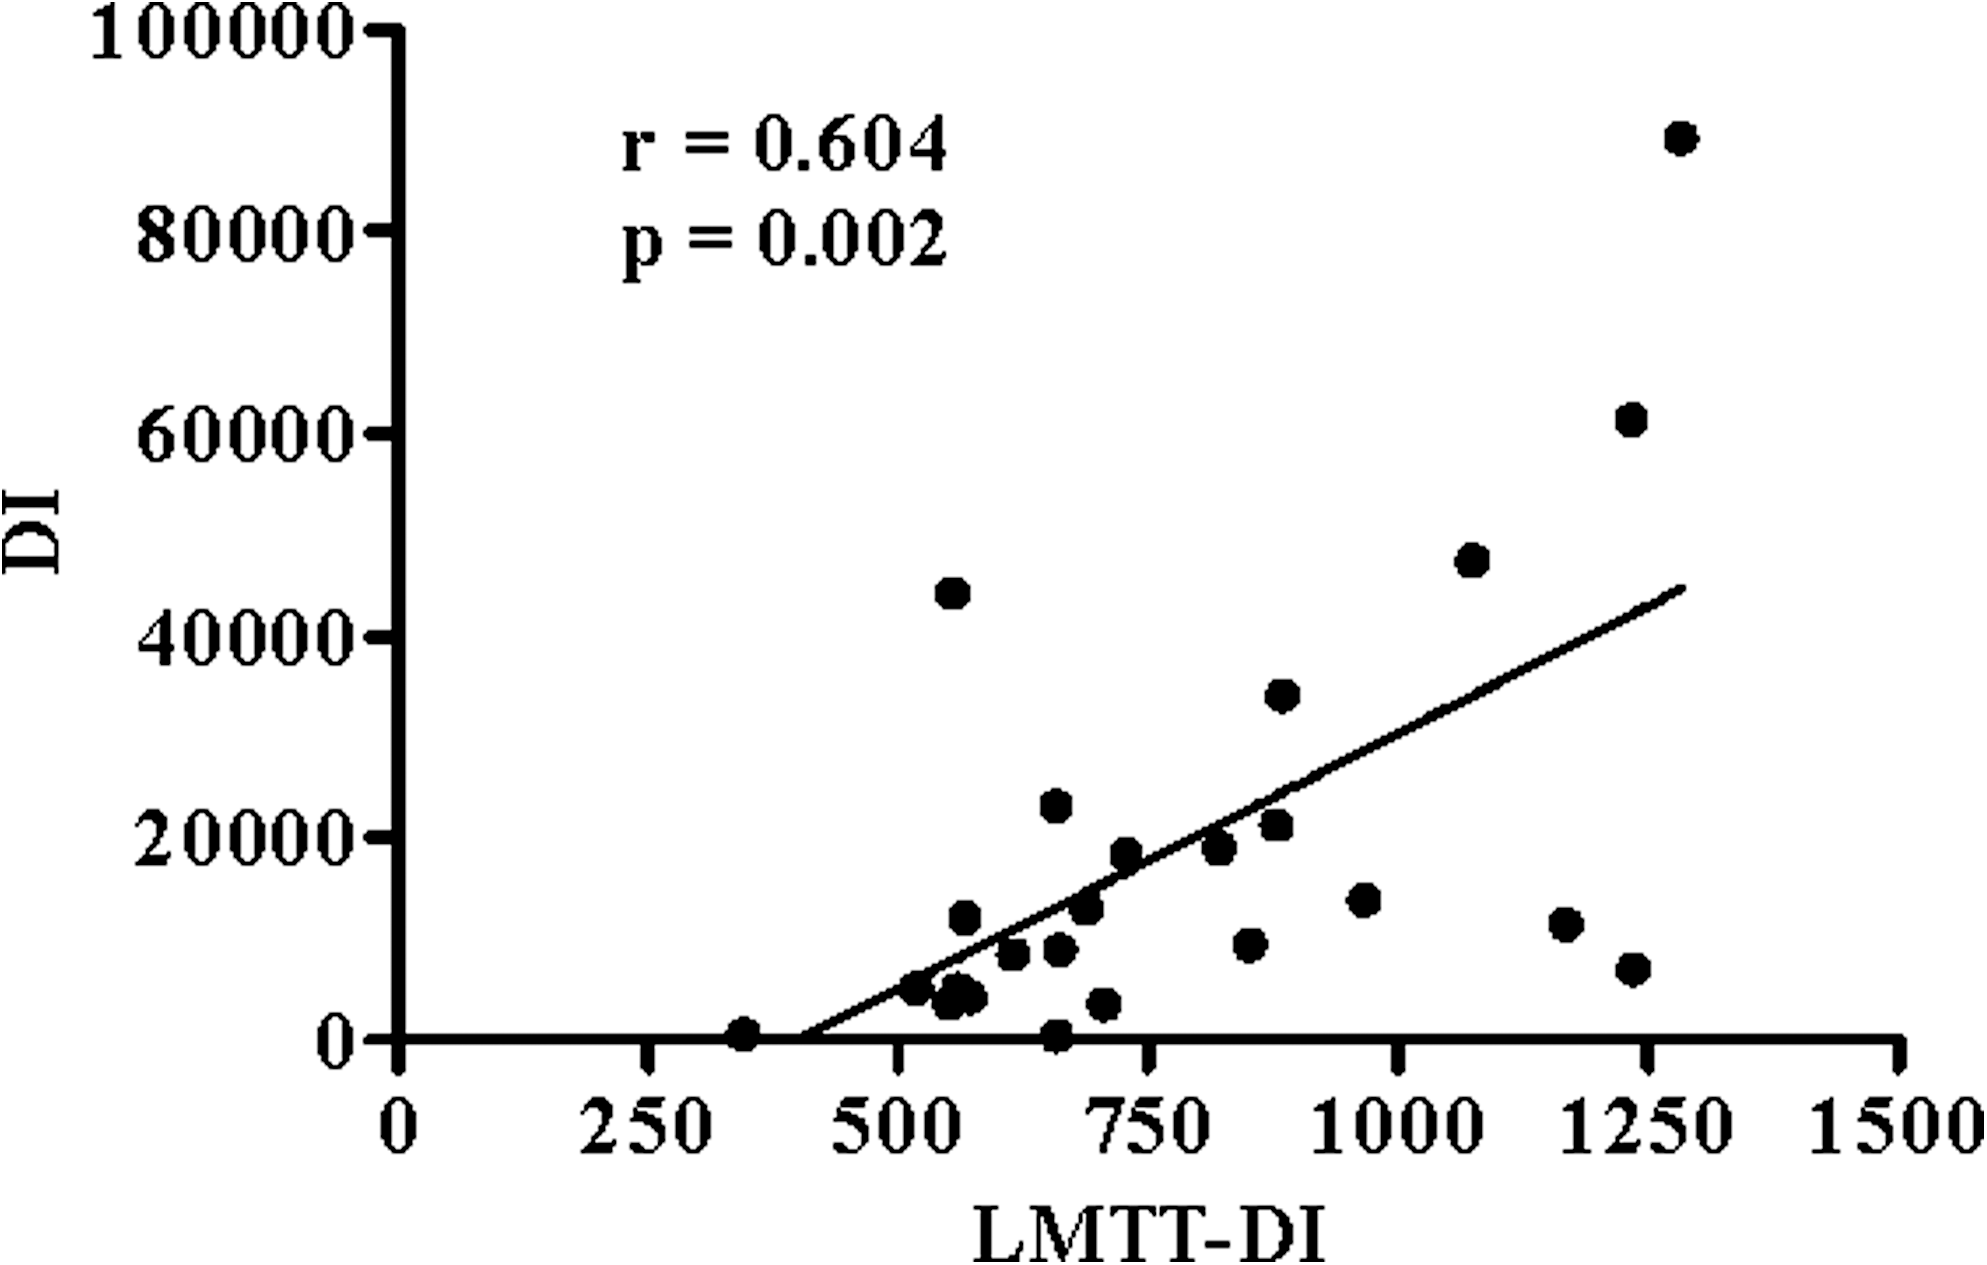
Bivariate fit of intravenous glucose tolerance test disposition index (DI) on disposition index from the liquid meal tolerance test (LMTT-DI).
A factor of 6.0 was used to convert insulin values in μU/mL to pmol/L.
AIRG, acute insulin response to intravenous glucose; DI, disposition index; HOMA%B, homeostasis model assessment of β-cell function; HOMA%S, homeostasis model assessment of insulin sensitivity; ISI, insulin secretion index; IVGTT, intravenous glucose tolerance test; LMTT, liquid meal tolerance test; MISI, Matsuda insulin sensitivity index; SI, insulin sensitivity.
Associations between SI and MISI and HOMA%S, BMI, and waist circumference are shown in Table 3. HOMA%S was strongly associated with both SI (r = 0.674, P = 0.0003) and MISI (r = 0.797, P < 0.0001). The respective inverse associations between SI and MISI with waist circumference (r = −0.445 and −0.554) and BMI were similar (r = −0.500 and −0.539) and statistically significant (P < 0.05). Associations between DI and LMTT-DI and HOMA%B, AIRG, and ISI are shown in Table 4. There were no strong or statistically significant associations between DI and LMTT-DI and any of these measures. The relationship between ISI and HOMA%B (r = 0.894, P < 0.0001) was stronger than the relationship between AIRG and HOMA%B (r = 0.488, P = 0.015). A moderate association was detected between AIRG and ISI (r = 0.519, P = 0.008).
HOMA%S, homeostasis model assessment of insulin sensitivity; MISI, Matsuda insulin sensitivity index; SI, intravenous glucose tolerance test insulin sensitivity.
AIRG, acute insulin response to intravenous glucose; DI, disposition index; HOMA%B, homeostasis model assessment of β-cell function; ISI, insulin secretion index; LMTT-DI, disposition index from the liquid meal tolerance test.
Discussion
There are numerous direct methods (euglycemic and hyperglycemic clamps and insulin suppression test), indirect methods (IVGTT, oral glucose tolerance test, and solid or liquid meal tests), and simple fasting indices for assessing insulin sensitivity (simple quantitative insulin sensitivity check index [QUICKI] and HOMA). 8 The euglycemic clamp is generally regarded as the reference method because it directly measures the ability of insulin to promote glucose utilization under steady-state conditions. 28 However, because administration of the clamp procedure is laborious, indirect measurements are more frequently used. Among the indirect measurements, the IVGTT is the most widely accepted test against which results from other indirect procedures are often compared. 7,10 The results from this investigation show that the MISI from the LMTT and the SI from minimal model analysis of the insulin-modified IVGTT correlated well (r = 0.776, P < 0.0001).
Other investigators have also reported strong associations between indices of insulin sensitivity derived from MTTs and SI derived from minimal model analysis of data from the IVGTT. Aloulou et al. 10 reported that the MISI calculated from a solid mixed MTT was the strongest correlate of SI (r = 0.656, P < 0.001) compared with numerous other empirical indices derived from the MTT. Caumo et al. 11 compared minimal model indices of insulin sensitivity from a solid mixed MTT with the SI from IVGTT data in a group of 10 men and women with normal glucose tolerance and found a strong association (Spearman r = 0.89, P < 0.01). Steil et al. 13 also reported that the correlation between a minimal model insulin sensitivity index derived from a solid mixed MTT correlated well with results from insulin sensitivity assessed with the euglycemic clamp procedure (r = 0.76, P < 0.01, n = 17); in fact, this relationship was at least as strong as that between insulin sensitivity indices derived from the IVGTT and the euglycemic clamp (r = 0.72, P < 0.01).
Taken together, the results from these studies suggest that insulin and glucose responses from MTTs, whether in liquid or solid form, can be used to calculate insulin sensitivity indices that are sufficiently accurate to rank groups of individuals. As was the case in our prior study, 17 the MISI from the LMTT was also significantly associated with other factors known to be associated with insulin sensitivity, including HOMA%S, BMI, and waist circumference. The associations between the MISI from the LMTT were generally as strong as those between the IVGTT SI and these variables.
The association between the LMTT-DI and the DI from the IVGTT was statistically significant (r = 0.604, P = 0.002) but not as strong as that for the insulin sensitivity indices from the two tests. This is not surprising because the DI from the IVGTT is a measure of the acute insulin response to an intravenous glucose load, whereas the LMTT-DI uses a measure of insulin response that incorporates both the acute (first phase) and subsequent (second phase) insulin responses. The relationship between the LMTT-DI and DI in the present study was somewhat stronger than that reported by Retnakaran et al. 29 (r = 0.224, P = 0.001) for indices derived from the oral glucose tolerance test and the IVGTT. Whether this difference relates to a different type of carbohydrate load delivered (oral glucose vs. a mixed nutrient LMTT), differences in the groups studied, or other factors is uncertain. Recently, Retnakaran et al. 30 reported that women with gestational diabetes or impaired glucose tolerance showed greater declines in β-cell function measured with the oral glucose tolerance test DI (insulin secretion-sensitivity index-2 in their terminology) from 3 to 12 months postpartum compared with women who had normal gestational glucose tolerance. These findings highlight the potential usefulness of indices derived from relatively simple tests such as the oral glucose tolerance test or the LMTT for studying the evolution of glucose intolerance and interventions intended to prevent its development.
The present study has several limitations. First, a sequential design was used wherein all subjects received the IVGTT first, followed by the LMTT. This was necessary because this was a substudy in a dietary intervention trial. Given the concordance of results from this investigation with those from prior studies, we believe it is unlikely that lack of randomization in the order of tests materially influenced the results, although this possibility cannot be ruled out.
A second limitation is that the results from the indices of insulin sensitivity and secretion have different units. Correlation is an imperfect way to assess agreement between tests because results are influenced by the range of values within the sample studied and because both the LMTT and IVGTT derived measures are subject to error. 31 Lack of a common unit of measurement prevents application of a Bland–Altman type assessment. Given that the sample studied herein was composed entirely of individuals with above-average waist circumference, which is strongly associated with insulin resistance, it is likely that the range of values for insulin sensitivity was lower than that in the general population. This would tend to bias the results toward less agreement than might be the case with a wider range of values in the study sample. A sensitivity analysis using Spearman rank correlation showed similar agreement between the indices from the two tests (ρ = 0.809 for SI and MISI and 0.556 for DI and LMTT-DI), suggesting that the results were not unduly influenced by outlying values. Furthermore, although the range of values may have been somewhat compressed, the sample did show variation of severalfold in both MISI and LMTT-DI, suggesting that the degree of bias toward the null is unlikely to be large. Because this was a substudy to another study that specifically selected overweight and obese subjects with increased waist circumference, caution must be used regarding generalization of these results. Additional validation in a larger sample with representation from important population subgroups based on age, ethnicity, adiposity, and glucose tolerance will be needed to more fully elucidate the generalizability of these results.
Conclusions
The results from this investigation suggest that indices of insulin sensitivity and secretion derived from the LMTT correlate well with those derived from the insulin-modified IVGTT with minimal model analysis in overweight and obese men and women. These findings are consistent with those from our prior work 17,18 and provide additional support for the use of these LMTT-derived indices in clinical and population studies on glucose homeostasis.
Footnotes
Acknowledgments
The authors gratefully acknowledge the assistance of Christine Pelkman, Ph.D., for her contribution to the study design and interpretation of the results from the core study from which the data for these substudy analyses were collected. Partial grant support for this study was provided by National Starch, LLC.
Author Disclosure Statement
Provident Clinical Research received partial grant support for this study from National Starch, LLC. Provident Clinical Research, of which all the authors are employees, has also received research funding from and/or provided consulting to Abbott Nutrition (Columbus, OH), the manufacturer of the liquid meal test product used.