
Abstract
Background:
Numerous guidelines and algorithms exist to achieve glycemic control. Their strengths and weaknesses are difficult to assess without head-to-head comparison in time-consuming clinical trials. We hypothesized that computer simulations may be useful.
Methods:
Two open-label randomized clinical trials were replicated using computer simulations. One study compared performance of the enhanced model predictive control (eMPC) algorithm at two intensive care units in the United Kingdom and Belgium. The other study compared three glucose control algorithms—eMPC, Matias (the absolute glucose protocol), and Bath (the relative glucose change protocol)—in a single intensive care unit. Computer simulations utilized a virtual population of 56 critically ill subjects derived from routine data collected at four European surgical and medical intensive care units.
Results:
In agreement with the first clinical study, computer simulations reproduced the main finding and discriminated between the two intensive care units in terms of the sampling interval (1.3 h vs. 1.8 h, United Kingdom vs. Belgium; P < 0.01). Other glucose control metrics were comparable between simulations and clinical results. The principal outcome of the second study was also reproduced. The eMPC demonstrated better performance compared with the Matias and Bath algorithms as assessed by the time when plasma glucose was in the target range between 4.4 and 6.1 mmol/L (65% vs. 43% vs. 42% [P < 0.001], eMPC vs. Matias vs. Bath) without increasing the risk of severe hypoglycemia.
Conclusions:
Computer simulations may provide resource-efficient means for preclinical evaluation of algorithms for glycemic control in the critically ill.
Introduction
Many insulin-titrating protocols are paper-based with calculations performed by the ICU staff at the patient's bedside. Well-established examples include the Portland protocol 9 designed for surgical cardiac ICUs, the Yale protocol 10 developed for medical ICUs, the SPRINT protocol modulating both the insulin and nutritional input, 11 –13 and the Bath protocol. 14 An alternative to written protocols are computer-based algorithms such as Glucommander, 15 GRIP, 16 and the more computationally advanced proportional integral derivative algorithm 17 or model predictive control algorithms. 18 –20 Common glycemic control algorithms were analyzed by Steil and Reifman 21 and Wilson et al. 22 and reviewed by Van Herpe et al. 23 A systematic review of computerized algorithms was done by Eslami et al. 24
An insulin-titrating protocol/algorithm needs to be safe, efficacious, and efficient (i.e., limit incidence and duration of hypoglycemia events, achieve desired glucose levels, and require infrequent glucose measurements). Evaluation of alternative glucose protocols by clinical trials is resource-demanding and time-consuming. Only a few studies have made head-to-head comparisons of two protocols, and just one study compared three protocols. 25
Computer simulations could evaluate, compare, and optimize glucose control algorithms prior to clinical testing. This involves simulating the glucose–insulin dynamics in a cohort of in silico subjects, referred to as a virtual population. Several metabolic simulators have been proposed in the last decade. Chase et al. 26 and Van Herpe et al. 27 conducted simulation studies in the intensive care setting. Hovorka and co-workers developed a simulation environment comprising a virtual population of 56 critically ill subjects 28,29 as well as a virtual population of 18 subjects with type 1 diabetes. 30 Dalla Man et al. 31 and Kovatchev et al. 32 developed a simulation environment comprising 100 adults, 100 adolescents, and 100 children with type 1 diabetes and used it for in silico testing of closed-loop control algorithms; the simulator was accepted by the U.S. Food and Drug Administration as a substitute for animal testing.
In the present study we hypothesized that computer simulations can correctly predict outcome of comparative clinical studies. We constructed a “virtual population” of critically ill patients using data collected at four European surgical and medical ICUs. In order to demonstrate validity of predictions made with the use of the virtual population, we reproduced two clinical trials evaluating glucose control protocols.
Materials and Methods
Virtual ICU population
Each virtual subject is generated from data collected in one critically ill patient—a process referred to as “experimental in silico cloning.” 28 The data comprise the blood glucose, insulin delivery, and carbohydrate content of parenteral and enteral nutrition. Using mathematical modeling, physiologically motivated parameters of glucose regulation are estimated from the data while using knowledge of population parameter distributions.
A collection of virtual subjects makes up a virtual population. A virtual population for a given ICU may be viewed as a random sample of subjects from that particular ICU characterized by its specific nutritional policy and glucose-modulating procedures and co-medications.
The virtual population was created using data collected in 56 critically ill subjects. The subjects participated in clinical trials conducted as part of the European Commission–funded CLINICIP project (Closed Loop INsulin Infusion in Critically Ill Patients). The prospective randomized controlled trials took place at four ICUs: Charles University, Prague (CUP), Czech Republic (trials described in Plank et al. 33 and Hovorka et al. 18 ); Medical University, Graz (MUG), Austria (trials reported by Plank et al. 33 and Pachler et al. 34 ); Katholieke Universiteit, Leuven (KUL), Belgium (trials reported by Cordingley et al. 35 and Van Cromphaut et al. 36 ); and Royal Brompton Hospital (RBH), London, UK (trials reported by Plank et al. 33 and Cordingley et al. 35 ). Twenty-nine subjects were treated at medical ICUs, and 27 at surgical ICUs. The data were recorded over a 48-h period in 15 patients and over a 72-h period in the remaining 41 patients. The data comprised glucose measurements at intervals of 30 min to 4 h, insulin infusions and boluses, and the carbohydrate content of parenteral and enteral infusions and meals. Patient characteristics are given in Table 1. Reasons for admission are listed in Table 2.
Data are mean ± SD values or median values (range).
APACHE II, Acute Physiology And Chronic Health Evaluation II; CUP, Charles University, Prague; KUL, Katholieke Universiteit, Leuven; MUG, Medical University, Graz; RBH, Royal Brompton Hospital.
COPD, chronic obstructive pulmonary disease; CPR, cardiopulmonary resuscitation; CUP, Charles University, Prague; KUL, Katholieke Universiteit, Leuven; MUG, Medical University, Graz; RBH, Royal Brompton Hospital.
A virtual subject is represented by a compartment model of glucose regulation. The model, described in detail by Hovorka et al.
28
and summarized in the Supplementary Appendix (Supplementary Data are available online at
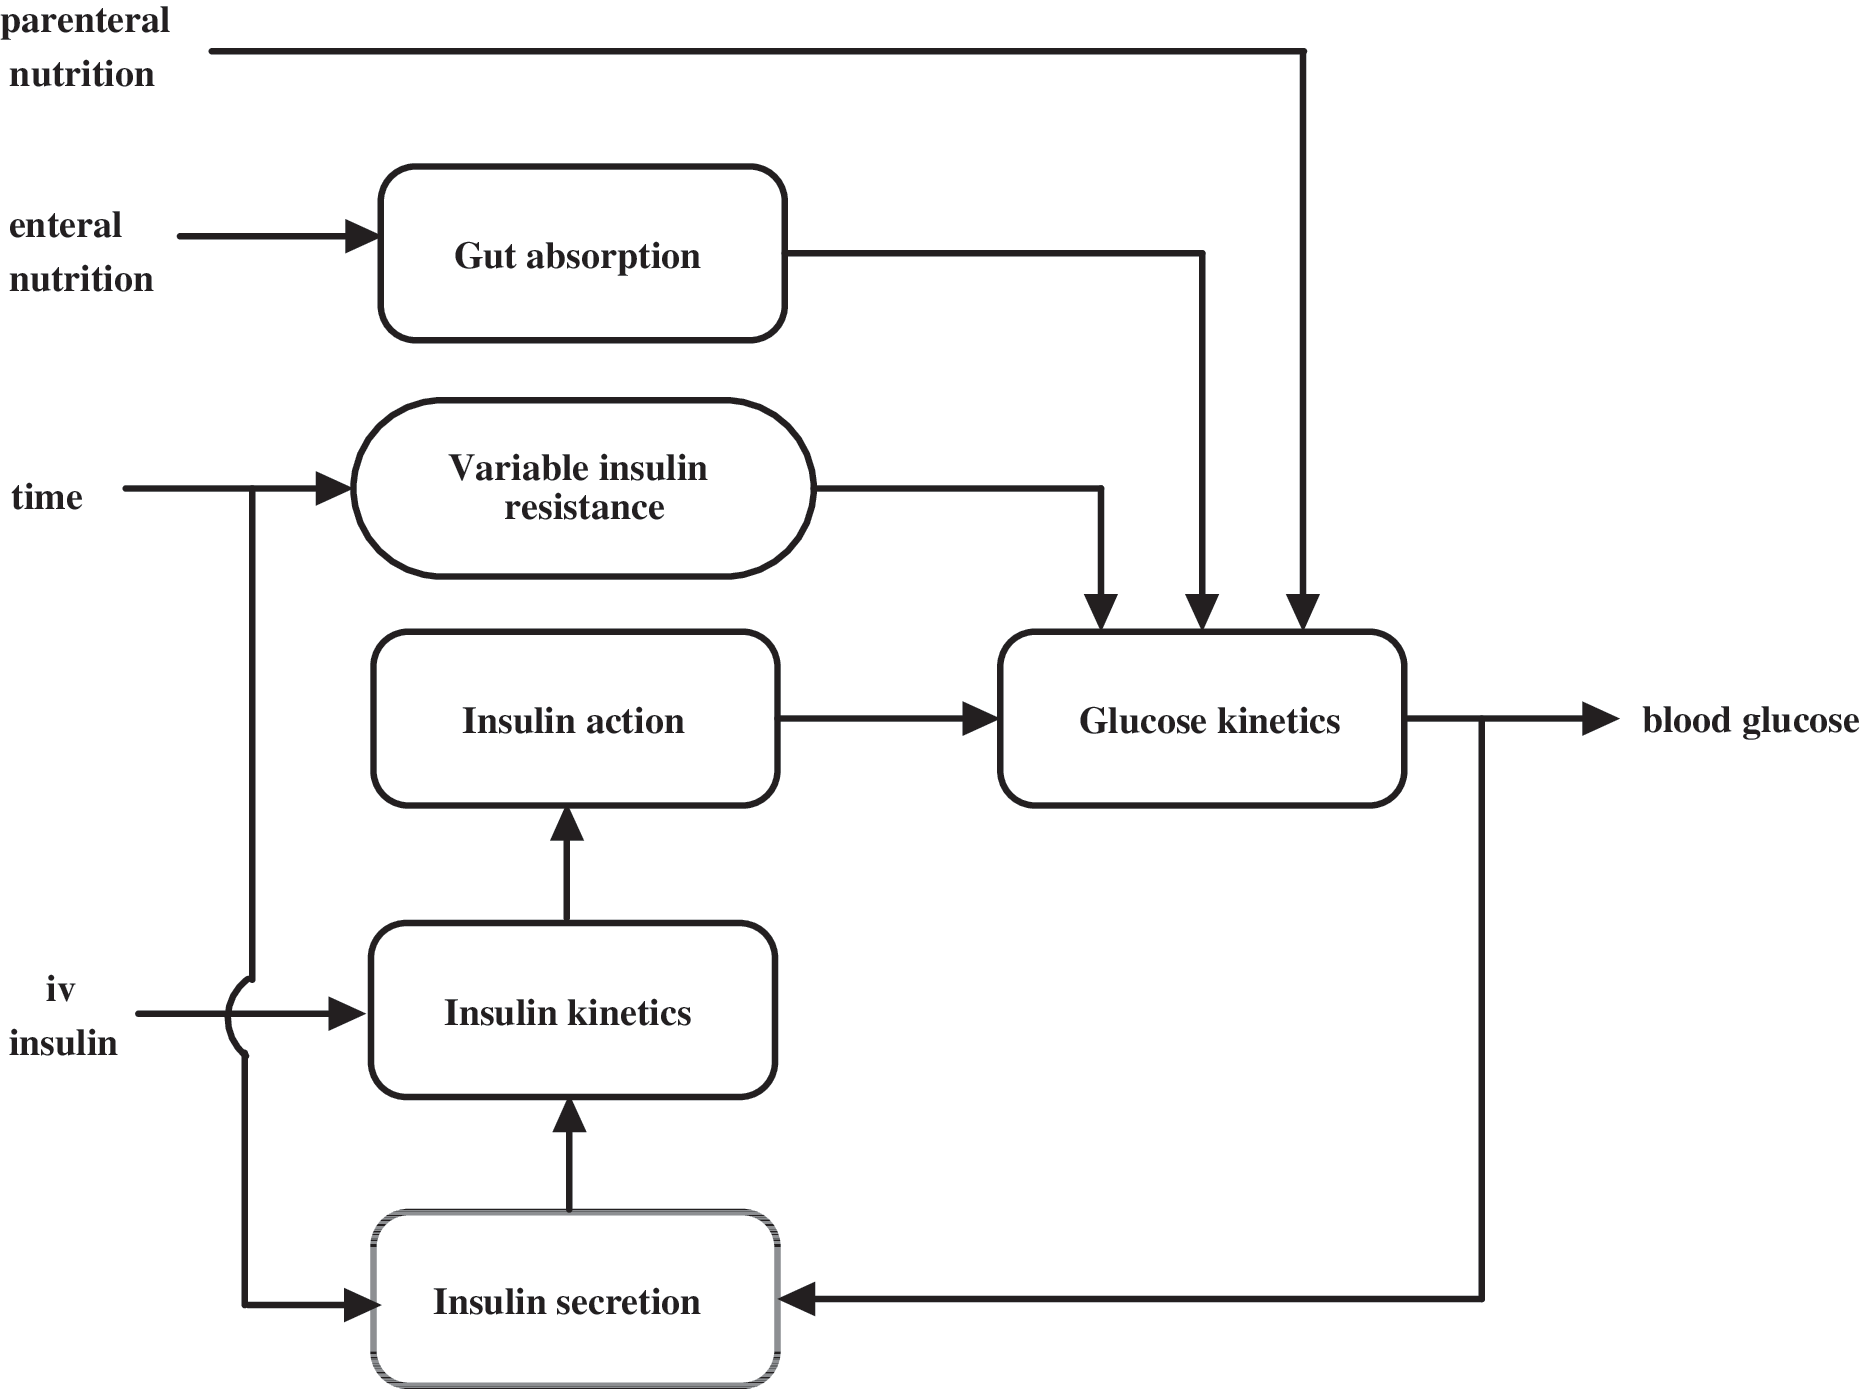
The model of glucose regulation in the critically ill combines five submodels: a submodel of endogenous insulin secretion, a submodel of insulin kinetics, a submodel of enteral glucose absorption, a submodel of insulin action, and a submodel of glucose kinetics. An important component of the model is the representation of time varying insulin sensitivity. iv, intravenous. Adapted from Hovorka et al. 28
Steps involved in creating a virtual subject and its use in simulation studies are illustrated in Figure 2.
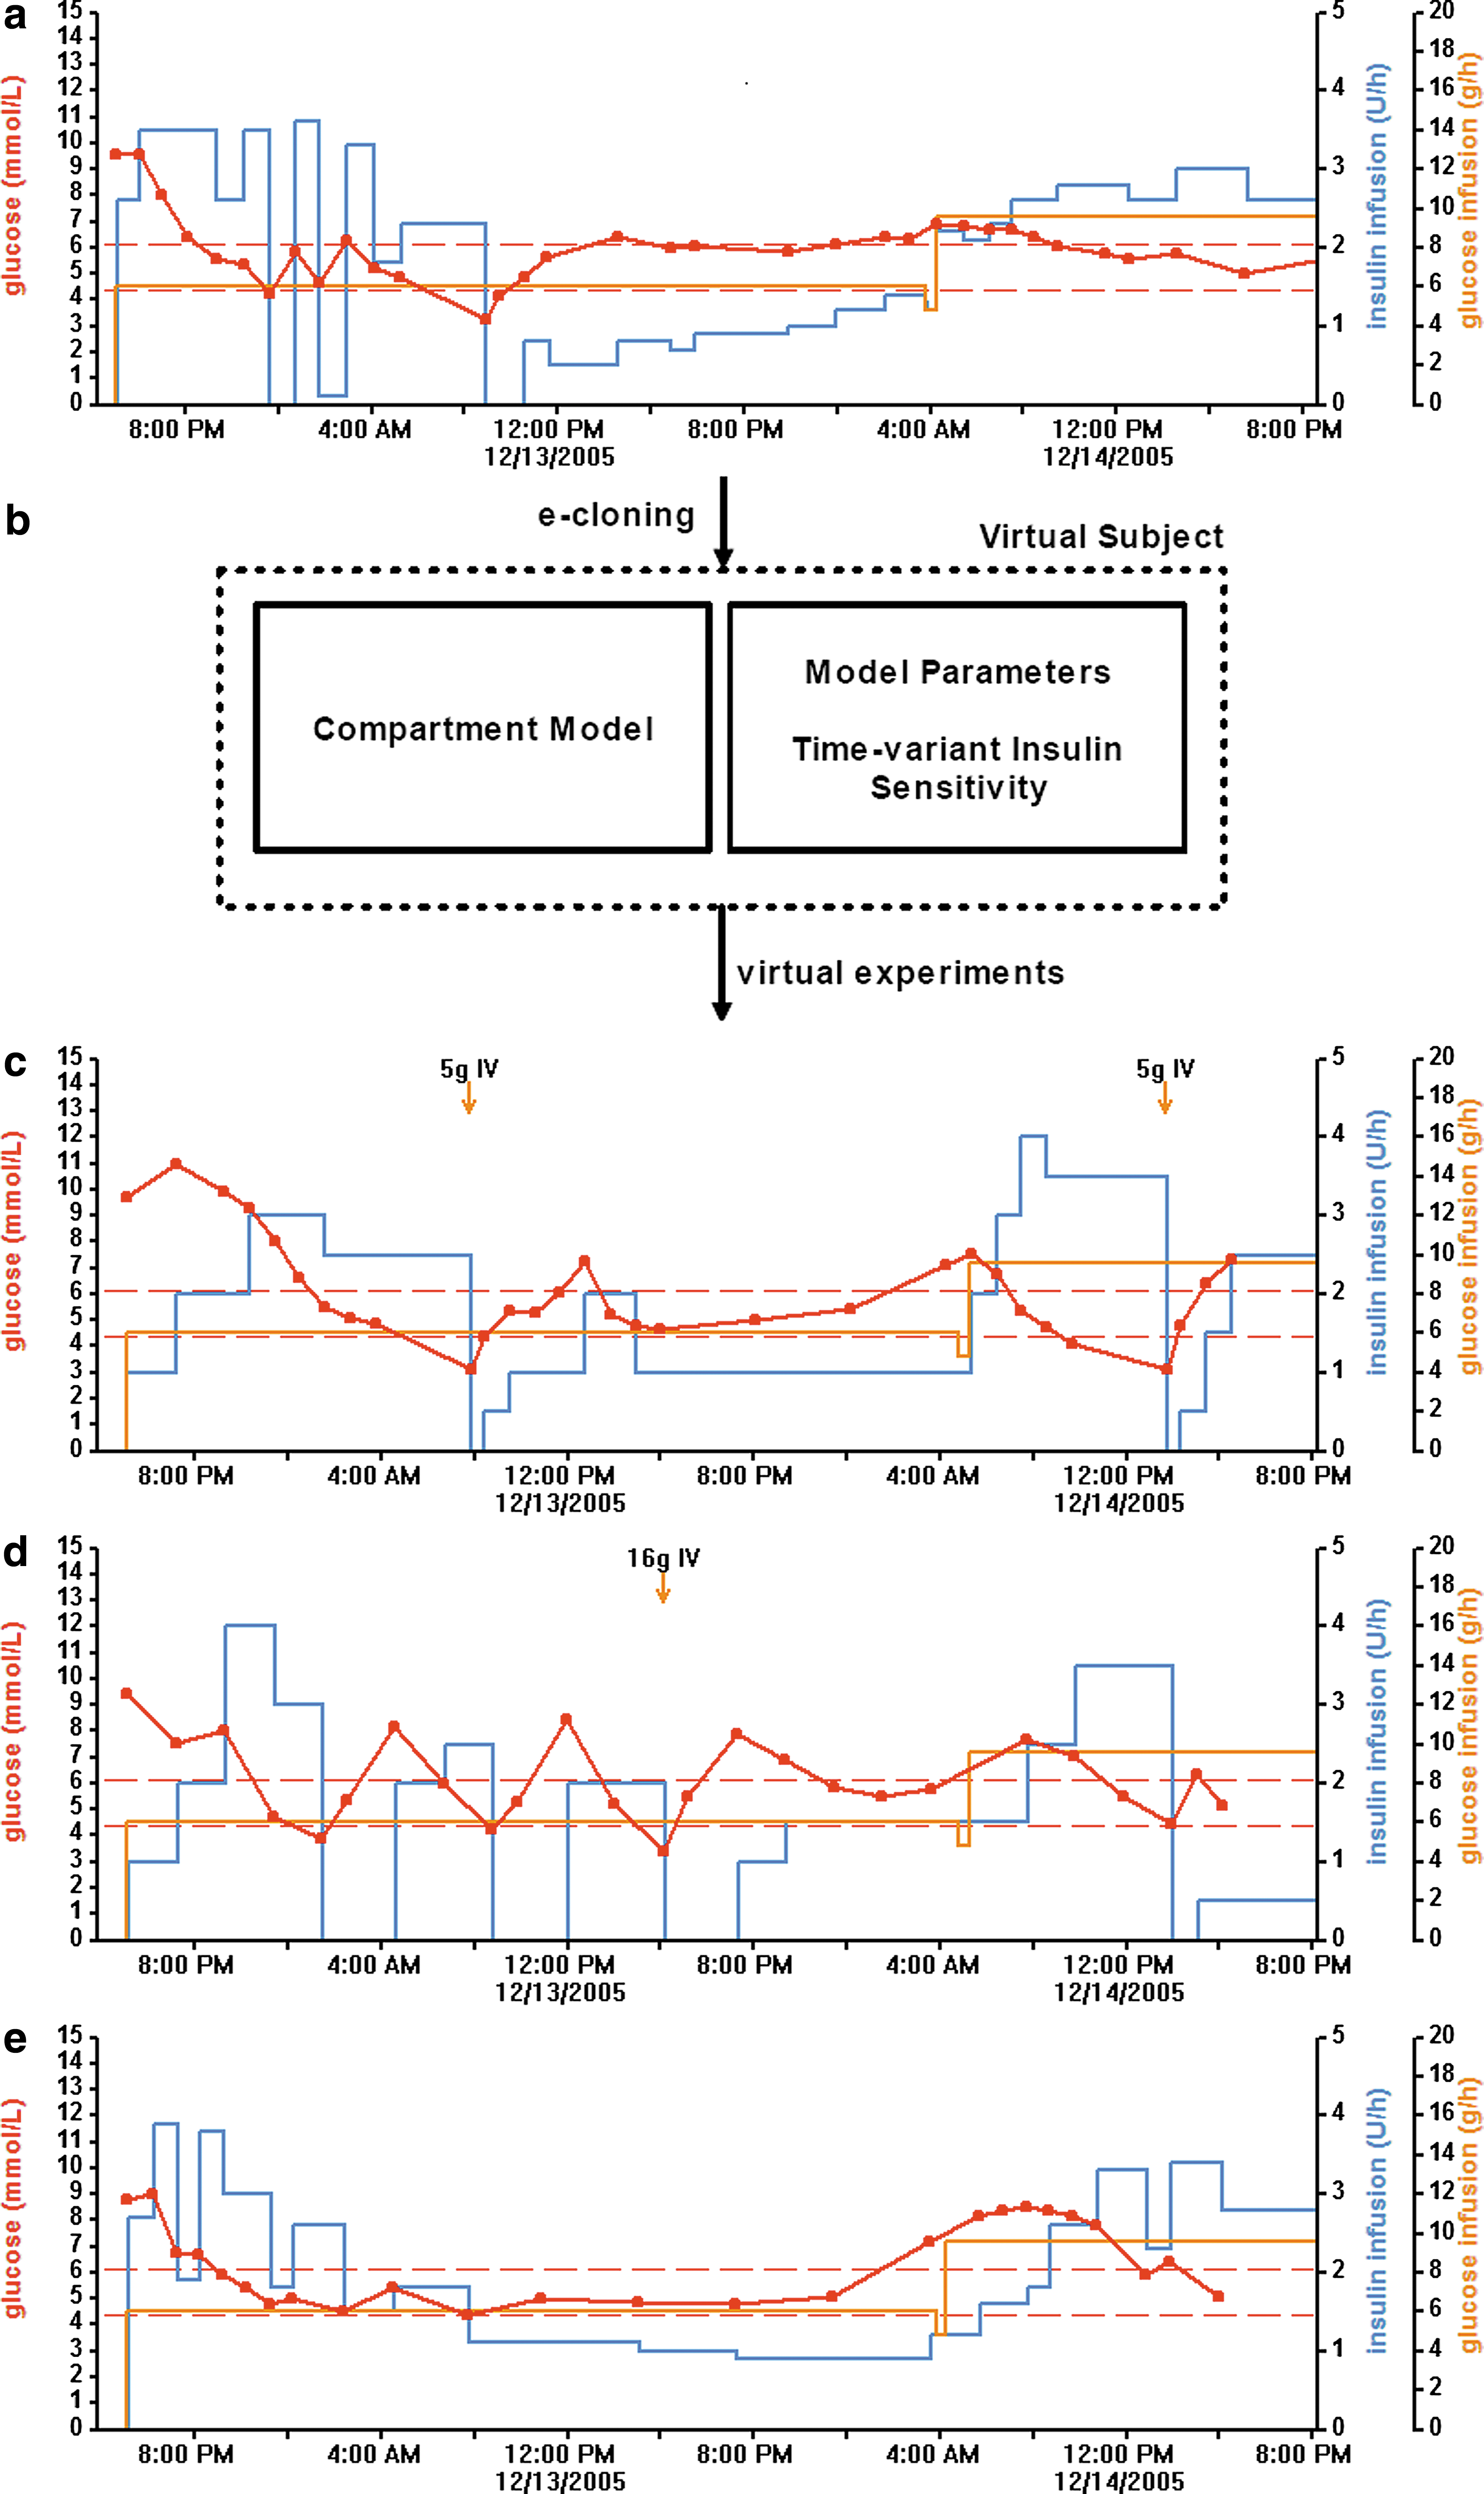
An illustrative example of experimental cloning and in silico testing. Routine data collected in a critically ill patient at a surgical intensive care unit at Katholieke Universiteit, Leuven (
Validation of virtual ICU population
Validity of the virtual population was assessed by evaluating the ability of the virtual population to reproduce two clinical trials: the “RBH versus KUL study” 35 and the “Three Protocols study.” 25 Additionally, we assessed validity of the virtual population using standard mathematical modeling approaches. 37
To reproduce a clinical study evaluating a TGC protocol, a virtual population is carefully selected to limit a possible bias. The duration of simulations is specified. An initial blood glucose level feeds into the TGC protocol, which determines the insulin infusion rate used by the mathematical model to forecast glucose concentration up to the next sampling point. The forecasted glucose concentration, with added measurement error, again feeds into the TGC protocol, and the cycle is repeated. The simulations are performed for each subject independently; the resulting time–concentration profiles are analyzed as per clinical studies.
RBH versus KUL study
The clinical trial described by Cordingley et al. 35 investigated the effectiveness of the enhanced model predictive control (eMPC) algorithm to achieve TGC over a 72-h period. This was a two-center study involving RBH and KUL, which differ in their nutritional policy. Critically ill patients with hyperglycemia (glucose >6.7 mmol/L) were randomized to intravenous insulin infusion informed by the eMPC algorithm (versions 1.03.08–1.03.10) or the ICUs' standard insulin protocols. In total, 34 patients were studied: 20 at KUL (10 in the standard treatment arm and 10 in the eMPC arm) and 14 at RBH (eight in the standard treatment arm and six in the eMPC arm).
Simulation studies replicated the eMPC arm but not the standard protocol arm. The KUL standard treatment protocol is a guideline, involving intuitive decision-making by experienced nursing staff, and cannot be implemented unambiguously in a computer algorithm.
The simulation RBH versus KUL study matched the clinical study for the number of subjects, the ICU origin of subjects, and the duration of the study. All virtual subjects used to simulate the RBH studies originated from the same clinical trial described by Cordingley et al. 35 In the simulated KUL study, all subjects originated from another study conducted at KUL. 36 Nutritional protocols of the virtual subjects were retained and thus are representative of each ICU's nutritional policy. eMPC version 1.03.10 was used in the simulation studies.
Three Protocols study
Blaha et al. 25 compared three TGC protocols: Matias, an absolute glucose protocol; Bath, a relative glucose change protocol; and the eMPC algorithm (see Supplementary Data for details on protocols). In total, 120 consecutive patients who underwent cardiac surgery and were admitted to the surgical ICU at CUP were randomly assigned to three parallel treatment arms. Glucose measurements recorded over the initial 48 h were used to compare the TGC protocols.
A simulation study matched the original clinical study duration but not the initial blood glucose levels as these were not available. The original study allocated 40 subjects to each of the treatment arms. To circumvent the limited size of the virtual population, we used bootstrapping to create three virtual subpopulations each comprising 40 subjects. Virtual subjects were allocated into the arms using the minimization method 38 implemented in the Minim program 39 to balance the subpopulations according to ICU origin (CUP, MUG, KUL, and RBH) and type of ICU (surgical and medical).
To diminish the effect of large changes in nutrition on accuracy of predictions, the nutritional protocol from the clinical study of origin of each virtual patient was retained and did not necessarily match the nutritional protocol at CUP.
Treatment of hypoglycemia followed instructions specified by each protocol. In the eMPC group, where the treatment was not specified, the Matias protocol instructions were followed. Version 2.01.05 of the eMPC algorithm used in the simulation study matched the version used in the “Three Protocols” study.
Implementation and statistical analysis
Parameters of the virtual subjects were estimated using SAAM II version 1.2.1 (SAAM Institute, University of Washington, Seattle, WA). Subsequently, the virtual population, the simulation environment that runs the computer simulations, 29 and the Matias and the Bath protocols were implemented in Matlab® version 7.8 (The Mathworks, Natick, MA). The eMPC was written in C++.
Mean blood glucose, hyperglycemic index, 40 time-to-target range, time-in-target range from 4.4 to 6.1 mmol/L, sampling frequency, and number of hypoglycemic events were calculated. Presentation of results and statistical tests matched those used by Cordingley et al. 35 and Blaha et al. 25 In the “KUL versus RBH” study the independent sample t test was used to compare the two ICU populations. In the “Three Protocols” study one-way analysis of variance was followed by the post hoc Sidak test. Statistical analysis was performed using SPSS version 15 (SPSS Inc., Chicago, IL) or Matlab. The significance level was set at P < 0.05.
Results
RBH versus KUL study
The comparison of simulated and clinical results is shown in Table 3. Consistent with the clinical study, the simulations produced similar mean blood glucose and also similar mean time-weighted blood glucose. Other measures, such as the hyperglycemic index, the time spent in the target glucose range, and the mean insulin infusion rate, were also similar. The outcome that discriminated between the two ICUs in the clinical study as well as in simulations was the sampling interval, which was significantly longer at KUL. The numbers of mild (<3.3 mmol/L) and severe (<2.2 mmol/L) hypoglycemia episodes were comparable. Nutritional protocols were similar in simulations and clinical studies, but they differed between the two ICUs.
Data are mean (SD) or median (range) values.
Extracted from Cordingley et al. 35
Defined as the area under the curve above a glucose level of 6.1 mmol/L divided by the total length of stay.
Target glucose range from 4.4 to 6.1 mmol/L (80–110 mg/dL).
Plasma glucose measurements below 3.3 mmol/L (60 mg/dL).
Plasma glucose measurements below 2.2 mmol/L (40 mg/dL).
CHO, carbohydrate; KUL, Katholieke Universiteit, Leuven; NS, not significant; RBH, Royal Brompton Hospital.
Similar time-to-target was observed in the simulated KUL and RBH studies (4.9 [1.8–8.5) vs. 3.0 [1.8–7.8] h, KUL vs. RBH, P = not significant). However, these values were not reported in the clinical study, and a comparison with clinical results cannot be made.
Three Protocols study
The comparison of the simulations and the clinical study is presented in Table 4. The principal outcome of the second study was reproduced. In agreement with the clinical study, the eMPC demonstrated better performance compared with the Matias and Bath protocols as assessed by time when plasma glucose was in the target range between 4.4 and 6.1 mmol/L during the entire study and in the period after reaching the target range.
Data are mean (SEM) values.
Extracted from Blaha et al. 25
Risk of hypoglycemia range 2.9–4.3 mmol/L (52–77 mg/dL).
Blood glucose < 2.9 mmol/L (52 mg/dL).
Risk of hyperglycemia range 6.2–8.3 mmol/L (112–150 mg/dL).
Blood glucose > 8.3 mmol/L (150 mg/dL).
Blood glucose < 2.3 mmol/L (41 mg/dL).
Statistically significant difference from the Matias protocol (P < 0.05).
Statistically significant difference from the Bath protocol (P < 0.05).
eMPC, enhanced model predictive control.
The sampling interval in the simulated study was significantly longer in the eMPC group for the whole study period as well as in the period from reaching the target glucose range. Time to reach the target range was significantly shorter in the eMPC group compared with the Bath group in the simulations as well as in the clinical study. In the simulations the eMPC group spent less time in the hypoglycemia risk range compared with the Bath protocol. This difference was not demonstrated in the clinical study. In agreement with the clinical study results, time spent in the hyperglycemia range was significantly shorter in the eMPC group compared with the Matias and Bath protocol groups. The difference in time spent in the hyperglycemia risk range, however, was not demonstrated in the simulated study. The total number of severe hypoglycemia events was lower in the clinical than in the simulated study. In the simulations there were eight measurements of blood glucose <2.3 mmol/L in the Matias group compared with four such measurement in the Bath group and only two episodes of severe hypoglycemia in the eMPC group.
Supplemental validation
Supplemental validation adopted standard mathematical modeling approaches. 37 We assessed the precision of parameter estimates and observed an acceptable coefficient of variation of the parameter estimates (for time-invariant parameters, generally less than 80%; for time-varying estimate of insulin sensitivity, generally less than 25%). We assessed the goodness-of-fit through an assessment of distribution of residuals with acceptable results (data not shown). We assessed the physiological feasibility of parameters (see Supplementary Data for population parameter values). We also re-ran virtual subjects with their original nutritional inputs and demonstrated that the virtual population reproduced blood glucose patterns, insulin infusion patterns, and blood glucose sampling rate patterns (see Supplementary Data).
Discussion
The present study suggests that computer simulations may reliably assess the comparative performance of insulin titrating protocols. Principal findings of two published studies 25,35 comparing TGC protocols were well reproduced. Other outcomes were mostly replicated.
The simulations used a virtual population comprising 56 critically ill patients and generated from routine clinical data collected at four surgical and medical ICUs. 18,33 –36 Each virtual subject was generated from data collected in one critically ill patient. A subset of the virtual population consisting of six subjects has been previously shown to reproduce clinical outcomes. 28 The objective of the present study was to demonstrate the usefulness of the extended virtual population to make useful predictions for other study designs, populations, and algorithms.
In the “KUL versus RBH” study, 35 glycemic control by eMPC over a 72-h period was evaluated at two ICUs. The simulations adopted a matching experimental protocol and used an identical duration of the study period. The sampling interval was significantly shorter at RBH, an observation exactly reproduced by the simulations. Other outcomes such as mean glucose, the hyperglycemic index, the time in the target glucose range, and the insulin infusion rate were also similar. The simulations used virtual subjects originating from the respective ICUs. As nutritional input was retained during in silico cloning, institutional nutritional protocols were faithfully reproduced by the simulations. At KUL, fewer alterations of carbohydrate intake (1.3 ± 2.0 vs. 4.7 ± 1.7 per day, P < 0.01) were applied. This may explain, at least in part, the longer sampling interval at KUL. Additionally, a higher carbohydrate input was observed at KUL (10.0 ± 2.2 vs. 5.3 ± 1.8 g/h, KUL vs. RBH, P < 0.01) with a tendency toward elevated insulin delivery (4.5 ± 3.8 vs. 4.0 ± 2.3 U/h, P = not significant). Our previous analysis suggested that increases in carbohydrate input may lead to a shift in relative contributions from non–insulin- to insulin-mediated glucose disposal, increased fractional plasma glucose clearance, and reduced glucose equilibration time. 41 This may simplify the achievement of TGC as glucose levels more rapidly equilibrate following changes in insulin delivery.
The second study 25 compared three TGC protocols at CUP. We reproduced the clinical study as closely as possible. However, some differences were inevitable. The virtual population was heterogeneous (i.e., mixed medical and surgical admissions) compared with only surgical admissions in the clinical study; the virtual subjects originated from four different ICUs and did not reflect the nutritional policy at CUP. Additionally, initial blood glucose levels were not matched. Despite these differences, the simulations gave an identical main finding. The eMPC algorithm performed best of the three protocols as assessed by the time when glucose was in the target range without increasing the risk of severe hypoglycemia (Table 4). The time in the target range was well reproduced by the simulations after the target range was reached. Statistical significance levels in the mean glucose levels were reproduced exactly for the whole duration on the study. The trend after reaching the target range was preserved with lowest mean glucose in the eMPC group, followed by the Bath group and the Matias group. Unlike in the clinical study, the sampling interval calculated over the whole study period proved discriminatory, indicating the eMPC was requiring the fewest glucose measurements and the Bath protocol was requiring the highest number of measurements. Once the glucose target range was reached, the eMPC continued to require the fewest measurements.
In a finding consistent with the clinical study, the time to reach the target glucose range was significantly shorter in the eMPC group than in the Bath group. The trend in the time to target range was well preserved, although absolute values were lower during simulations, possibly because of differences in initial glucose values. Among the remaining measures, the time when glucose was in the risk of hypoglycemia indicated the eMPC algorithm to be superior to the Bath protocol but not to the Matias protocol, whereas the clinical study suggested that the eMPC is inferior to the other two protocols. The time in the risk of hyperglycemia and in the hyperglycemia range proved discriminatory in the clinical study, suggesting the eMPC was the best of the three protocols. In the simulations, the eMPC was also significantly better than the Bath and the Matias algorithms as far the time spent in the hyperglycemia range is concerned. The simulations did not discriminate between the protocols in terms of the risk of hyperglycemia. The higher number of severe hypoglycemia events with glucose measurements below 2.3 mmol/L in the simulated study could be explained by a more heterogeneous virtual population and differing nutritional protocols or, alternatively, by model inaccuracies.
The rationale for using computer simulations for the preclinical assessment of glycemic control algorithms is simple and appealing. A set of virtual rather than real subjects is subjected to experimentation. A valid virtual population will provide useful information about the expected performance of glucose control algorithms. Subsequent clinical testing can focus on confirming predictions. In the intensive care settings simulations were also used by Chase et al., 13 Le Compte et al., 42 and Van Herpe et al. 27 These simulations predict short-term glucose excursions rather than longer-term glucose profiles as in our study. The other difference is that we used data from several ICUs to generate the virtual population. Our study validates simulations using clinically relevant outcomes.
Our validation approach has several limitations. The simulations were done retrospectively and not prospectively. Prospective evaluations involving different ICU populations and different TGC protocols would be beneficial. In the “KUL versus RBH” study, RBH virtual subjects originated from that particular study as we were limited by availability of virtual subjects from RBH. In all other simulations, virtual subjects originated from clinical studies unrelated to the two clinical studies we reproduced. We did not evaluate the accuracy of individual predictions. The virtual population overestimated hypoglycemia episodes in the “Three Protocols” study, but this could be helpful for the development of hypoglycemia-averse algorithms. The comparisons of virtual and clinical studies focused on reported clinically relevant outcomes and did not consider other measures such as variances.
Model limitations are that temporal variations in the three insulin sensitivities parallel each other. There is limited understanding of the relationship between temporal changes in peripheral and liver insulin resistance in health and during critical illness. Time-varying insulin sensitivity represents disease-attributable but also drug-induced effects that we are unable to uncouple. We do not model comedication such as glucocorticoids or glucagon delivery. The estimation of endogenous insulin secretion is based on population but not individual data as plasma insulin and plasma C-peptide levels were not measured.
Differences exist in a few secondary metrics between the clinical and simulated studies. The differences can originate either from inherent shortcomings of the model or reflect natural study-to-study variability due to random effects. Most likely the observed differences arise from combination of these two factors, but the important issue is that the main findings are replicated.
The virtual subjects retain characteristics of the originating ICU such as the nutritional protocol and, intrinsically through the time-variant insulin sensitivity, other treatment procedures and comedication. The use of a virtual population originating from one institution to predict outcomes at another institution may introduce a bias as observed in the “Three Protocols” study. In our opinion, this is preferable to the adoption of alternative nutritional protocols. Given the way virtual subjects are created, accuracy of prediction is excellent for the originating nutritional protocol and the originating insulin delivery. Departure from the originating nutritional protocol reduces accuracy of predictions. Our approach was to limit changes in the input during simulations; we retained the originating nutritional protocol and altered insulin delivery as directed by glycemic control algorithms. Further investigations may be warranted to investigate the effect of alternative nutritional protocols on the accuracy of predictions.
Simulations have been used extensively for preclinical testing of insulin delivery algorithms in subjects with type 1 diabetes, 30,43 supporting the development of the so-called artificial pancreas. 44 The use of simulations is growing with a wide range of applications from basic research 45 to applied use. 46 The most important aspect—the accuracy of predictions while building valid virtual populations—remains a scientific challenge.
Conclusions
Computer simulations may be useful to evaluate and compare glycemic control protocols as demonstrated by the ability of our virtual population to reproduce the principal findings of two clinical studies.
Footnotes
Acknowledgments
This study was supported by the European Commission 6th Framework Programme (grant IST-2002-506965), the NIHR Cambridge Biomedical Research Centre, and the Czech Ministry of Education, Youth, and Sports (research project MSM0021620814).
Author Disclosure Statement
R.H. is a consultant for BBraun. M.E. is an part-time employee of BBraun. L.J.C., J.B., J.J.C., N.C.D., M.H., J.P., D.V., M.E.W., and P.J.W. declare that they have no competing interests.
References
Supplementary Material
Please find the following supplemental material available below.
For Open Access articles published under a Creative Commons License, all supplemental material carries the same license as the article it is associated with.
For non-Open Access articles published, all supplemental material carries a non-exclusive license, and permission requests for re-use of supplemental material or any part of supplemental material shall be sent directly to the copyright owner as specified in the copyright notice associated with the article.