
Abstract
Background:
Prediction of the future blood glucose (BG) evolution from continuous glucose monitoring (CGM) data is a promising direction in diabetes therapy management, and several glucose predictors have recently been proposed. This raises the problem of their assessment. There were attempts to use for such assessment the continuous glucose-error grid analysis (CG-EGA), originally developed for CGM devices. However, in the CG-EGA the BG rate of change is estimated from past BG readings, whereas predictors provide BG estimation ahead of time. Therefore, the original CG-EGA should be modified to assess predictors. Here we propose a new version of the CG-EGA, the Prediction-Error Grid Analysis (PRED-EGA).
Methods:
The analysis is based both on simulated data and on data from clinical trials, performed in the European FP7-project “DIAdvisor.” Simulated data are used to test the ability of the analyzed CG-EGA modifications to capture erroneous predictions in controlled situation. Real data are used to show the impact of the different CG-EGA versions in the evaluation of a predictor.
Results:
Using the data of 10 virtual and 10 real subjects and analyzing two different predictors, we demonstrate that the straightforward application of the CG-EGA does not adequately classify the prediction performance. For example, we observed that up to 70% of 20 min ahead predictions in the hyperglycemia region that are classified by this application as erroneous are, in fact, accurate. Moreover, for predictions during hypoglycemia the assessments produced by the straightforward application of the CG-EGA are not only too pessimistic (in up to 60% of cases), but this version is not able to detect real erroneous predictions. In contrast, the proposed modification of the CG-EGA, where the rate of change is estimated on the predicted BG profile, is an adequate metric for the assessment of predictions.
Conclusions:
We propose a new CG-EGA, the PRED-EGA, for the assessment of glucose predictors. The presented analysis shows that, compared with the straightforward application of the CG-EGA, the PRED-EGA gives a significant reduction of the misclassification cases. A reduction by a factor of at least 4 was observed in the study. Moreover, the PRED-EGA is much more robust against uncertainty in the input and references.
Introduction
Examples of the assessment metrics adopted in the literature include Clarke error grid analysis, 5 mean relative absolute deviation percentage, 6,7 and the continuous glucose-error grid analysis (CG-EGA), 7,8 with CGM data serving as the reference in all cases.
Simple illustration can demonstrate that among these metrics the CG-EGA is the most sensitive in the recognition of different prediction performances. It can be seen from Figure 1 where the horizontal line, paired with each of the other four lines, stays for a prediction versus reference plots, such that we have four performance configurations, which are, of course, different from the clinical viewpoint. For example, the prediction of a stable glucose concentration at the background of a fall in the hypoglycemic phase depicted in the left panel of Figure 1 should be considered more dangerous than the same prediction at the background of a recovery from the hypoglycemia shown in the right panel.
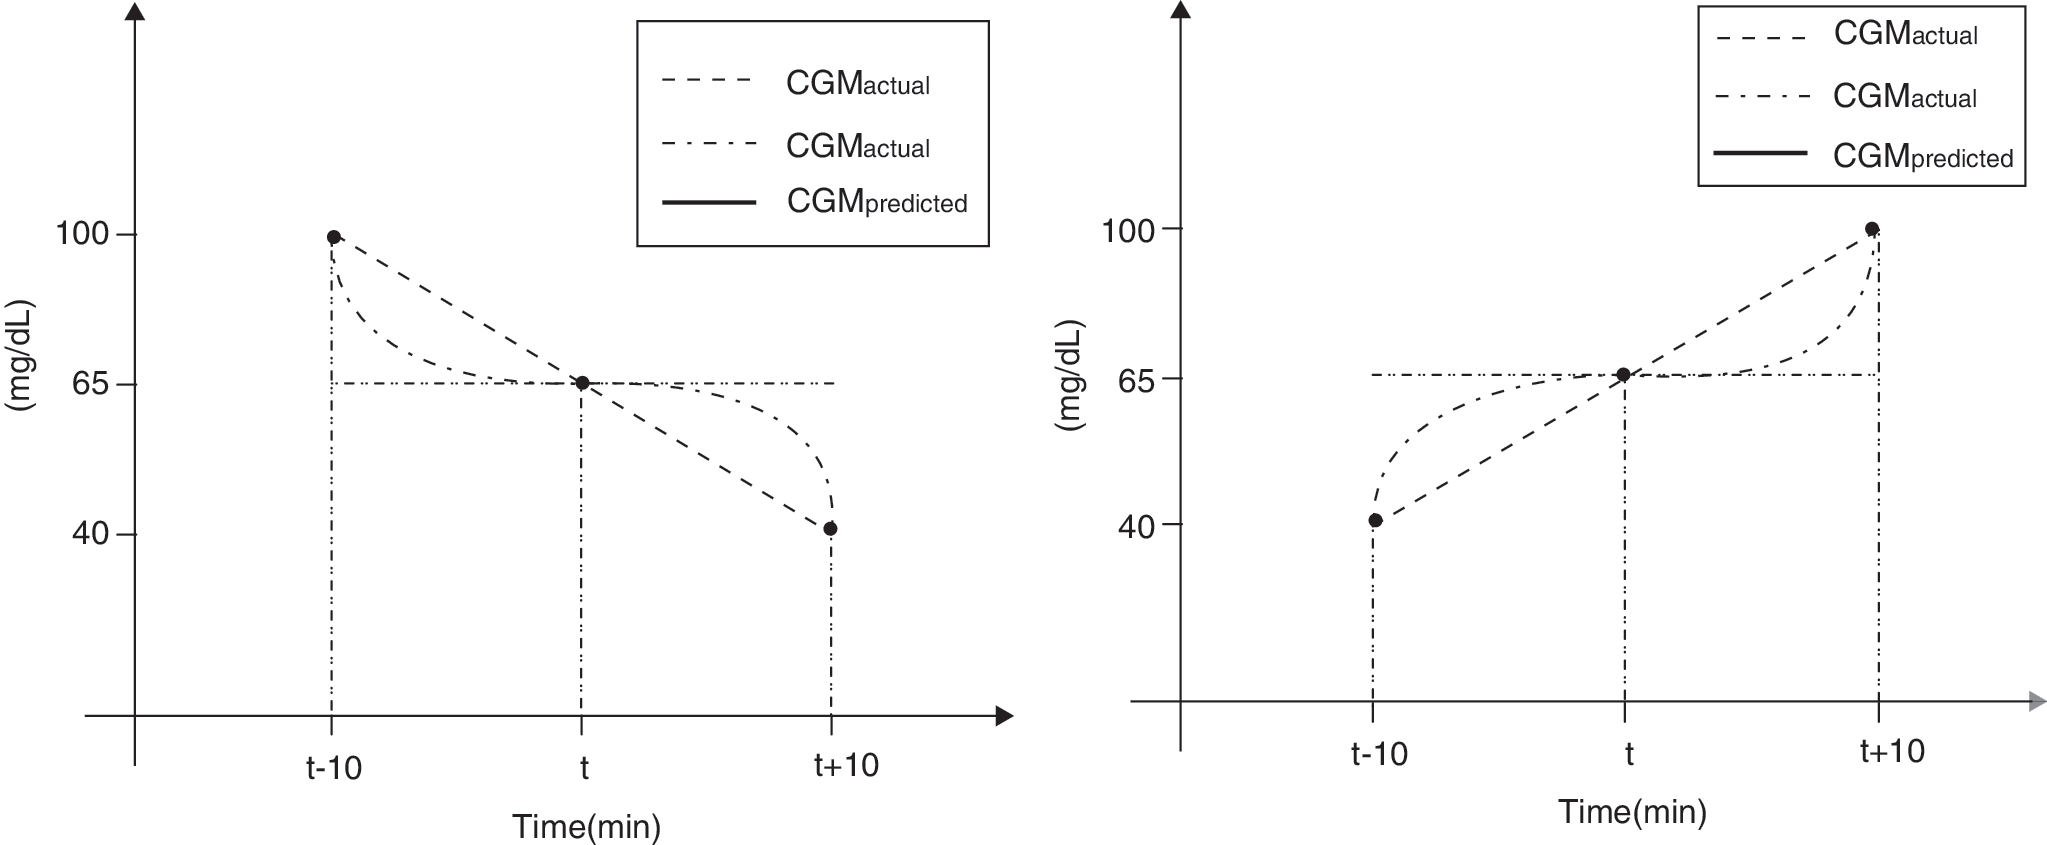
Simple illustration demonstrating the sensitivity of the continuous glucose error grid analysis approach. CGM, continuous glucose monitoring.
It is easy to check that for three assessment moments t −10, t, and t +10 (in min), traced on Figure 1, the mean relative absolute deviation percentage has the same value for all these configurations, and the Clarke error grid analysis is also not able to distinguish between them, indicating 67% in zone A and 33% in zone B for all cases.
At the same time, only the CG-EGA provides different assessment results for all performance configurations considered.
Namely, the predictions for the three moments traced in the left panel of Figure 1 are assessed as follows: 100% of erroneous predictions during hypoglycemia and 100% of benign errors during normoglycemia for the plot “horizontal line versus inclined line”; 50% of accurate and erroneous predictions during hypoglycemia and 100% of benign errors during normoglycemia for the plot “horizontal line versus curve-shaped line.”
For the right panel of Figure 1 the CG-EGA yields 100% of benign errors during hypo- and normoglycemia for the plot “horizontal line versus inclined line,” whereas for the plot “horizontal line versus curve-shaped line” the values are 50% of accurate and benignly erroneous predictions during hypoglycemia and 100% of benign errors during normoglycemia.
At this point it is noteworthy that demonstrated sensitivity in recognition of different prediction performances is due to the fact that the CG-EGA accounts for direction and rates of glucose change. Both of them are measured, in fact, by values of time derivatives calculated at the assessment moments for reference as well as for assessed glucose profile. Just the knowledge of these values allows us to distinguish all performance configurations in Figure 1. Therefore, only in the ideal situation of continuous signal and thus perfect derivative would the CG-EGA be the “gold standard” error grid analysis for the prediction assessment.
However, in practice the exact values of time derivatives are not given but can only be estimated by means of approximate formulae, such as, for example, a backward difference, a forward difference, or the central difference, which are well known and can be found in the Appendix.
Moreover, recall that the CG-EGA was originally developed for quantifying the accuracy of CGM devices, 9,10 which at an assessment time, say t=ti , do not provide any information for the future time step t=ti +Δt, where Δt is a fixed elapsed time between two successive CGM readings. Therefore, in the original CG-EGA the rates of glucose change are estimated backward in time.
In contrast, predictors provide a glucose estimation ahead of time, and it paves a new way for estimating the rates of glucose change. As a result, several versions of the CG-EGA can be proposed for the prediction assessment.
The aim of this study is to analyze them with respect to adequateness to judge upon the prediction accuracy and to robustness to approximation and data errors. By resorting to the analysis of the performance of a particular glucose predictor on several simulated and clinical data sets, this work shows that the straightforward application of the original CG-EGA, as it was developed for CGM systems, does not adequately classify the prediction performance. In contrast, a proposed modification of the CG-EGA, where the rates of change are estimated on predicted and reference profiles by means of the central difference, is a very rigorous metric for the prediction assessment.
We also argue that the conclusion that the proposed modification of the CG-EGA is more adequate in assessing glucose predictors than the original CG-EGA, is general, and does not depend on a particular predictor. To demonstrate this, we apply the compared metrics to assess the performance of the simplest glucose predictor known as “projection ahead” of the current glucose trend. 11 Then the assessment results support the conclusion made on the basis of the predictor that was used first.
Experimental Procedures
Versions of the CG-EGA for glucose predictors
Following the CG-EGA methodology 9,10 to assess the accuracy of a glucose predictor, one should record reference glucose estimates paired with the estimates predicted for the same moments and look at the two essential aspects of the clinical accuracy: rate error grid analysis (R-EGA) and point error grid analysis (P-EGA). The modifications of the CG-EGA we consider are based on the same rate error grid and point error grid as proposed for the assessment of CGM systems. 9,10 The difference between these modifications is in the way of estimating the rate of glucose change.
Let
Let now X(t, τ) be a predicted value of the glucose concentration at time τ (min) in the future, when the prediction is made at time t<τ. Then for a fixed prediction horizon PH a predicted value of the glucose concentration X predicted(ti ) for the future time t=ti is given as X predicted(ti )=X(ti −PH,ti ).
From a time series viewpoint each item of the reference time series
and then plotted against the reference rate given by Eq. 1.
This version of the CG-EGA has been already used in the literature for the assessment of the glucose predictors, 7,8 and we will refer to it as the Prediction-Error Grid Analysis (PRED-EGA), version 0.
The other versions of the PRED-EGA, which we are going to present, originate from the observation that for a fixed PH all the predictors described in the literature
3
–7
can predict not just the glucose concentration at time t=ti
, but the whole future glucose profile as a function of time X
predicted(t)=X(ti
−PH,t) for t≥ti
−PH. Then the predicted rate of change
Thus, the three well-known approximate formulae for the first derivative lead to three different versions of the PRED-EGA, where the reference rate of change and its predicted counterpart are estimated by the pairs of formulae Eqs. 1 and 5, Eqs. 2 and 6, or Eqs. 3 and 7. In the following we will refer to them as the PRED-EGA, versions 1, 2, and 3, respectively.
As we already mentioned, in practice CGM readings, which are used for predictions and for references, are given with a fixed elapsed time Δt. For several widely used CGM sensors we have Δt=5 (min). It means that in above-mentioned formulae for rates of change the value of Δt cannot be chosen at will. Therefore, the reliability and robustness of these approximate formulae with fixed Δt should be tested prior to using them on clinical data.
Such reliability and robustness tests can be made with simulated data, which allow an accurate calculations of
Subjects and dataset
The dataset contains the data of 100 virtual subjects and 10 real subjects. The virtual subjects data are obtained from Padova/University of Virginia simulator. 12 For each in silico patient the CGM readings have been simulated and sampled with a frequency of 1 min during 3 days. We perform our reliability and robustness tests with data of 10 virtual subjects provided by the Padova/University of Virginia simulator. 12 Data of the first three subjects (Virtual ID 1, 2, and 3) have been randomly chosen from 100 traces generated by the simulator. The other seven data sets (Virtual ID 17, 18, 24, 33, 34, 42, and 47) have been chosen because they contain both hypo- and hyperglycemic periods.
The data of 10 real subjects were collected during two clinical trials (1A and 1B) that were performed in the Centre d'Investigation Clinique du CHU de Montpellier, Montpellier, France within the framework of the European FP7-project “DIAdvisor.” The subjects considered have been diagnosed with type 1 diabetes and treated with insulin for at least 12 months before the trials; their ages are between 18 and 70 years. During the study, the BG estimates were sampled every 5 min using a CGM sensor. In the “DIAdvisor 1B” trial such information was collected during 3 days, whereas in the “DIAdvisor 1A” trial it was done during 2 days. The patients consumed three meals per day (40 g of carbohydrates at breakfast, 70 g at lunch and dinner) and decided on their insulin need according to the current BG level.
Glucose predictors used in the study
It is clear that a comparison of different versions of the PRED-EGA can only be done on the basis of some glucose predictor. In our study the role of such a basic predictor is played by an algorithm, which is based on adaptive kernel methods. 13,14
The current version of the algorithm is portable from individual to individual without being readjusted. It was trained on the data, which are not used in the present study. The performance of the current version of the algorithm has been demonstrated recently in the presentation of the project “DIAdvisor.” 15 An input for the algorithm consists of six CGM readings from the past 25 min. Note that in contrast to some other studies, 5,7,8 no data preprocessing/smoothing has been made before applying our basic glucose predictor.
Moreover, to demonstrate that the conclusions of this study are related not only with our basic predictor, we also analyze in the Appendix the performance of the simplest glucose predictor, which is based on the linear extrapolation and uses the current and 5-min-old CGM readings as the prediction input.
Results
Tests with simulated data against the “gold standard” PRED-EGA
As we already mentioned, to implement the ideal version of the PRED-EGA, which will be used as the “gold standard” assessment metric, one should know accurate values of the derivatives
Such knowledge is available when one deals with simulated data used as predictor inputs and references. Table 1 demonstrates the performance assessment matrix given by the ideal version of the PRED-EGA for 20 min ahead glucose predictions, when our basic predictor is applied to the set of simulated data. The assessment matrix is presented in the format that is usual for CG-EGA methodology. 9
BG, blood glucose.
Note that even through the simulator can produce virtual CGM readings every 1 min, in our tests we try to mimic the data flow from some widely used CGM sensors, when a new reading appears every 5 min and updates the prediction input. It means that a new predicted glucose profile is produced every Δt=5 min, and all versions of the PRED-EGA (including the “gold standard”) are applied to assess the predictions at time moments ti
=i×Δt,
In Tables 2 and 3 we present the performance assessment matrices given by the PRED-EGA, versions 0 and 3, respectively (for the sake of brevity we do not present here the matrices given by other versions).
BG, blood glucose.
BG, blood glucose.
To quantify the differences in the assessment between the “gold standard” and other versions of the PRED-EGA, we use one of usual matrix norms that measures the distance between two (assessment) matrices {aij
} and {bij
},
Here aij or bij is a percentage of accurate, benign, or erroneous predictions indicated in the i-th row and j-th column of the corresponding assessment matrix (for example, for the matrix in Table 3, a 55=0).
In the present context the meaning of such distance is that for each particular subject the differences in the prediction assessment are summed up over glycemic regions, and then for a group of subjects considered the largest such quantity is taken as the distance between assessment matrices. It is clear that the larger such distance is, the more difference in the assessment is.
In the first row of Table 4 one can find the distances between the assessment matrices, produced by different versions of the PRED-EGA, and the matrix appearing as a result of the assessment by means of the “gold standard” PRED-EGA. From these distance values one can conclude that versions 2 and 3 are much closer to the “gold standard” than version 0.
The first row of Table 4 is related with the situation, where a virtual CGM device (the simulator) is assumed to provide accurate (reference) glucose readings. A more realistic situation can be modeled by adding white noise to the simulated readings and then by using them as predictor inputs and references. In this way we can assess the effect of the noise on the choice of the best version of the metric.
The prediction assessment matrices, produced in such a situation by versions 0, 2, and 3 of the PRED-EGA, have been calculated for the case when simulated CGM readings have been corrupted by white noise with an SD of 6 (mg/dL). The distances between these matrices and the assessment matrix from Table 1 produced by the “gold standard” PRED-EGA are presented in the second row of Table 4.
From Table 4 it follows that among the versions considered, version 3 of the PRED-EGA is the most reliable and robust because it stays closer to the “gold standard” for both noise-free and noisy simulated data.
Assessment of the prediction from clinical data
In this section we compare the assessments provided by the PRED-EGA version 3 for the performance of our basic predictor on data from two clinical trials with those that are provided by the PRED-EGA version 0, and demonstrate that the first ones are more adequate.
As reference and predictor inputs we use the BG estimates provided every 5 min by CGM systems for five patients involved in the “DIAdvisor 1A” trial (their ID start with the letter A; the data were collected during 2 days) and for the same number of patients taking part in the “DIAdvisor 1B” trial (ID numbers start with the letter B; the data were collected during 3 days).
Prediction assessments given by the above-mentioned versions of the PRED-EGA are presented in Tables 5 and 6.
BG, blood glucose.
BG, blood glucose.
Using the matrix distance defined above, we can observe essential differences in assessments produced by the versions of the PRED-EGA under study. For matrices from the Tables 5 and 6 this distance is equal to 256.81.
However, dealing with real clinical data one is not able to implement the ideal version of the PRED-EGA and use it as the “gold standard” for a comparison with other versions and for making a conclusion about their adequateness.
At the same time, from extensive case analysis it turns out that up to 70% of predictions in the range of hyperglycemia, which are classified by the PRED-EGA version 0 as erroneous, are, in fact, accurate, and they are properly classified as such by the PRED-EGA version 3.
To illustrate this, let us closely look at the prediction assessments for two representative subjects A 121 and A 131, for which the difference between versions 0 and 3 is the most visible.
From the first two rows of Table 7 one can see that for the two patients considered version 0 failed in detection of erroneous predictions, whereas version 3 really detected them.
The situation is similar for the prediction assessment during normo- and hypoglycemia.
As an example, we can present the assessments for another two patients for whom the difference between versions 0 and 3 is again the most visible.
From the last two rows of Table 7 one can see that version 0 either misclassifies predictions as erroneous (subject B 130) or is not able to detect really erroneous ones (subject B 136). Typical examples are given in Figures 2 and 3.

A representative example of the accurate prediction during hypoglycemia, which is (

A representative example of the erroneous prediction during hypoglycemia, which is (
One may think that the conclusion about the inadequateness of the PRED-EGA version 0 for the assessment of predictions is only true with respect to the basic predictor used in the above study. To show that it is not the case, we apply both versions 0 and 3 of the PRED-EGA to assess the performance of the simplest glucose predictor, which is based on the linear extrapolation of the current and past CGM values. Such a predictor is also known as “projection ahead” of the current glucose trend. 11
In Tables A1 and A2 of the Appendix we present the performance assessment matrices (the distance between them is equal to 299.63) given by the PRED-EGA versions 0 and 3 for this predictor, when it operates on the same clinical data as our basic predictor. These tables allow the same conclusion as the analysis reported above for the basic predictor: namely, for predictions during normo- and hyperglycemia, the assessment given by the PRED-EGA version 0 is too pessimistic—in the majority of cases (up to 70%) the predictions, which are classified as erroneous or benignly erroneous, are, in fact, accurate and properly classified in the PRED-EGA version 3. Table A3 of the Appendix presents an example of this situation for a representative subject (A 121).
Moreover, for predictions during hypoglycemia the assessment given by version 0 is not only too pessimistic, but this version of the PRED-EGA is not able to detect real errors. An example for a representative subject (A 103) is presented in Table A3 of the Appendix.
In conclusion, independently of the predictor used, PRED-EGA version 3 is the most accurate metric to assess predictor performance.
Conclusions
The main message of this study is that the straightforward application of the CG-EGA methodology in the form developed for quantifying the accuracy of CGM devices does not adequately classify the performance of glucose predictors.
At the same time, several prediction-oriented modifications of the CG-EGA can be proposed. In this study we have analyzed them and suggested the most reliable and robust one. We call this new version of the CG-EGA the “Prediction-Error Grid Analysis” (PRED-EGA, version 3) and recommend it as one of the assessment tools of choice when measuring the accuracy of glucose predictors.
At the same time, the goal of this article is also to attract attention to the problem of the assessment of glucose predictors. In particular, another modifications of the CG-EGA can be studied, where a dynamic zone adjustment in the point-error grid is governed by the values of PHs.
Another direction of research is the study of a new index that has been introduced recently for comparing CGM glucose prediction algorithms. 16
Footnotes
Acknowledgments
This study has been pursued because of the need for the evaluation of glucose predictors in the European FP7-project “DIAdvisor” (
Author Disclosure Statement
The authors state that there are no competing financial interests that are related to this article.