
Abstract
Background:
The metabolic clearance rate (MCR) of glucose has been defined as the value of the glucose infusion rate (GIR) divided by the glucose concentration and could be thus expected to be a robust marker at various glucose concentrations.
Methods:
We evaluated the validity of MCR compared with GIR in 15 healthy subjects and 38 type 2 diabetes patients. The glucose clamp technique was performed at two different glucose levels—isoglycemia (fasting plasma glucose [FPG]) of each subject and euglycemia (100 mg/dL), consecutively. GIR and MCR were obtained at both glucose levels, and ratios of those at isoglycemia to euglycemia were calculated.
Results:
Although there was no obvious relationship between FPG levels and GIR ratio, the MCR ratio showed a good linear regression with FPG levels (r=−0.652, P<0.0001). Furthermore, MCR at FPG was excellently (r=0.955) correlated with that at euglycemia in comparison with the modest correlation of GIR between the two plasma glucose levels (r=0.876).
Conclusions:
GIR was rather variable and not proportional to clamped plasma glucose levels. MCR was a less variable parameter than GIR at various plasma glucose levels, and MCR at FPG in the isoglycemic clamp study could be substituted for GIR at the euglycemic clamp study.
Introduction
In this context, some investigators will clamp blood glucose at fasting levels (isoglycemic), 2 whereas others will clamp blood glucose at an arbitrary predetermined level of glycemia within the normal range (euglycemic). In the case of diabetes subjects, the difference between euglycemia and isoglycemia may be large. There are pros and cons to choosing either approach for subjects with and without diabetes. 3 The rationale for performing isoglycemic clamps in diabetes subjects is that large acute changes in glycemia may alter insulin sensitivity. For diabetes subjects under isoglycemic conditions, it may be necessary to correct GIR for urinary losses of glucose. Furthermore, GIR under isoglycemic clamps must be corrected by clamped glucose levels, especially in diabetes patients with high fasting plasma glucose (FPG) levels.
The metabolic clearance rate (MCR) of glucose has been defined as the value of GIR divided by the glucose concentration 4 and could be thus expected to be a robust marker under various glucose concentrations. The concept that MCR is a measure of glucose disposal independent of glucose concentration is largely based on the assumption that glucose disposal is proportional to glucose concentration. 5 However, non–insulin-dependent tissues such as brain account for most of the glucose utilized during fasting condition and may not increase glucose uptake in proportion to the rise of ambient glucose concentration. 6 Therefore, it is plausible that glucose uptake may be saturated over some glucose concentration range, especially in non–insulin-dependent tissues. 7
Because the robustness and accuracy of MCR for the evaluation of insulin sensitivity at various glucose concentrations have not been ascertained thus far, in the present study MCR under isoglycemic hyperinsulinemic GC was calculated and compared with GIR at euglycemia as a reference.
Subjects and Methods
Study subjects
Fifteen healthy volunteers (11 men and four women) with a mean (±SD) age of 39±11 years and body mass index of 20.7±3.4 kg/m2 participated in the study. None of the subjects had a family history of diabetes. Patients with type 2 diabetes mellitus (T2DM) were randomly selected from patients admitted to the endocrinology and metabolism ward in Kurume University Hospital (Kurume, Japan) from November 2007 to December 2009. After the stabilization period for metabolic parameters (7±2 days after admission) such as blood glucose, blood pressure, and lipid profile, the eligibility of each patient was evaluated. Patients with excessive alcohol consumption (more than 120 g of ethanol/day), severe liver dysfunction (viral hepatitis or liver cirrhosis), renal dysfunction (serum creatinine concentration >1.5 mg/dL), known malignant disease, and chronic inflammatory disease (e.g., rheumatoid arthritis) were excluded from the study. Furthermore, patients with FPG >170 mg/dL were excluded, taking urinary loss of glucose into account. In total, 38 T2DM patients (17 men and 21 women, 58±16 years old, body mass index of 23.5±4.9 kg/m2, and glycosylated hemoglobin of 7.4±1.2% [Japanese Diabetes Society value]) were eligible, and urinary sugar was not detected by glucose test paper (Terumo Co., Tokyo, Japan) examination during the fasting state in any patient. Fifteen patients had not been given any medication for diabetes, whereas eight had been treated with sulfonylurea, 12 with biguanide, six with α-glucosidase inhibitor, and five with insulin. Patients treated with oral hypoglycemic agents were instructed to cancel their medications for the day before GC (for at least 24 h) according to the half-life of each drug indicated in the instructions from each pharmaceutical manufacturer. Patients treated with long-acting or intermediate-acting insulin in the evening or before bedtime were instructed to omit it the day before GC. Statin was administered in eight patients for the treatment of dyslipidemia, including one patient further treated by fibrate. Angiotensin-II receptor blocker was administered in three patients for the treatment of hypertension. Both healthy subjects and diabetes patients were on their usual diet, and none was engaged in heavy exercise the day before GC.
All subjects gave their written consent after being informed. The study was performed in accordance with the Declaration of Helsinki and approved by the ethics committee of Kurume University School of Medicine.
Blood samplings and measurements
After an overnight fast without any medication, including oral hypoglycemic agents or insulin, in the morning, body weight, waist circumference, and blood pressure were measured, and blood samples were obtained from the antecubital vein into fluoride tubes for analysis of FPG and into plain siliconized tube for other measurements. Blood samples were then immediately centrifuged at 4°C and stored at −70°C until the assays.
FPG, low-density lipoprotein-cholesterol, high-density lipoprotein-cholesterol, and triglycerides were measured according to the standard procedures. Fasting insulin level (FIRI) was measured by an enzyme-linked immunosorbent assay. Systolic and diastolic blood pressures were measured by an automatic electronic sphygmomanometer (model BP-103i II; Colin Medical Technology Co., Komaki, Japan) with the patient in the sitting position after resting for at least 5 min. Waist circumference was measured in a horizontal plane, midway between the inferior margin of the ribs and the superior border of the iliac crest according to the guideline of the International Diabetes Federation. 8 Homeostasis model assessment of insulin resistance (HOMA-IR) was calculated from FPG and FIRI according to the report by Matthews et al. 9 with the formula: HOMA-IR=FIRI×FPG/405.
Isoglycemic and euglycemic hyperinsulinemic GC study
After blood sampling, clamp study was performed according to the method of DeFronzo et al. 1 using an STG 22 artificial pancreas model (Nikkiso Co., Tokyo) as described in a previous report. 10 In brief, insulin (Humulin® R, Eli Lilly & Co., Indianapolis, IN) was loaded during the first 10 min of the clamp in priming doses followed by infusion in a continuous fashion at a rate of 1.25 mU/kg/min. Blood glucose levels were determined every 5 min during the clamp study, and isoglycemia (FPG) was maintained by infusion of variable amounts of 25% glucose solution, which were determined by the built-in computer program according to the control algorithm. The whole-body glucose disposal rate at isoglycemia was determined as the mean of the GIR during the last 30 min of the 2-h clamp study. Consecutively, the target glucose concentration was then adjusted to euglycemia (100 mg/dL), and GIR was again determined during the last 30 min of the next 2-h clamp study. The coefficient of variation for GIR was 5.4±1.2% at the first clamp and 4.8±0.9% at the second clamp study. The coefficient of variation for plasma glucose (PG) level during the last 30 min was 1.6±1.0% at the first clamp and 2.0±0.9% at the second clamp study. The mean steady-state plasma insulin level was 122.7±31.1 μU/mL at the first clamp and 125.6±34.6 μU/mL at the second clamp study. Steady-state plasma insulin in healthy volunteers was 111.3±28.4 μU/mL at the first clamp and 115.4±31.5 μU/mL at the second clamp study. Steady-state plasma insulin in T2DM patients was 132.6±41.2 μU/mL at the first clamp and 136.7±43.4 μU/mL at the second clamp study. Those insulin concentrations are reported to be high enough to efficiently suppress hepatic glucose output. 11
Because the prolonged hyperinsulinemia is known to increase GIR gradually, 12 we further evaluated the time course of GIR and PG level during the last 30 min of each clamp study, disclosing the mean values of those parameters during both the first 15 min and the next 15 min. GIR was 5.44±2.32 mg/kg/min and 5.56±2.39 mg/kg/min, respectively, at isoglycemia and 6.67±3.02 mg/kg/min and 6.83±3.03 mg/kg/min, respectively, at euglycemia. The PG level was 115±31 mg/dL and 116±31 mg/dL, respectively, at isoglycemia and 97±4 mg/dL and 97±3 mg/dL, respectively, at euglycemia. Marginal increases in GIR and PG were observed during both clamp studies, but those differences did not reach statistical significance in either case.
MCR (in mL/kg/min) was calculated with each GIR divided by either FPG or 100. 4
Statistical analysis
All tests were performed using SAS version 9.2 (SAS Institute Inc., Cary, NC). Data are mean±SD values. For comparisons of baseline values between healthy subjects and T2DM patients, Student's unpaired t test was used for parametric data, and the χ2 test ws used for nonparametric data. The ratios of GIR and MCR at isoglycemia to those at euglycemia were plotted as a function of FPG levels to evaluate the changes of GIR and MCR between the two clamp studies using Pearson's correlation coefficient. The relationships of GIR and MCR between the two clamp studies were also analyzed by Pearson's correlation coefficient. P values of <0.05 were considered as statistically significant.
Results
Characteristics of subjects
As shown in Table 1, healthy subjects were younger and less insulin resistant and showed smaller body mass index, higher high-density lipoprotein-cholesterol, and lower triglyceride levels compared with T2DM patients.
Data are mean±SD values or number of subjects. Student's unpaired t test or χ2 test was used for statistical analysis.
BMI, body mass index; DBP, diastolic blood pressure; FIRI, fasting insulin level; FPG, fasting plasma glucose; HDL-C, high-density lipoprotein-cholesterol; HOMA-IR, homeostasis model assessment of insulin resistance; LDL-C, low-density lipoprotein-cholesterol; NS, not significant; SBP, systolic blood pressure; T2DM, type 2 diabetes mellitus; TG, triglycerides; WC, waist circumference.
Impact of clamped PG level on GIR or MCR
As shown in Figure 1, there was no obvious relationship between PG levels at isoglycemia (FPG) and GIR ratio, which means that any particular change of GIR was not observed between those two clamp PG levels (isoglycemia and euglycemia). However, after the adjustment of GIR by clamped PG levels, the MCR ratio showed a good linear regression with FPG levels (r=−0.652, P<0.0001) (Fig. 2). A negative correlation was in particular distinct in T2DM patients with FPG over 100 mg/dL, which means a decline of MCR in relation to the increase of clamped PG levels at isoglycemia. The clamp study at a PG level of 100 mg/dL means isoglycemic clamp as well as euglycemic clamp, simultaneously. In this context, it is noteworthy that the MCR ratio corresponding to a clamped PG level of 100 mg/dL is around 1 according to the regression line, indicating the validation of MCR for the evaluation of insulin sensitivity at various clamped PG levels.
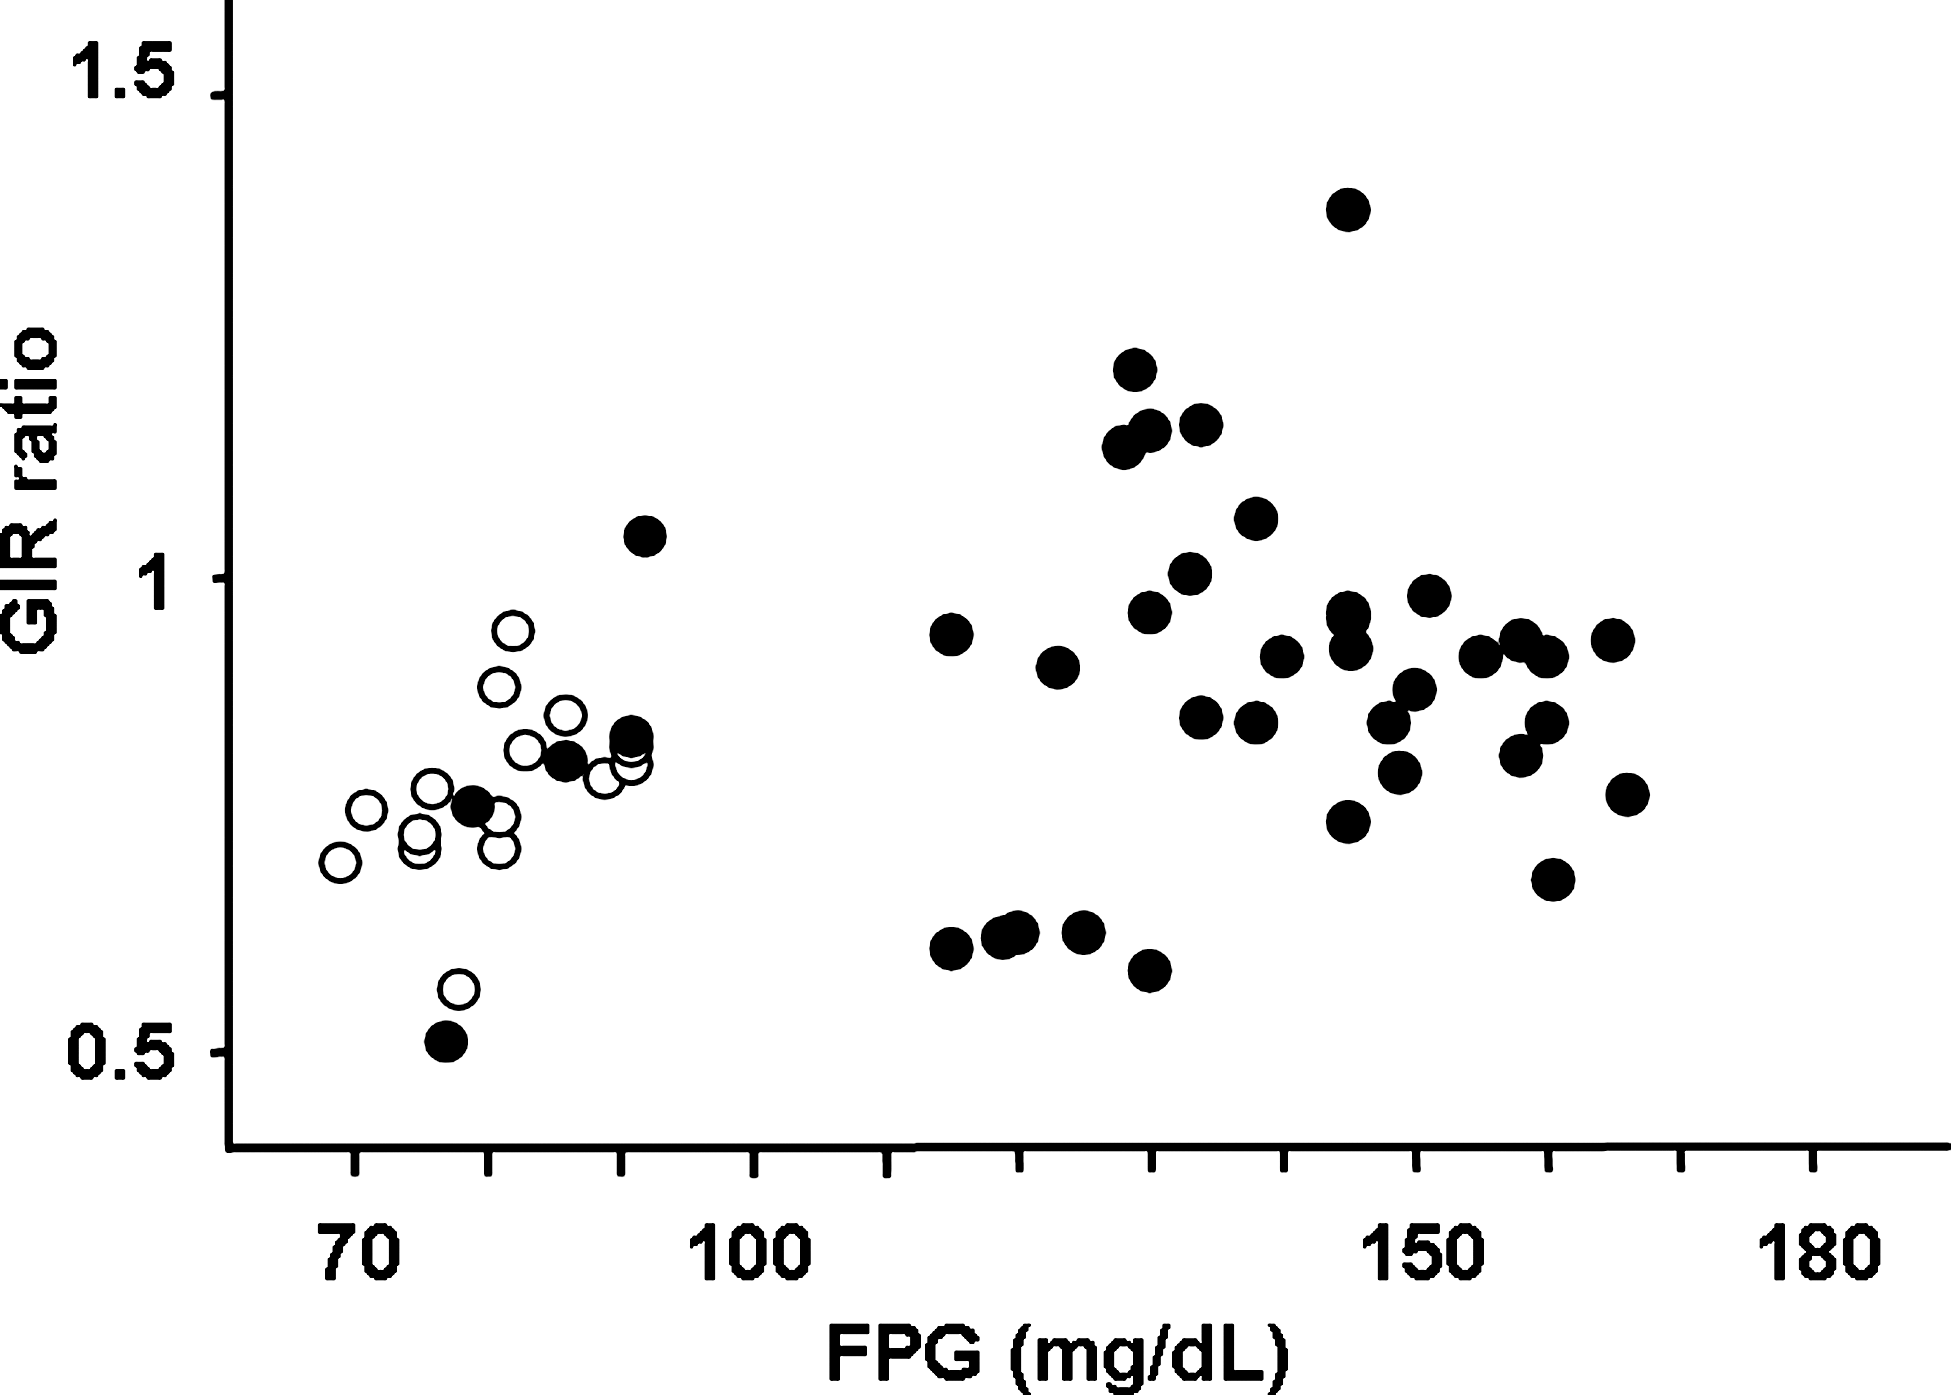
The ratio of glucose infusion rate (GIR) at isoglycemia to that at euglycemia as a function of fasting plasma glucose (FPG) levels in healthy subjects (open circles) and type 2 diabetes patients (closed circles). Pearson's correlation coefficient was used for statistical analysis.
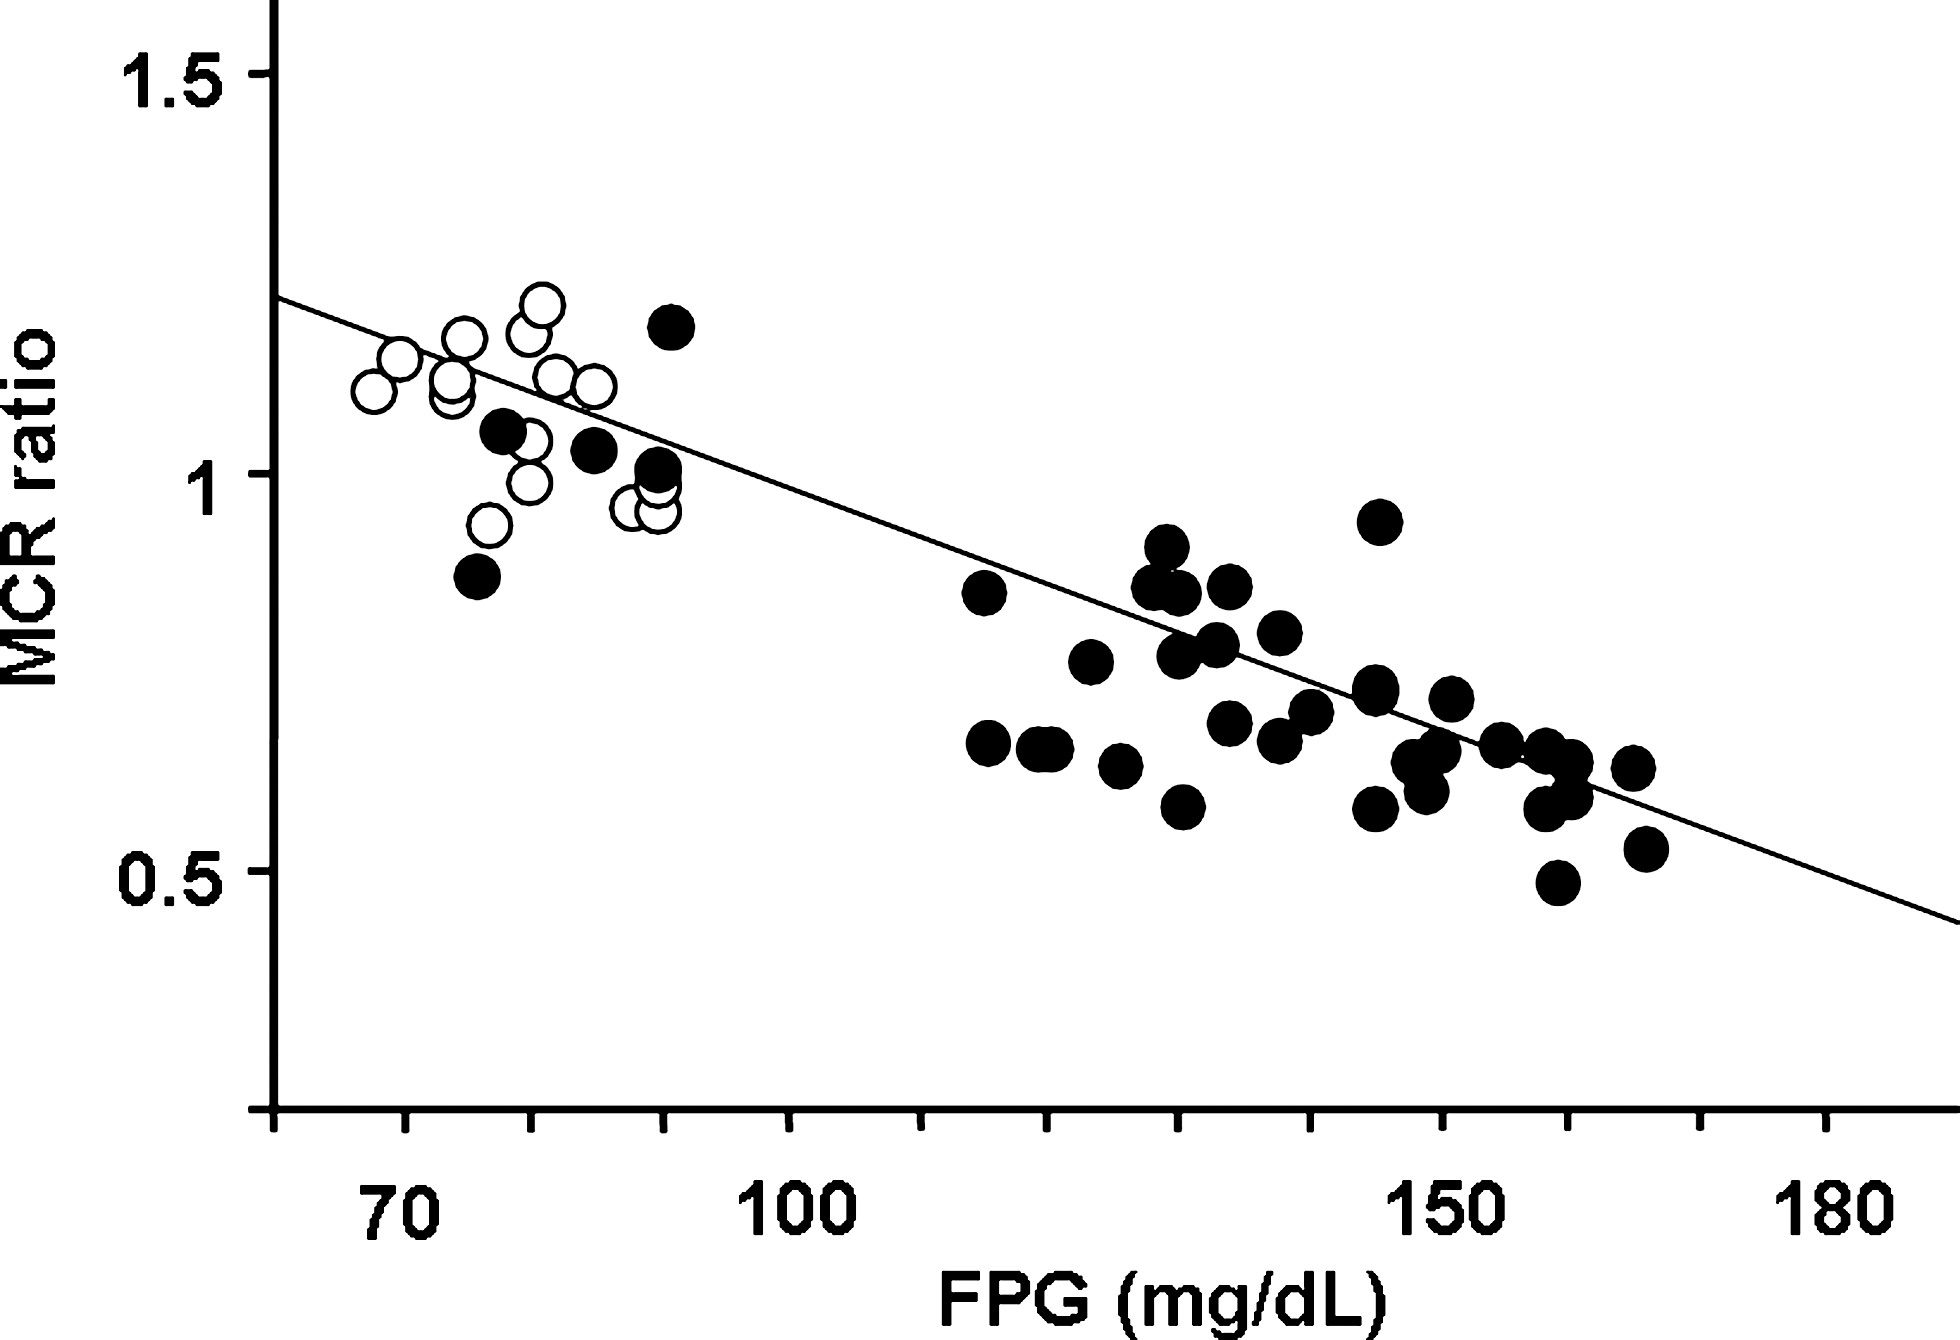
Metabolic clearance rate (MCR) ratio at isoglycemia to that at euglycemia as a function of fasting plasma glucose (FPG) levels in healthy subjects (open circles) and type 2 diabetes patients (closed circles). Pearson's correlation coefficient was used for statistical analysis.
Correlation of GIR or MCR between euglycemia and isoglycemia
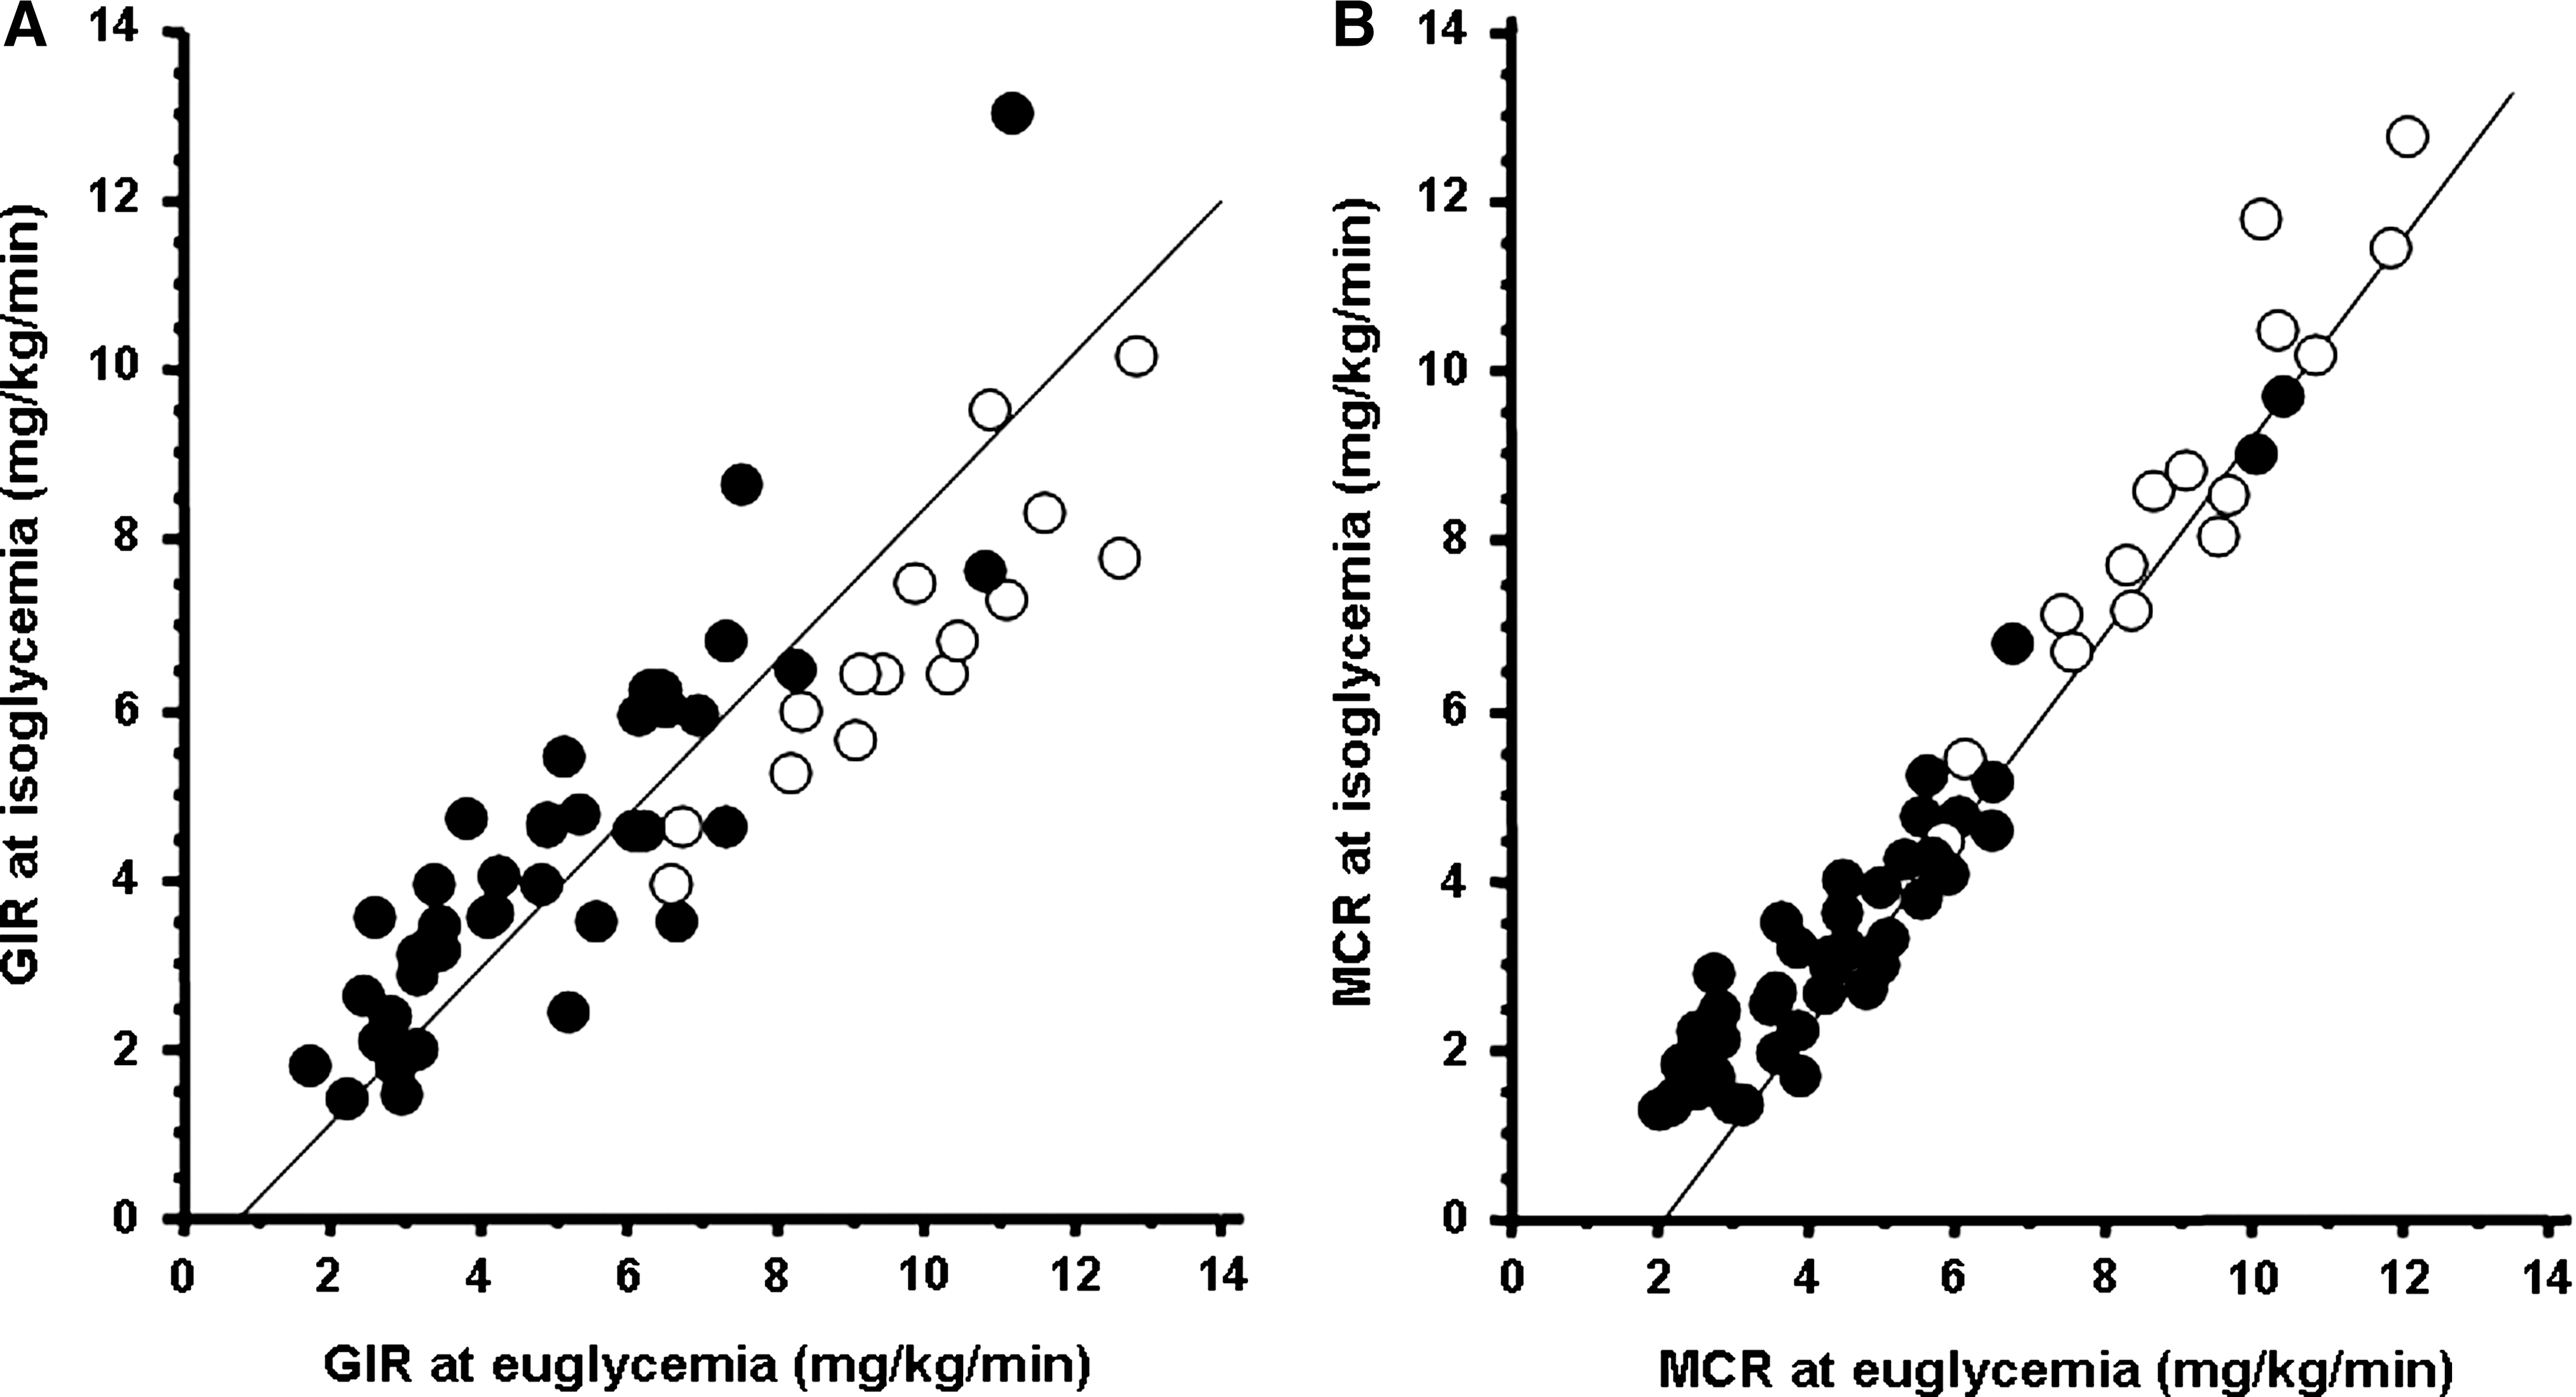
The robustness of GIR and MCR at isoglycemia was confirmed in comparison with those at euglycemia as a reference. As shown in Figure 3, MCR at isoglycemia exhibited a more favorable correlation to MCR at euglycemia (r=0.955) compared with the correlation in GIR between isoglycemia and euglycemia (r=0.876). This favorable correlation was further observed in either healthy subjects (r=0.961 in MCR and r=0.889 in GIR) or T2DM patients (r=0.923 in MCR and r=0.862 in GIR). It is thus possible that MCR at euglycemia is predictable by using MCR at isoglycemia according to the regression formula based on the regression line (Fig. 3B): MCR at euglycemia=1.742+(0.944×MCR at isoglycemia).
Relationships between (
Discussion
Major findings in the present study are as follows. First, GIRs at both clamped PG levels did not show any particular relationship with each other. Second, MCR was a less variable parameter compared with GIR regardless of the clamped PG levels. Finally, because MCR at two clamped PG values were excellently correlated with each other, MCR at euglycemia could be estimated by the value at isoglycemia.
So far, the hyperinsulinemic euglycemic GC technique 1 has been widely recognized as a gold standard to directly determine insulin sensitivity in vivo. It is predictable that GIR is largely influenced by clamped glucose concentration and that GIR increases in proportion to the increase of clamped PG level. 5 However, non–insulin-dependent tissues such as brain may not increase glucose uptake in proportion to the rise of ambient glucose concentration, 6 and it is plausible that glucose uptake may be saturated over some glucose concentration range, especially in non–insulin-dependent tissues. 7 Although some previous reports 4,13 demonstrated the linear increase of GIR in proportion to clamped PG levels, their clamped insulin levels were extremely low (0.2–0.5 mU/kg/min) compared with ours (1.25 mU/kg/min), and it is not thus logical to refer to their results. In contrast to the previous results, no linear increase of GIR was observed according to the increase of clamped PG levels without urine sugar excretion, suggesting glucose utilization may have been saturated over some glucose concentration range. However, further investigation is necessary to elucidate the precise mechanisms of the saturation of glucose uptake, especially in insulin-sensitive tissues.
MCR was rather stable and independent of clamped PG levels in both healthy subjects and T2DM patients. The MCR was gradually decreasing according to the increase of PG clamped levels, especially in T2DM patients. Because glucose uptake is a saturable system even in insulin-dependent tissue such as skeletal muscle, 14 with the possible idea that glucose transport is rate-limiting step for overall glucose disposal, 15 it is plausible that GIR does not correctly reflect whole-body insulin sensitivity, especially in diabetes patients with a reduced ability for glucose disposal at a higher PG level than euglycemia. Instead, it is plausible that glucose disposal decreases as a function of surrounding glucose concentration, probably because of glucose toxicity. 16 Our present result that the MCR decreased in parallel with the elevation of ambient PG level is quite in line with previous reports dealing with MCR in isogycemic clamp. 4,13 Taking into account the fact that euglycemia is not always the usual condition for diabetes patients, MCR in isoglycemia could be a rather physiologically acceptable marker instead of GIR in euglycemia. Further investigations including a direct measurement of glucose metabolism are necessary to elucidate this issue.
MCR between euglycemia and isoglycemia was less variable compared with GIR between the two PG levels in the present study. Furthermore, the correlation of MCR between those two clamped PG levels was much more excellent than that of GIR. These results prompted us to form an equation to predict MCR at euglycemia using the value of MCR at isoglycemia. Although euglycemia is a less physiological condition, especially in diabetes patients, as noted above, MCR (or GIR) obtained at euglycemia has still been considered and accepted as a gold standard of insulin sensitivity measurement. The estimation of MCR at euglycemia using the value at isoglycemia saves the labor and the time required to reach euglycemia. The validity of the equation is to be further elucidated in other cohorts of populations either with or without diabetes in future studies.
There are some limitations in the present study. For healthy subjects and some T2DM patients whose FPG was <100 mg/dL, the increment of glucose infusion was necessary to reach a steady state of GIR at the second-step euglycemic clamp. In that case, the influence of the insulin-independent component of glucose disposal (glucose effectiveness or mass effect) 17 could not be excluded completely. Furthermore, because insulin-sensitive healthy subjects required much glucose to maintain their blood glucose level, in contrast to insulin-resistant T2DM patients, there was again the possibility of mass effect mentioned above, especially at euglycemic clamp in healthy subjects. Even if we could not find any significant change of GIR and PG during the last 30 min of each clamp step, the possibility that prolonged hyperinsulinemia might increase GIR gradually 12 could not fully eliminated. In this context, overestimation of GIR might occur and affect the results of GIR and MCR, especially in the second clamp step at euglycemia. Nevertheless, the excellent correlations between MCR ratio and FPG and between MCR at both clamp steps demonstrate the robustness of MCR at various clamp PG levels. Because we did not use the isotopic method to measure hepatic glucose output in this study, the participation and the influence of hepatic glucose output on the GIR results could not be fully excluded. However, physiological hyperinsulinemia used in this study effectively suppress endogenous glucose production even under hyperglycemic circumstances such as a glucose concentration of 9–10 mM in healthy subjects 18 and 11–20 mM in T2DM patients. 19
In conclusion, MCR could be a more physiologically relevant parameter for insulin sensitivity than GIR, taking into account the possibility of reduced and saturated glucose disposal under the hyperglycemic state. Isoglycemic clamp is a more feasible and practically available method than euglycemic clamp, especially in T2DM patients whose FPG levels are modestly high, saving the labor and the time required to reach euglycemia. Because MCR was a less variable parameter than GIR at various PG levels and MCR at euglycemia can be estimated by the value at isoglycemia, it is plausible that MCR in an isoglycemic clamp study could be substituted for GIR in a euglycemic clamp study.
Footnotes
Author Disclosure Statement
No competing financial interests exist.