
Abstract
Background:
The present study was designed to define the relative contributions of glucose variability and ambient glycemia to the incidence of asymptomatic hypoglycemia in type 2 diabetes.
Methods:
Two hundred twenty-two persons with type 2 diabetes were divided into three groups: Group I (n = 53) on insulin sensitizers alone, Group II (n = 87) on oral hypoglycemic agents (OHAs) to include at least one insulin secretagogue, and Group III (n = 82) on insulin alone or in combination with OHAs. Ambient mean glucose concentration (MG) values (in mmol/L) and glycemic variability (SD around the mean glucose value) (in mmol/L) or mean amplitude of glycemic excursions (in mmol/L) were assessed by a continuous glucose monitoring system. Asymptomatic hypoglycemia was recorded over a 48-h period. Poisson regression analysis was used for assessing the potential predictors of hypoglycaemia.
Results:
The best model fit was obtained with the two following explanatory variables: MG and SD. Hypoglycemia frequency was negatively associated with MG and positively with SD: Log (number of hypoglycemia episodes) = 1.37 − (0.72 × MG) + (1.33 × SD). Odds ratios (95% confidence interval) for hypoglycemic risk were significantly different from 1 for MG at 0.96 (0.95–0.97) (P < 0.0001) and for SD at 1.08 (1.06–1.10) (P < 0.0001). In addition, the risk for hypoglycemia was completely or virtually eliminated when the SD was <1.7 mmol/L irrespective of the ambient glucose level and treatment modality.
Conclusions:
As the risk of asymptomatic hypoglycemia increases in the presence of increased glucose variability, avoidance of excess glucose fluctuations should be an important consideration for either reducing or preventing the risk of hypoglycemia in type 2 diabetes.
Introduction
In order to gain further insight into this issue, the continuous glucose monitoring system (CGMS®, Minimed, Northridge, CA) was used first to detect asymptomatic hypoglycemic episodes and second to obtain an accurate assessment of both glucose variability and mean of the daily glucose levels in a cohort of subjects with type 2 diabetes.
Research Design and Methods
Subjects with type 2 diabetes mellitus
Two hundred eighty-eight individuals with type 2 diabetes were recruited, and all were investigated at the outpatient clinic of the University Hospital in Montpellier, France, from 2003 to 2010. All were subjected to continuous glucose ambulatory monitoring (CGMS, Minimed) after training for use of the device. Eligibility was not based on hemoglobin A1c (HbA1c), age, sex, or diabetes complications but was restricted to those who had been on a stable therapeutic regimen with oral hypoglycemic agents (OHAs) and/or insulin for at least 3 months. Exclusion criteria from the final analysis were unexpected interruption in the glucose monitoring or insufficient number of blood glucose tests for calibration of the CGMS (four tests were required daily for this purpose). Unacceptable calibration meant an accuracy criterion with a correlation coefficient of <0.79. The analysis was deliberately limited to asymptomatic hypoglycemia, and therefore all patients who reported at least one clinical hypoglycemic event over the test period of monitoring were excluded. This limitation was introduced as excessive corrections of symptomatic hypoglycemic episodes can cause rebound hyperglycemic surges during the recovery period and can contribute to glycemic variability.
Of the 288 patients who underwent screening, 222 persons were entered into the study and assigned to the final analysis by the CGMS. The 222 persons with diabetes included for CGMS analysis were divided into three groups according to their current antidiabetes therapy: Group I (n = 53) was treated with insulin sensitizers only (metformin alone or in combination with thiazolidinediones); Group II (n = 87) was treated with OHAs including at least one insulin secretagogue (sulfonylurea or glinide); 8 and Group III (n = 82) was treated with insulin alone or in combination with OHAs. Groups of patients, treatment modalities, and insulin doses are detailed in Table 1. Basal insulin regimens were provided as a once-daily injection (before the evening meal in the majority) of insulin glargine. Basal–bolus insulin regimens consisted of either a once- or twice-daily injection of insulin glargine that was combined with premeal boluses of rapid-acting insulin analogs given once, twice, or three times daily as required.
Group I, type 2 diabetes patients treated with insulin sensitizers alone; Group II, type 2 diabetes patients treated with oral hypoglycemic agents (OHAs) including at least one insulin secretagogue; and Group III, type 2 diabetes patients treated with insulin in addition to (n = 57) or not with (n = 25) OHAs.
Analysis of variance, χ 2, or Kruskal–Wallis test as appropriate.
BMI, body mass index; MAGE, mean amplitude of glucose excursions; NS, not significant.
The study was observational in design. All the investigations were performed in routine diabetes outpatient clinics, and each subject gave informed consent. In accordance with French law in Article L-1121-1 of the Code for Public Health concerning the conductance of Biomedical Research, 11 the study design as developed did not require an approval from the French Committee of Protection of Persons (research ethics committee).
Study protocol
Subcutaneous interstitial glucose was monitored on an ambulatory basis over a period of 3 consecutive days by using the second-generation Minimed continuous glucose monitoring system (CGMS). 12,13 The sensor was inserted on day 0 and removed midmorning on day 3. Calculations of both glucose variability and mean glucose concentration (MG) values were derived from data obtained over a 48-h period during days 1 and 2 in order to avoid bias due to both insertion and removal of the sensor.
HbA1c was measured using a high-performance liquid chromatography assay (Menarini Diagnostics, Florence, Italy) and was Diabetes Control and Complications Trial–aligned.
Identification of asymptomatic hypoglycemic events
In 2005, the American Diabetes Association Workshop on Hypoglycemia 14 defined hypoglycemia in diabetes as a plasma glucose concentration of ≤70 mg/dL (3.9 mmol/L). This definition is still used according to the “Standards of Medical Care in Diabetes,” which were published in the last supplement of Diabetes Care in January 2011. 15 This threshold is regarded as the lower limit below which glucagon and epinephrine secretions increase in response to the low glucose level. 16 As it has been demonstrated by Monsod et al. 17 that CGMS sensor readings remain 20% lower than venous plasma glucose concentrations during mild hypoglycemia, we considered that a plasma glucose concentration of 3.9 mmol/L in venous plasma samples corresponds to a subcutaneous value of 3.1 mmol/L (56 mg/dL) in the interstitial fluid. Therefore, hypoglycemia in our study was defined as an interstitial glucose concentration of ≤3.1 mmol/L based on three consecutive 5-min recording time points during the CGMS. By using this definition, the average nadir of subcutaneous glucose value and duration of asymptomatic hypoglycemia were 2.5 ± 0.3 mmol/L (45.3 ± 4.7 mg/dL) (mean ± SD) and 89 ± 14 min (mean ± SD), respectively. Considering the mean glucose nadir, its value was slightly higher than that corresponding to the lower limit (2.2 mmol/L, 40 mg/dL) of detection range for interstitial glucose measurement with CGMS in routine clinical use. For that reason, the threshold used (3.1 mmol/L, 56 mg/dL) appears to be a compromise between the technical limitations of the CGMS and the clinical definition of hypoglycemia given by the American Diabetes Association. 14
Evaluation of glycemic variability
Within-day glycemic variability was described using two parameters: mean amplitude of glycemic excursions (MAGE) (in mmol/L) 18,19 and SD (in mmol/L) around the derived MG values obtained from 48-h time points (days 1 and 2).
Statistical analysis
Analysis of variance (followed by Bonferroni's test when needed) and the χ2 test were used for comparing the three groups of patients. Non-normally distributed measurements (number of hypoglycemic episodes/person/48-h period) were compared among the different groups using the Kruskal–Wallis test. Analysis of covariance was used to investigate the possible effect of types of treatment on glycemic variability, and adjustments were made based on the mean 48-h glucose concentration and known duration of diabetes. Comparisons were considered significant when two-sided P values were <0.05. Candidate predictor variables that were associated with the risk of asymptomatic hypoglycemia in univariate analysis (Poisson regression) were included as potential covariates in a multiple regression model. Two models were compared by using the Akaike's information criterion, which is an assessment of the goodness of fit of an estimated statistical model. Analysis was performed with the STATVIEW statistical package, version 5 for Macintosh (SAS Institute Inc., Cary, NC) and with the R package, version 2.7.0 (© 2008 The R Foundation for Statistical Computing [
Results
Clinical and laboratory data are included in Table 1. Results are presented as mean (±SD) values.
Comparison of glycemic variability and frequency of asymptomatic hypoglycemia in the three groups of people with type 2 diabetes mellitus (Table 1)
The different parameters used for evaluating glycemic variability (i.e., the SD around the mean glucose value and the MAGE) were compared among the three groups of patients.
A progressive increase in glycemic variability, using both methods, was observed from Group I to Group III. Differences among Groups I, II, and III were significant (P < 0.0001) for the two parameters even after adjustment for known duration of diabetes and 48-h MGs. With the Bonferroni correction, the SD and the MAGE in each group of subjects differed from the other two groups taken separately (i.e., Group I vs. Group II, P < 0.0001 for SD and P = 0.0021 for MAGE; Groups I and II vs. Group III, P < 0.0001 for both SD and MAGE). The frequency of asymptomatic hypoglycemic episodes was not significantly different among the three groups (Kruskal–Wallis test).
Assessment of the potential predictor variables for the risk of asymptomatic hypoglycemia
Univariate analysis
Results for each clinical and laboratory potential predictor variable of asymptomatic hypoglycemia are included in Table 2. Among the independent variables, the 48-h MG, the SD around the mean glucose value, and the MAGE were all significant (P value) predictors of asymptomatic hypoglycemia, whereas the other variables (i.e., age, sex, known duration of diabetes, HbA1c, and categories of treatment) were not.
Treatment was coded as binary predictor variable according to whether patients received an insulin sensitizer(s) alone (Group I) or not (Groups II + III).
CI, confidence interval; HbA1c, hemoglobin A1c; MAGE, mean amplitude of glucose excursions; OR, odds ratio.
Multivariate analysis
The best fit of the statistical model was observed when the MG and the SD around the MG value were introduced simultaneously in the model as independent variables: Akaike's information criterion = 201, versus 229 for the model including both MG and MAGE. The corresponding equation for predicting the number of hypoglycemic events/person/48-h period was Log (number of hypoglycemic events) = 1.37 − (0.72 × mean 48-h concentration) + (1.33 × SD). As indicated by the standardized regression coefficients, the risk of asymptomatic hypoglycemia increased with increasing glycemic variability and decreased with increasing MG values over the 48-h test period. This result was in agreement with the odds ratios that were found significantly higher than 1 (1.08, 95% confidence interval = 1.06–1.10) for glycemic variability and lower than 1 (0.96, 95% confidence interval = 0.95–0.97) for MG values (Table 3). Figure 1 illustrates the frequency of asymptomatic hypoglycemic events as a function of tertiles of both the mean 48-h glucose concentration and glycemic variability. Whereas the lower MG values increased the risk for hypoglycemia, the greatest independent risk was observed in the highest tertile of glycemic variability. In addition, it was noted that the risk for asymptomatic hypoglycemia was minimal when the SD around the mean glucose value was maintained below 1.7 mmol/L whatever the level of mean glucose value.
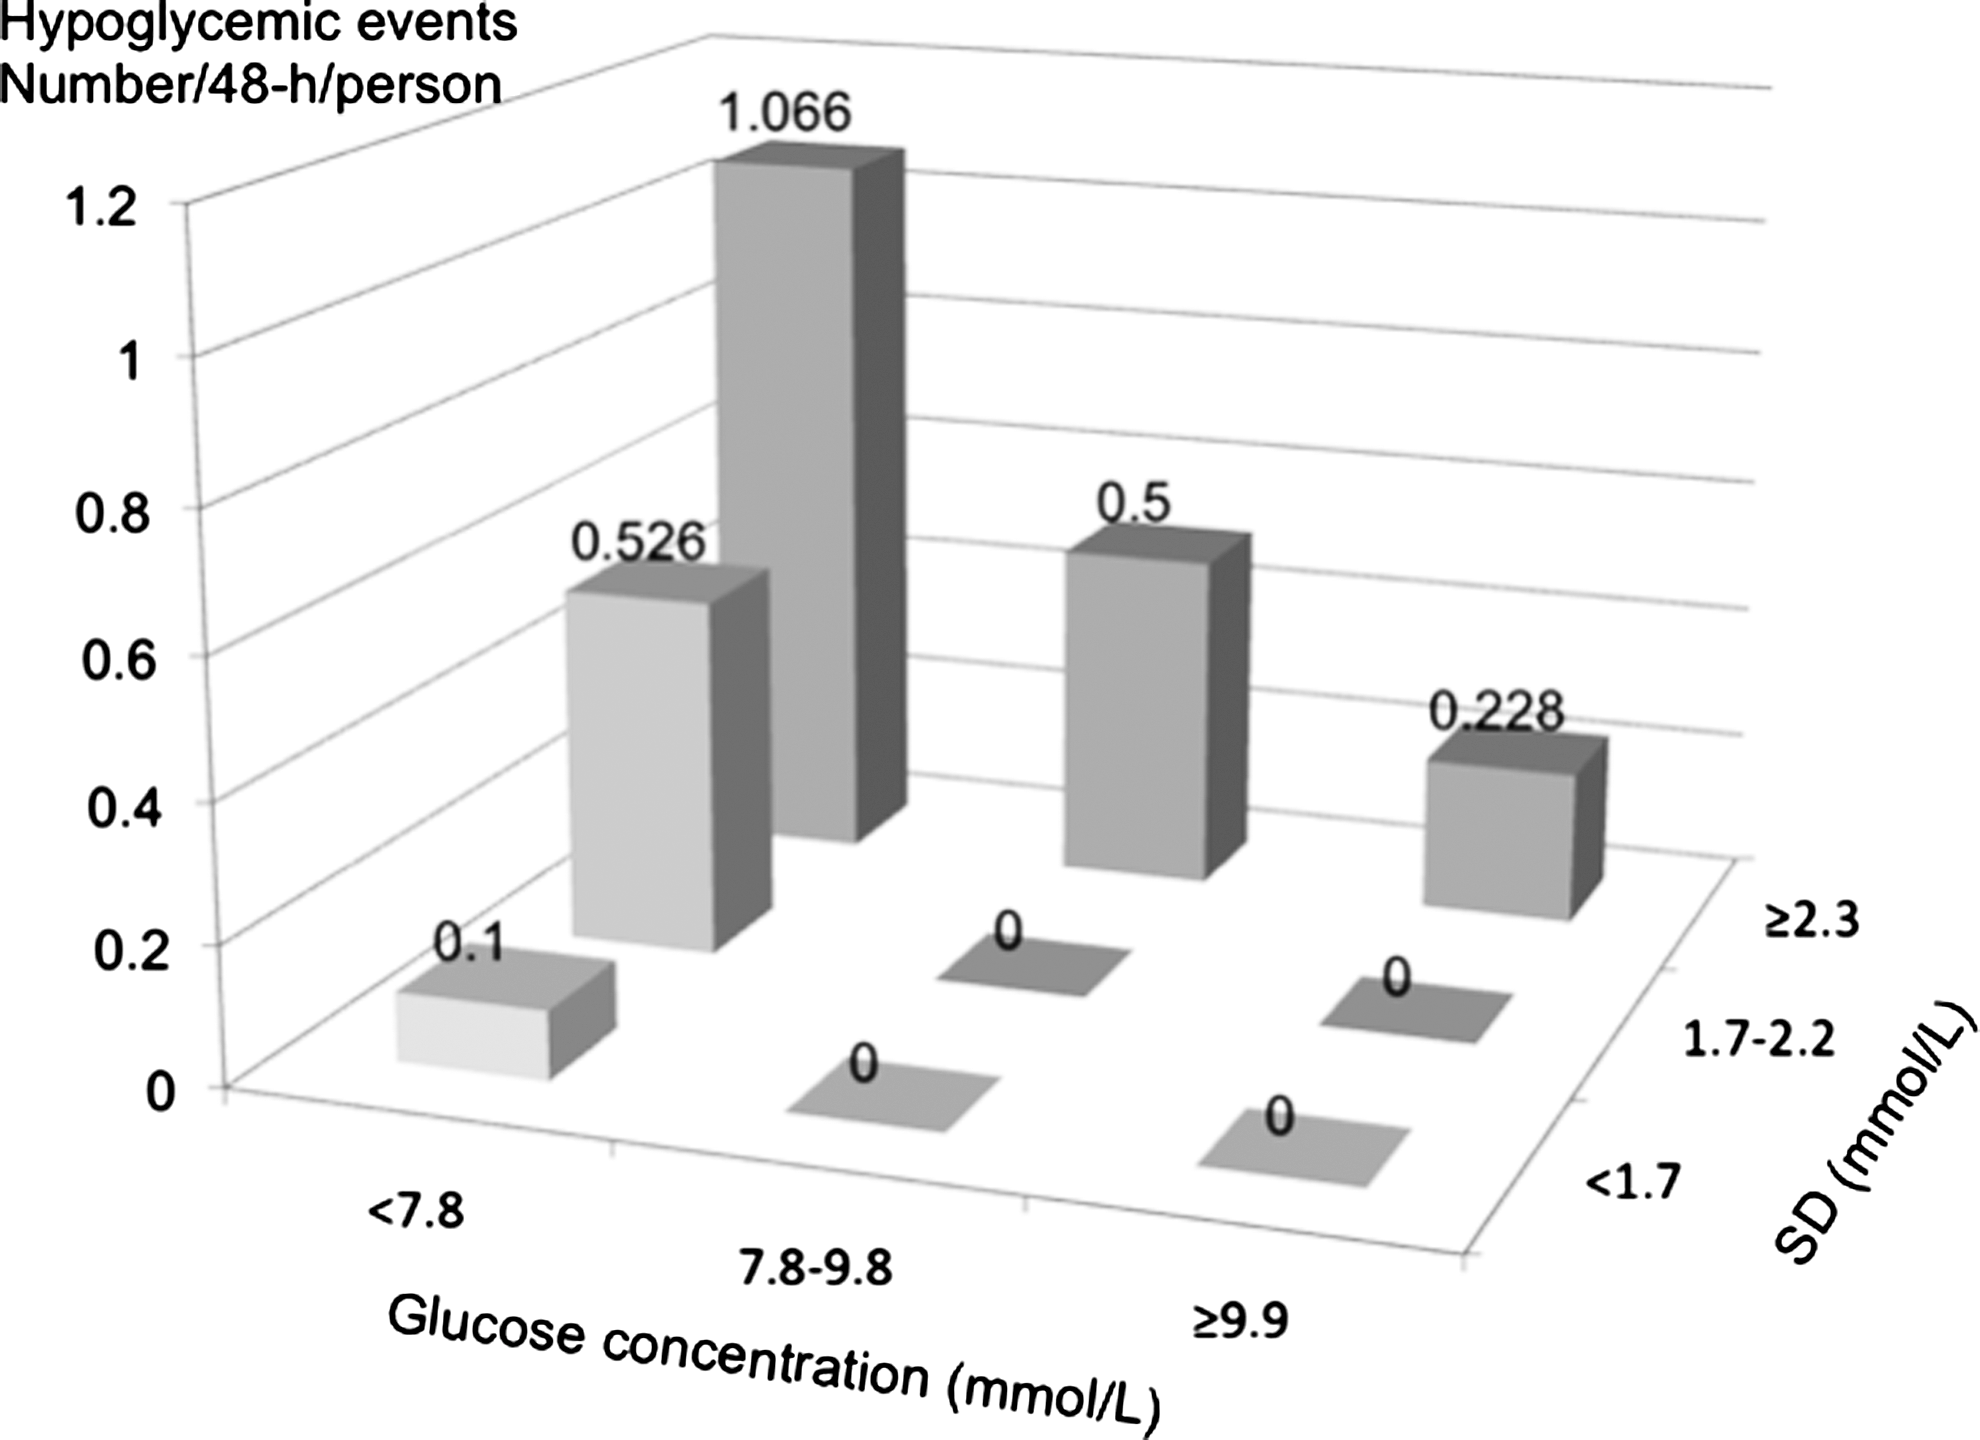
Number of hypoglycemic events as a function of tertiles of 48-h mean glucose concentration and tertiles of glycemic variability (SD around the mean glucose concentration).
AIC, Akaike's information criterion; CI, confidence interval; MAGE, mean amplitude of glucose excursions; OR, odds ratio.
The frequency of asymptomatic hypoglycemic events as a function of both HbA1c and glycemic variability is shown in Figure 2. The risk of hypoglycemia increases steadily with decreasing levels of HbA1c in the two lowest tertiles of glycemic variability, but not in the highest. The latter finding explains why HbA1c does not appear as an independent predictor of asymptomatic hypoglycemia in the univariate analysis.
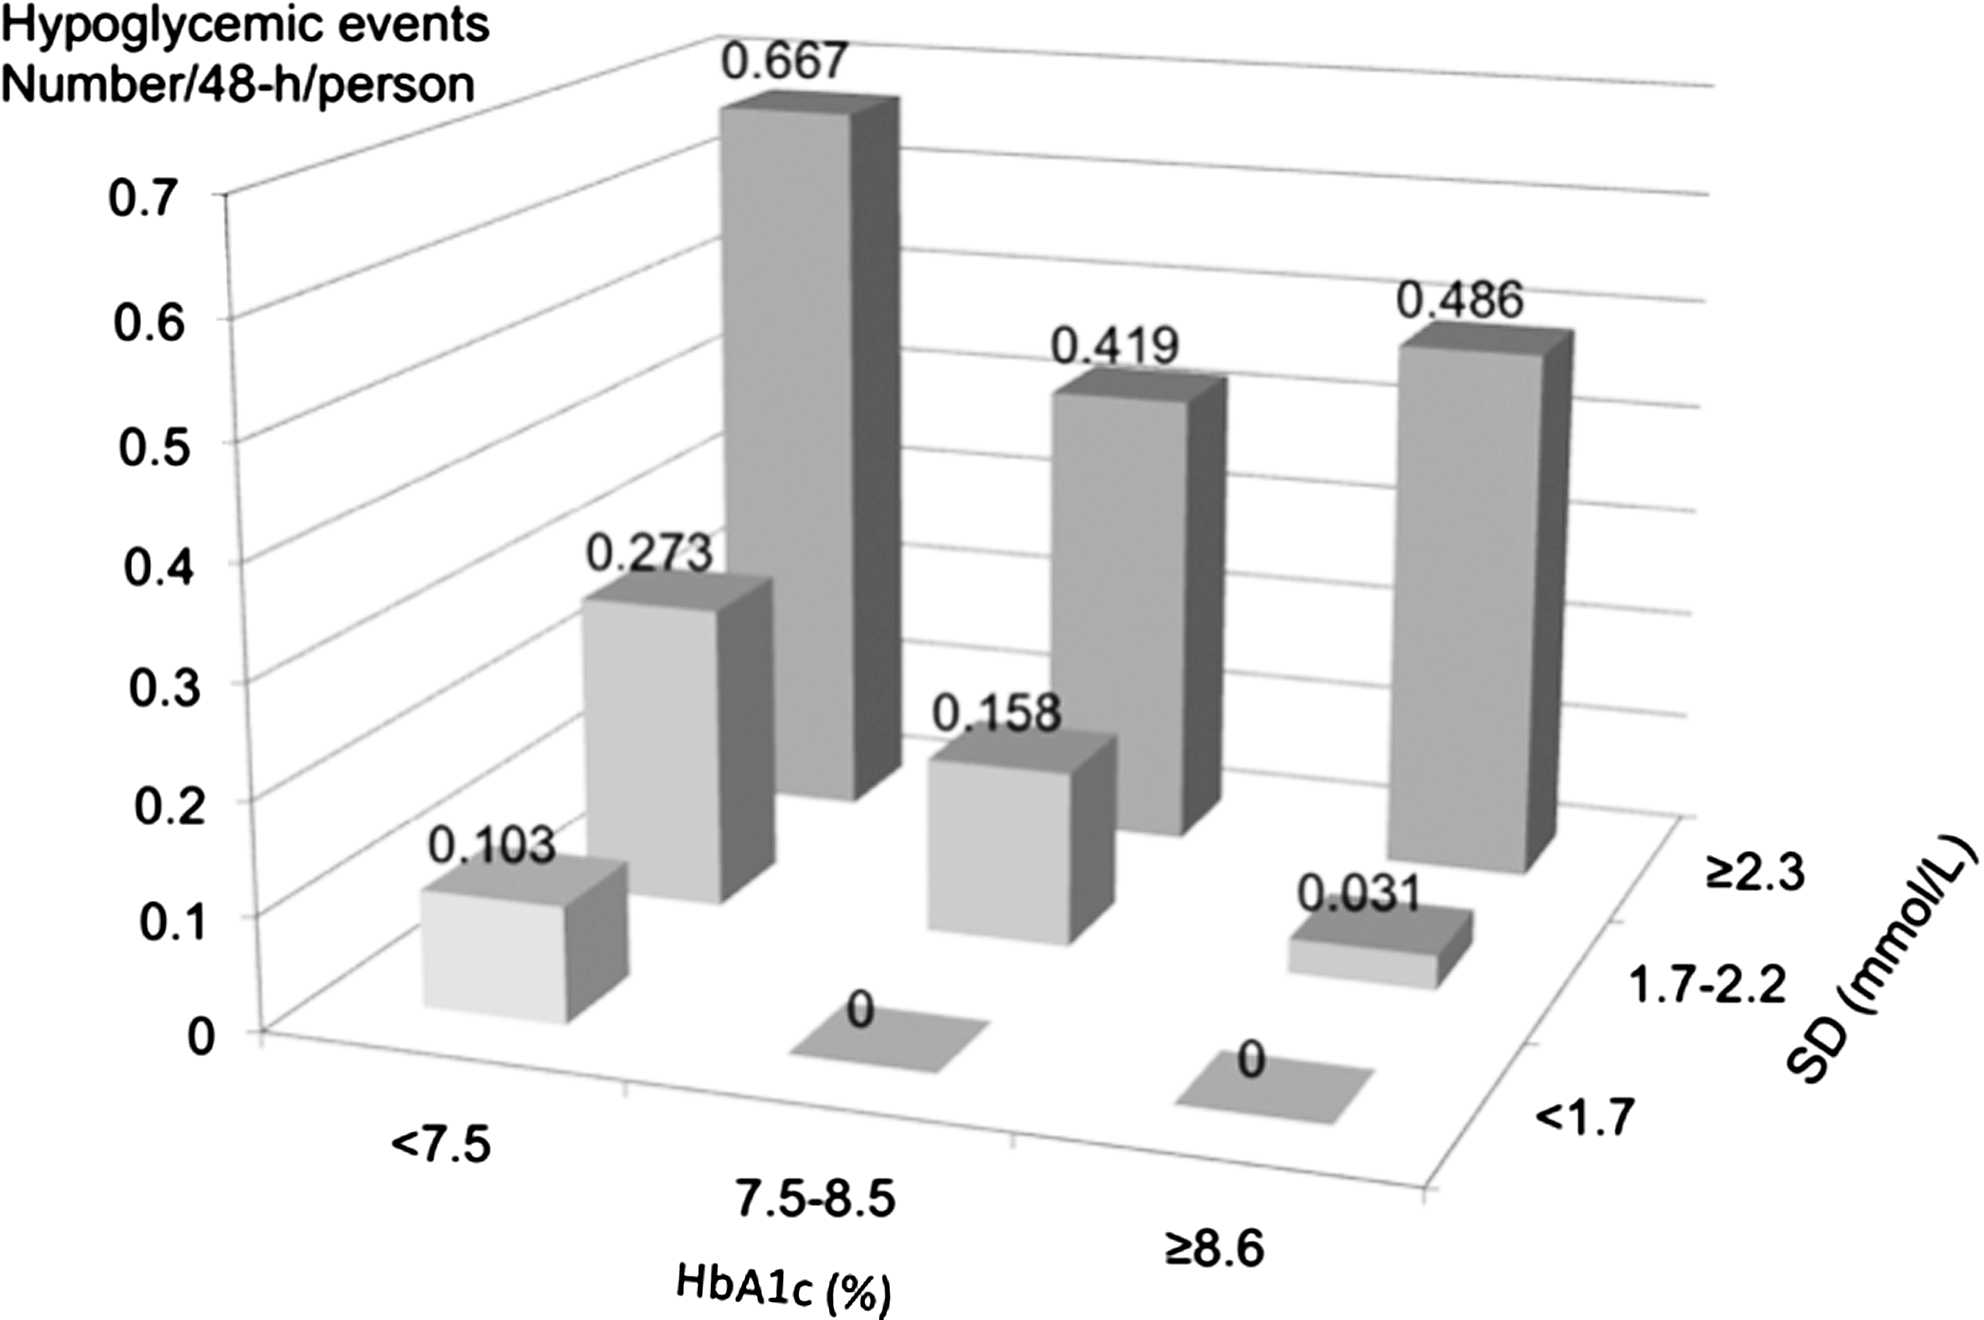
Number of hypoglycemic events as a function of tertiles of hemoglobin A1c (HbA1c) and tertiles of glycemic variability (SD around the mean glucose concentration).
Relationship between HbA1c and either MG or glycemic variability
In the population considered as a whole, a significant correlation is observed between HbA1c (%) and 48-h MG values (in mmol/L): r = 0.626, P < 0.001. The significance of the correlation is lower between HbA1c (%) and the SD around the mean glucose value (in mmol/L): r = 0.291, P < 0.001.
Discussion
The results from this study indicate first that glycemic variability in type 2 diabetes differs along with categories of antidiabetes treatment. These results were observed after adjustments for the known duration of diabetes and the degree of total glucose exposure represented by the 48-h MG. Both SD around the mean glucose value and MAGE increased according to the following ordinal scale: treatment with insulin sensitizers alone < treatment with different combinations of OHAs including at least one secretagogue < treatment with insulin with or without OHAs. Second, the incidence of asymptomatic hypoglycemia was negatively associated with the 48-h MG, whereas the frequency of such events exhibited a positive association with glucose variability. From a clinical point of view and according to the data presented in Figure 1, it appears that lowering glycemic variability below a threshold of 1.7 mmol/L (SD around the mean glucose value) virtually eliminated the risk of asymptomatic hypoglycemic events.
Taken all together, these results are in agreement with those found by other investigators who have used somewhat different protocols. 7,10,20 By using a continuous glucose monitoring device in persons with type 1 and type 2 diabetes, the UK Hypoglycemia Study Group has been able to demonstrate that the risk of hypoglycemia depends on both treatment modalities and duration of treatment. 7 However, the markers of glycemic variability (SD around the mean glucose value or MAGE) and ambient glycemia (48-h glucose concentration) were not estimated.
In our study these parameters were assessed and show that a discrepancy exists between glucose variability and the frequency of hypoglycemia across the different groups. Glucose variability was seen to increase from Group I to III, whereas the latter remains essentially stable across the three groups. These differences suggest that besides glycemic variability, other glycemic disorders such as the overall/ambient glycemic status are also implicated as risk factors for asymptomatic hypoglycemic events. 10 The validity of this hypothesis is supported by the fact that MG was found to be a significant predictor variable for the risk of hypoglycemia in parallel with glycemic variability. Our data clearly indicate that asymptomatic hypoglycemia is more likely when the mean blood glucose is lower and the glucose variability is greater. Therefore an increased ambient hyperglycemia can neutralize the effect of a greater glycemic variability, thus explaining why in the present study no significant differences were observed with regard to the rate of hypoglycemia despite differences in both HbA1c and MG values among the three groups.
From a general point of view, treatment strategies should therefore be designed to avoid both persistent hyperglycemia and excessive glucose variability. Lowering MG values to satisfactory levels, while attempting to obtain HbA1c levels as close as possible to the recommended targets, 21 can usually be achieved by using different therapeutic strategies. However, the progression of glucose variability across the three groups of type 2 diabetes subjects suggests that the intensification of therapeutic strategies results in increased glucose variability. Even though glycemic fluctuations were not measured in the ACCORD study, 2 it is not unreasonable to conclude that excessive intensification of treatment is to a large extent responsible for the increased frequency of hypoglycemic episodes and possibly the increased cardiovascular and all-cause mortality, but the evidence for causality remains to be demonstrated. 22,23
Two other studies 10,20 have also confirmed that hypoglycemia was more frequently seen when glucose values were low. In the Diabetes Outcomes in Veterans Study (DOVES) 10 the frequency of hypoglycemic episodes was revealed by using a daily four-point glucose profile obtained by self-monitoring blood glucose over a period of 8 weeks capturing all values below <3.33 mmol/L. By analyzing the data sets of the Diabetes Control and Complications Trial, Kilpatrick et al. 20 found that HbA1c, mean blood glucose, and SD around the mean glucose value of a seven-point glycemic profile had an independent role in predicting an individual's risk of hypoglycemia in type 1 diabetes.
Our study differs from the two aforementioned trials by the fact that we used a continuous glucose monitoring system over a 48-h period to identifying all asymptomatic episodes with an interstitial glucose level <3.10 mmol/L (corresponding to venous plasma glucose values of <3.90 mmol/L [∼70 mg/dL]). 15 In our study we failed to find a relationship between HbA1c level and the risk for hypoglycemic episodes. The apparent discrepancy between our results and those of Kilpatrick et al. 20 on this latter point can simply be due to the fact that the analysis by the previous investigators integrated periods of several months, whereas our calculations were made on 48-h data, a time interval that is not concomitant with the 3-month periods that are usually represented by HbA1c measurements. 24
Despite these remarks and even though the methodologies were different, it is noteworthy that the results of the present study and those observed in the DOVES trial 10 and the analysis of Kilpatrick et al. 20 demonstrated that the degree of hyperglycemia as tested by either MG 10 or HbA1c levels 20 and more preferentially by both parameters 20 was negatively related to the frequency of hypoglycemia, whereas glucose variability was positively related to the occurrence of asymptomatic hypoglycemia.
However, for the moment the fact remains that it is not possible to know whether glucose variability is the chicken or the egg with regard to hypoglycemia. As we have limited our study to asymptomatic hypoglycemia with no glycemic rebound due to correction of hypoglycemia, it seems more likely that glycemic variability is the primary event (role of the egg). Although the debate remains wide open, it seems reasonable to think that glucose variability should be taken into account in the management of type 2 diabetes, especially when insulin or OHAs, including sulfonylureas, are involved and capable of causing iatrogenic hypoglycemia with potential serious short- and long-term consequences. 8 –10 The best strategy should therefore be to reduce both glycemic variations in parallel with lowering ambient glycemia. However, the problem appears to be more complex in practice than in theory, as suggested by the 3-year extension of the 4-T Study. 25 Nevertheless, our observations indicate that glucose variability (SD around the mean glucose value) should be maintained below a threshold of approximately 1.7 mmol/L throughout the therapeutic continuum of type 2 diabetes in order to either minimize or eradicate the risk of hypoglycemia in similar populations of patients with type 2 diabetes. Therefore, lowering the ambient glycemia without reducing glucose variability should be avoided as it places the individual at greater risk of hypoglycemia.
Footnotes
Acknowledgments
This study was supported by academic funds from the University of Montpellier (France). The authors wish to thank Dr. N. Molinari (University Institute of Clinical Research, Montpellier, France) for his invaluable help in the statistical analysis of the data.
Author Disclosure Statement
No competing financial interests exist.
This work was presented as an oral comunication at the 4th International Congress on Prediabetes and the Metabolic Syndrome held in Madrid on April 6–9, 2011.