
Abstract
Background:
Fast and reliable glycemic control is of tremendous importance in intensive care units. Point-of-care devices used in professional care have to be precise and of low variability, and their connectivity has to outrange the abilities of home-care equivalents. In particular, the meter's efficiency should be tested not only with spiked blood samples from healthy donors but also with blood from intensive care unit patients because of their special matrix conditions as low hematocrit, oxygen pressure variability, or medication.
Methods:
Four types of network-ready glucose meters were tested. Data, obtained from native or maltose/xylose-spiked intensive care patients' blood, were compared (oxygen, hematocrit, glucose, and maltose and xylose dependencies) with those from a YSI 2300 STAT Plus™ glucose and lactate analyzer (YSI Life Sciences, Yellow Springs, OH). According to ISO 15197 (2003) acceptance of glucose meter results was determined. Quality control results were investigated considering a new calculation type in German guidelines.
Results:
Three of the meters fulfill the overall acceptance criterions. Two of the meters achieved accuracies above 93% in all oxygen, hematocrit, and glucose subgroups. Maltose generates deviations leading to accuracies from 71.1% to 100%, and xylose causes accuracies of 33.3% to 100%.
Conclusions:
State of the art for manufacturing small network point-of-care testing glucose meters has reached a new level of precision, but the devices still have to be handled with care, and in particular the staff of an intensive care unit still needs knowledge about possible interferences.
Introduction
Usually publications comparing POCT devices deal with blood gathered from donors without acute and severe illness 15,16 and sometimes with interference-prone blood from intensive care unit (ICU) patients. 10,17 –20 ICU patients often undergo mechanical ventilation and intravenous volume therapy, so that especially matrix variations relative to different oxygen partial pressures and Hct are particular interesting.
Furthermore, maltose as the main metabolite of enzymatic cleavage of glucose polymers originating, for example, from peritoneal dialysis has proven to mimic glucose concentrations in blood when being measured by an inadequate device. 21 Xylose might mimic glucose when used in the xylose absorption test and is therefore also tested.
Preconditioning of the specimens (e.g., with different heparins) and time delay between measurements at the point of care and the central laboratory of at least half an hour have to be taken into account when discussing POCT or central laboratory glucose results. To cover advantages of matrix effects, 22 –24 interfering side aspects, and time delay, we compared the capabilities of actual professional care devices in an ICU setting referencing to an “accepted laboratory method” (YSI 2300 STAT Plus™ glucose and lactate analyzer, YSI Life Sciences, Yellow Springs, OH). 25
Additionally, novel national guidelines 26 suggest that clinics introduce a central data management of POCT systems in terms of quality control (QC) and patients' electronic health records. For this reason we focused the investigation on network-compatible glucose meters.
Materials and Methods
Sample testing
A total of 105 specimens were taken from ICU patients for comparison on four different types of professional care glucose meters/test strip systems—Precision Xceed Pro™/Precision PCx® from Abbott Laboratories (Chicago, IL), SureStep® Flexx®/SureStep Pro® from LifeScan (Milpitas, CA), StatStrip™/StatStrip from Nova Biomedical (Waltham, MA), and Accu-Chek® Inform II/Accu-Chek Performa (marked with a green symbol on the test strip box) from Roche Professional Diagnostics (Rotkreuz, Switzerland)—and the reference YSI 2300 analyzer directly after their routine use for patient monitoring with a Siemens Rapidlab 865 (Siemens Healthcare Diagnostics GmbH, Eschborn, Germany). One sample set of heparinized whole blood was analyzed on all glucose meters. Per type of examined test strip glucose meters, two devices were used, so that in conclusion nine measurements (including the reference messurement of the YSI 2300) per one sample were analyzed. Homogeneity of the tested material was approved by preanalytical treatment according to the “rolling procedure” 27 and the use of blood gas syringes equipped with liquid heparin (Monovette, Sarstedt, Germany) (final activity at least 50 IU/mL) for anticoagulation. A total sample volume of about 2 mL was withdrawn for routine blood gas analysis from the patients using an intravenous or intra-arterial line with previous discarding of 2 mL of blood. In a routine manner, blood remaining in the syringe after blood gas analysis is discarded (“waste blood”); this “waste blood” is used in the present study for comparison of glucose meters. Every specimen was tested immediately one after the other with the YSI 2300 analyzer and the handheld glucose meters. All data are presented as mean of results of two devices of one type. Time delay between the series was less than 5 min.
All measurements were done by trained laboratory staff at the general ICU of the Departments of Anesthesiology and General Surgery of the University of Regensburg, Regensburg, Germany, in accordance with the local ethics committee (application for admission decided positive, number 09/48 04/22/2009 approval by PD. Dr. H. Helbig). For consideration of oxygen, Hct, and glucose influences, the total number (169–173) of measurements per glucose meter type was divided in four almost equivalent portions from low to high oxygen/Hct/glucose content, measured with the Rapidlab 865 and the YSI 2300 analyzer, respectively.
None of the prospectively included 41 patients (of a surgical ICU) whose samples were analyzed had medications leading to elevated levels of maltose or xylose (e.g., by peritoneal dialysis or xylose absorption tests). Therefore 14 of the 105 samples were spiked outside of the body with maltose [
Reference glucose measurement
The YSI 2300, an accepted laboratory analyzer, using the glucose oxidase reaction, was used as reference, which is not affected by partial pressure of oxygen, Hct, xylose, or maltose. 9,25,28 –31 Results of blood glucose measurements are dependent on their calibration reference. Usually blood glucose meters are calibrated versus plasma. The YSI 2300 instrument is calibrated versus a defined plasma volume. When whole blood is analyzed on the YSI instrument, a mathematical conversion has to be done to obtain the plasma-related glucose concentration. To generate comparable results to the handheld glucose meters, data from the YSI 2300 analyzer were converted to plasma values according to International Federation of Clinical Chemistry and Laboratory Medicine recommendations. 32
The performance of the YSI 2300 analyzer was tested semi-daily, with QC material provided by YSI Life Sciences.
Performance of the evaluated glucose meters
Performance of glucose meters is termed acceptable [according to ISO 15197 (2003) when the percentage of individual results falling outside 0.83 mmol/L (15 mg/dL) at reference glucose concentrations of <4.17 mmol/L (75 mg/dL) and outside 20% at reference glucose concentrations of ≥4.17 mmol/L (75 mg/dL) is not higher than 5% (accuracy 33,34 ).
QC
To ensure proper actual conditions of all glucose meters a daily controlling of quality was done in the morning before starting the patients' specimen sampling and again in the afternoon. On 5 of 6 working days an additionally series of QC measurements was performed additionally after half of the samples were tested. According to German guidelines for laboratory instruments,
26
the feasible relative deviation of a single value, represented by the relative square mean (Δ/x
0) of 11.0% in relation to the target value of the test solutions, was to achieve
and also
where Δ is the root mean square of deviation (RMSD), n is the number of QC samples, xi is the result of one sample, x 0 is the vendor-given target value, s is the SD, and δ is the systematic deviation.
Calculations
QC calculations were executed with Microsoft Office Excel 2003 Professional Edition (Microsoft Corp., Redmond, WA). All other statistical calculations were done with the PASW Statistics package (version 18.0.0, IBM Corp., Armonk, NY). Boxplots given in the figures include informations about median, 25th and 75th percentiles, minimum and maximum of the observed but not outlying values, outliers, and extreme values.
Results
This section is structured in two parts. The first part deals with results from the patients' specimens, including an overall reflection and variable determinants such as medication, oxygen, Hct, glucose, maltose, xylose, and single device results. The second part comprises the QC results according to new German guidelines.
Patients' samples
The overall accuracy (ISO 15197), without consideration of content of oxygen, Hct, glucose, maltose, xylose, and other medications, ranged from 65.1% to 99.4%. The median absolute differences between devices and reference are plotted in Figure 1, showing a positive bias for SureStep and Xceed Pro and an extended range between minimum and maximum value for Xceed Pro.
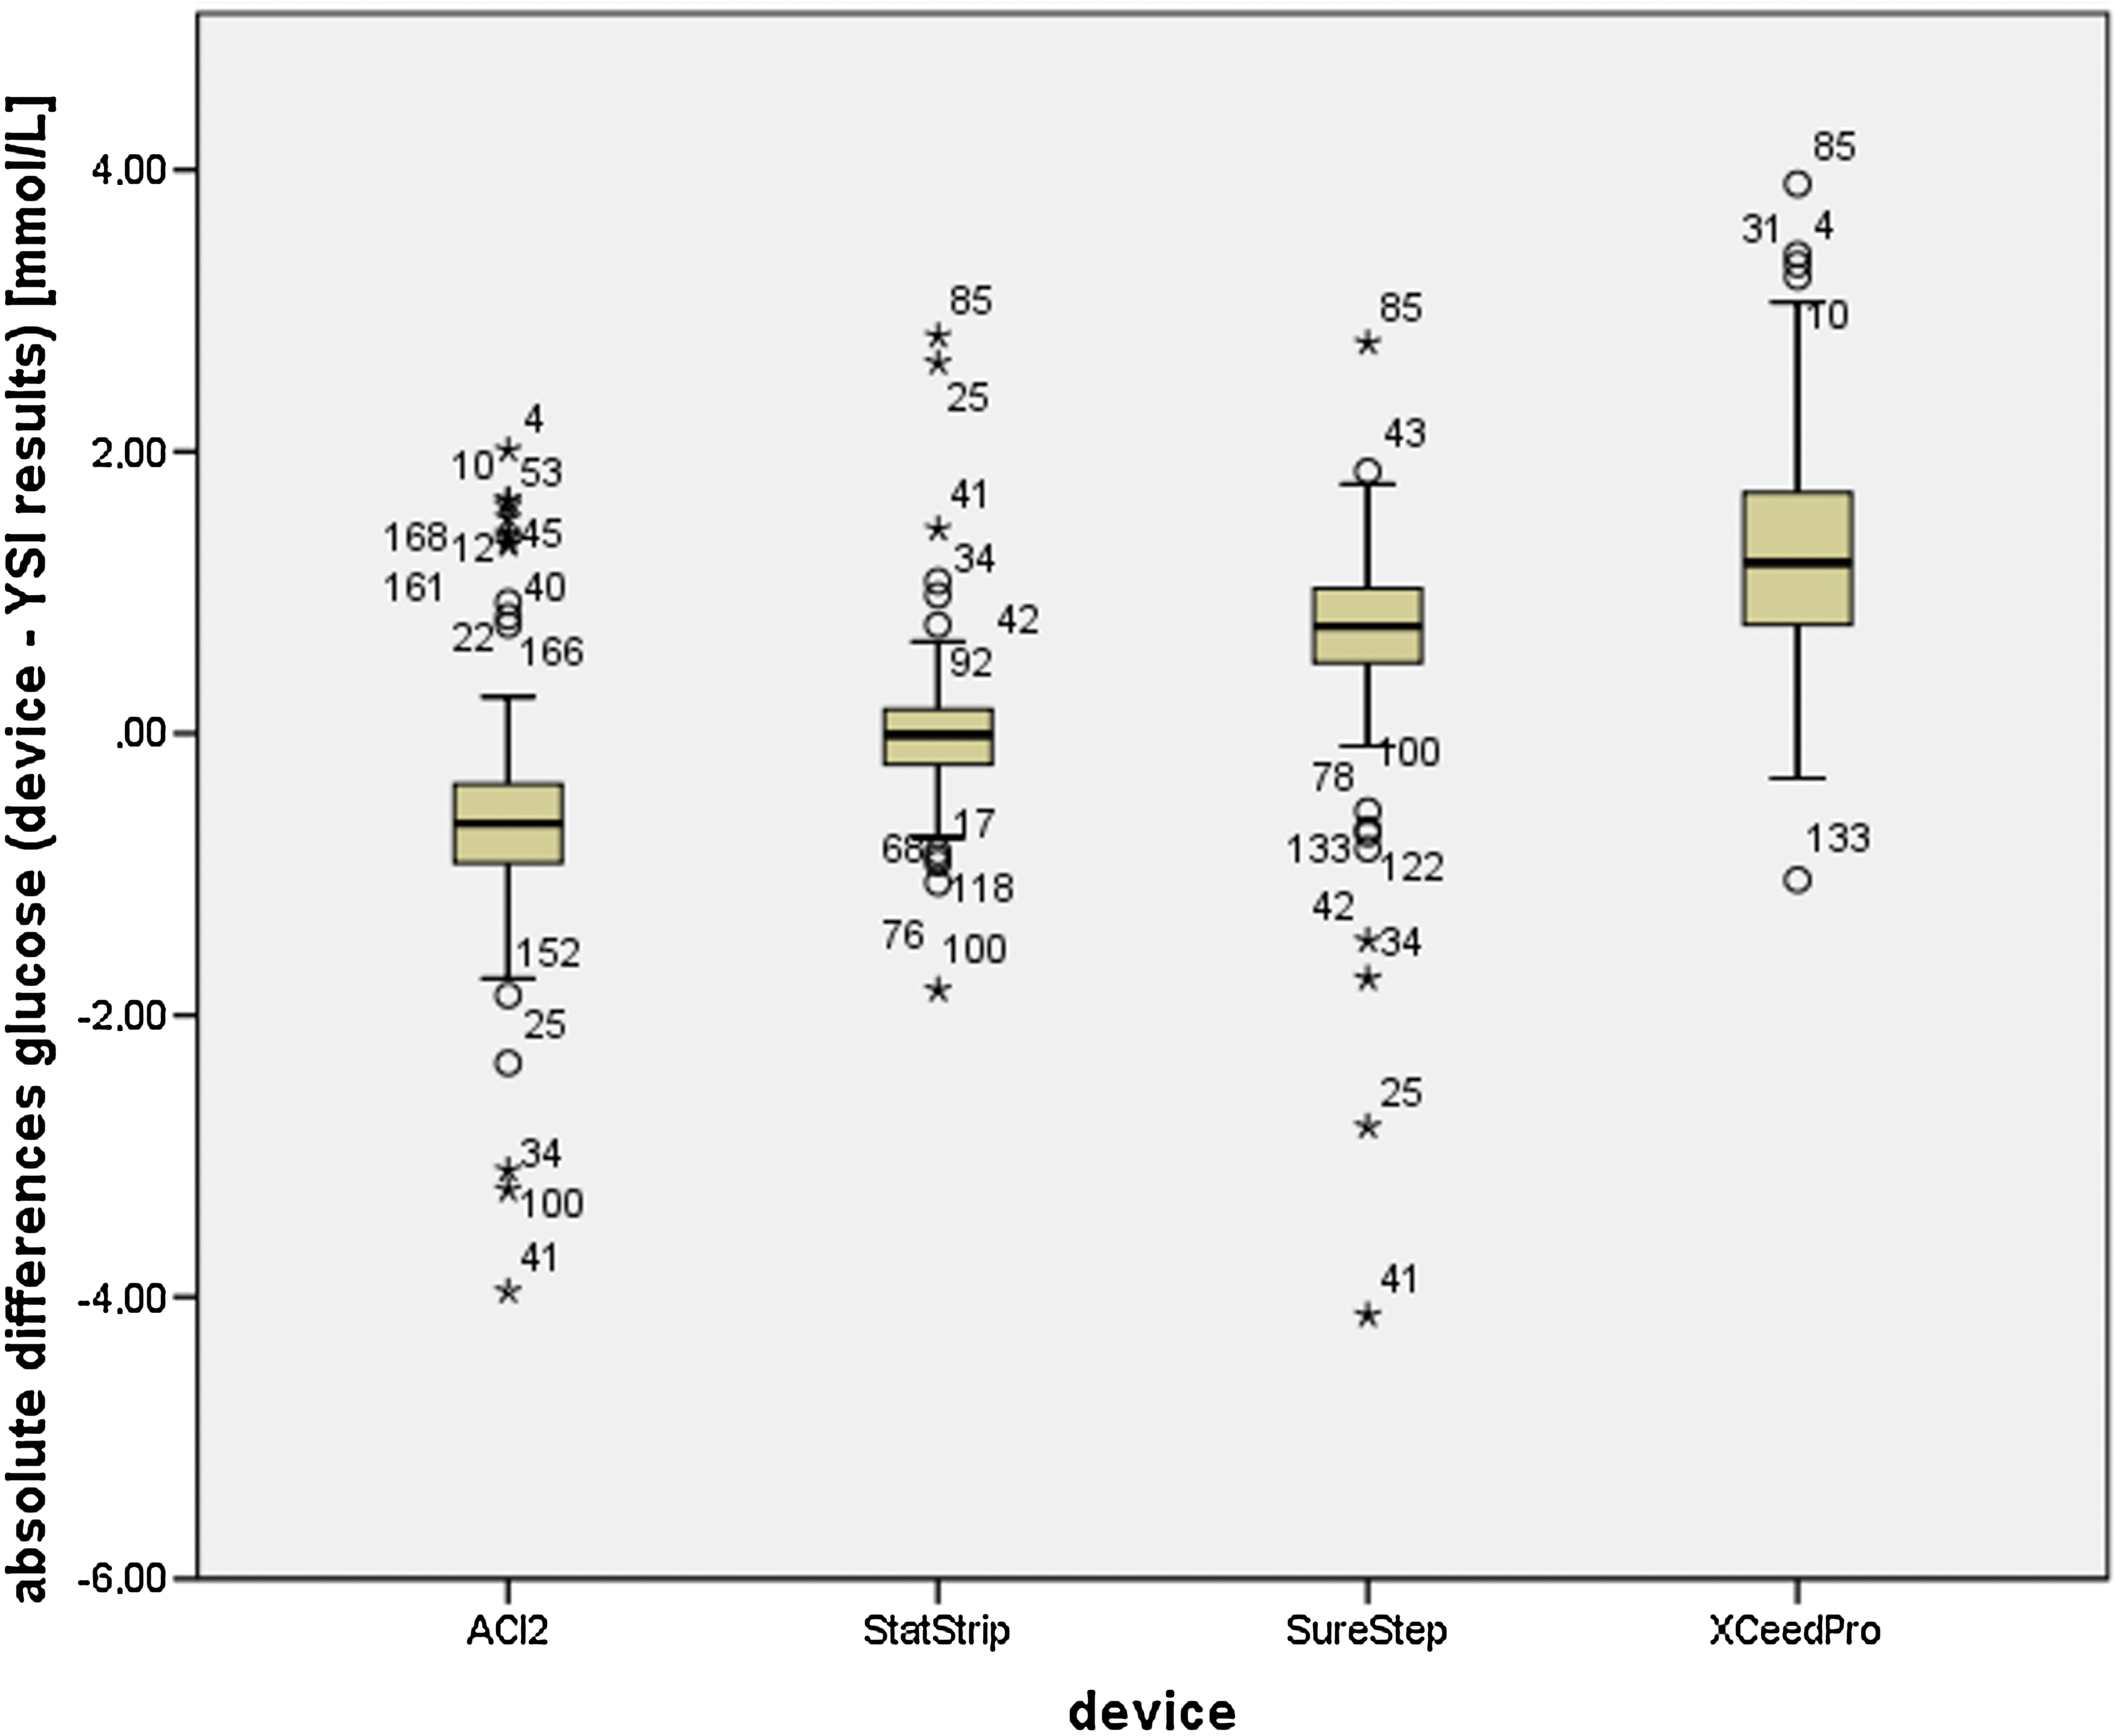
Boxplot of all absolute differences per device in glucose measurements. Each boxplot contains median, 25th and 75th percentiles, and minimum and maximum of the observed, not-outlying values, outliers (circles), and extreme values (asterisks). ACI2, Accu-Chek Inform II. Color images available online at
Medication dependency
One of 41 patients received intravenous ascorbic acid medication, which is a recorded interference for Accu-Chek Inform II. Differentiation between results from this patient and those not treated with ascorbic acid increased the overall accuracy of the Accu-Chek Inform II most (2.3%). All results including and excluding ascorbic acid samples and the general test principle are listed in Table 1. Other medication interferences have not been found.
Accuracy is given according to ISO 15197.
The YSI 2300 analyzer uses the glucose oxidase enzyme.
The number of samples for Xceed Pro is reduced by four because results above 500 mg/dL (27.8 mmol/L) are not displayed.
Oxygen dependency
Oxygen partial pressures were in the range from 14 mm Hg to 317 mm Hg, and samples were classified in four subgroups (categories). The accuracy was ascertained from 14 to 59 mm Hg (44 samples except Xceed Pro with 40 samples, category 1), from 60 to 93 mm Hg (43 samples, category 2), from 94 to 131 mm Hg (43 samples, category 3), and from 132 to 317 mm Hg (43 samples, category 4). StatStrip showed an accuracy above 98% in each of the oxygen groups. A minimum of 93% was reached by Accu-Chek Inform II and 91% by SureStep. The strongest dependency was seen with Xceed Pro, with an accuracy of 38% at the lowest oxygen contents that continuously grew to 65%, 74%, and finally 81% in the portion with the highest oxygen partial pressure. In Figure 2 a boxplot illustrates deviations within the oxygen categories. These data correspond to linear correlations, and the ranking of significances is presented in Table 2. The data used for Table 2 were positively tested for normal distribution by the Shapiro–Wilk test (P>0.05 for all devices) after elimination of outliers and extreme values.

Boxplot of absolute differences per device in glucose measurements within the oxygen categories. Each boxplot contains median, 25th and 75th percentiles, and minimum and maximum of the observed, not-outlying values, outliers (circles), and extreme values (asterisks). ACI2, Accu-Chek Inform II; pO2, partial oxygen pressure. Color images available online at
Hct, hematocrit; pO2, partial oxygen pressure.
Hct dependency
Hct values ranged from 19% to 43%. The accuracy was again ascertained in four groups: from 19% to 24% (48 samples except Xceed Pro with 46 samples, category 1), from 25% to 26% (44 or 43 samples, category 2), from 27% to 28% (35 or 36 samples, category 3), and from 29% to 43% (45 samples, category 4). StatStrip showed an accuracy above 98% in each of the Hct groups. A minimum of 93% was reached by Accu-Chek Inform II and 91% by SureStep. The strongest correlation was again seen with Xceed Pro, with an accuracy of 48% at the lowest Hct contents that continuously grew to 51%, 71%, and finally 87% in the portion with the highest cellular fraction. Table 2 shows linear correlations between absolute glucose biases with YSI 2300 results and Hct values, and in Figure 3 a boxplot is given for visualization of the categorized data.
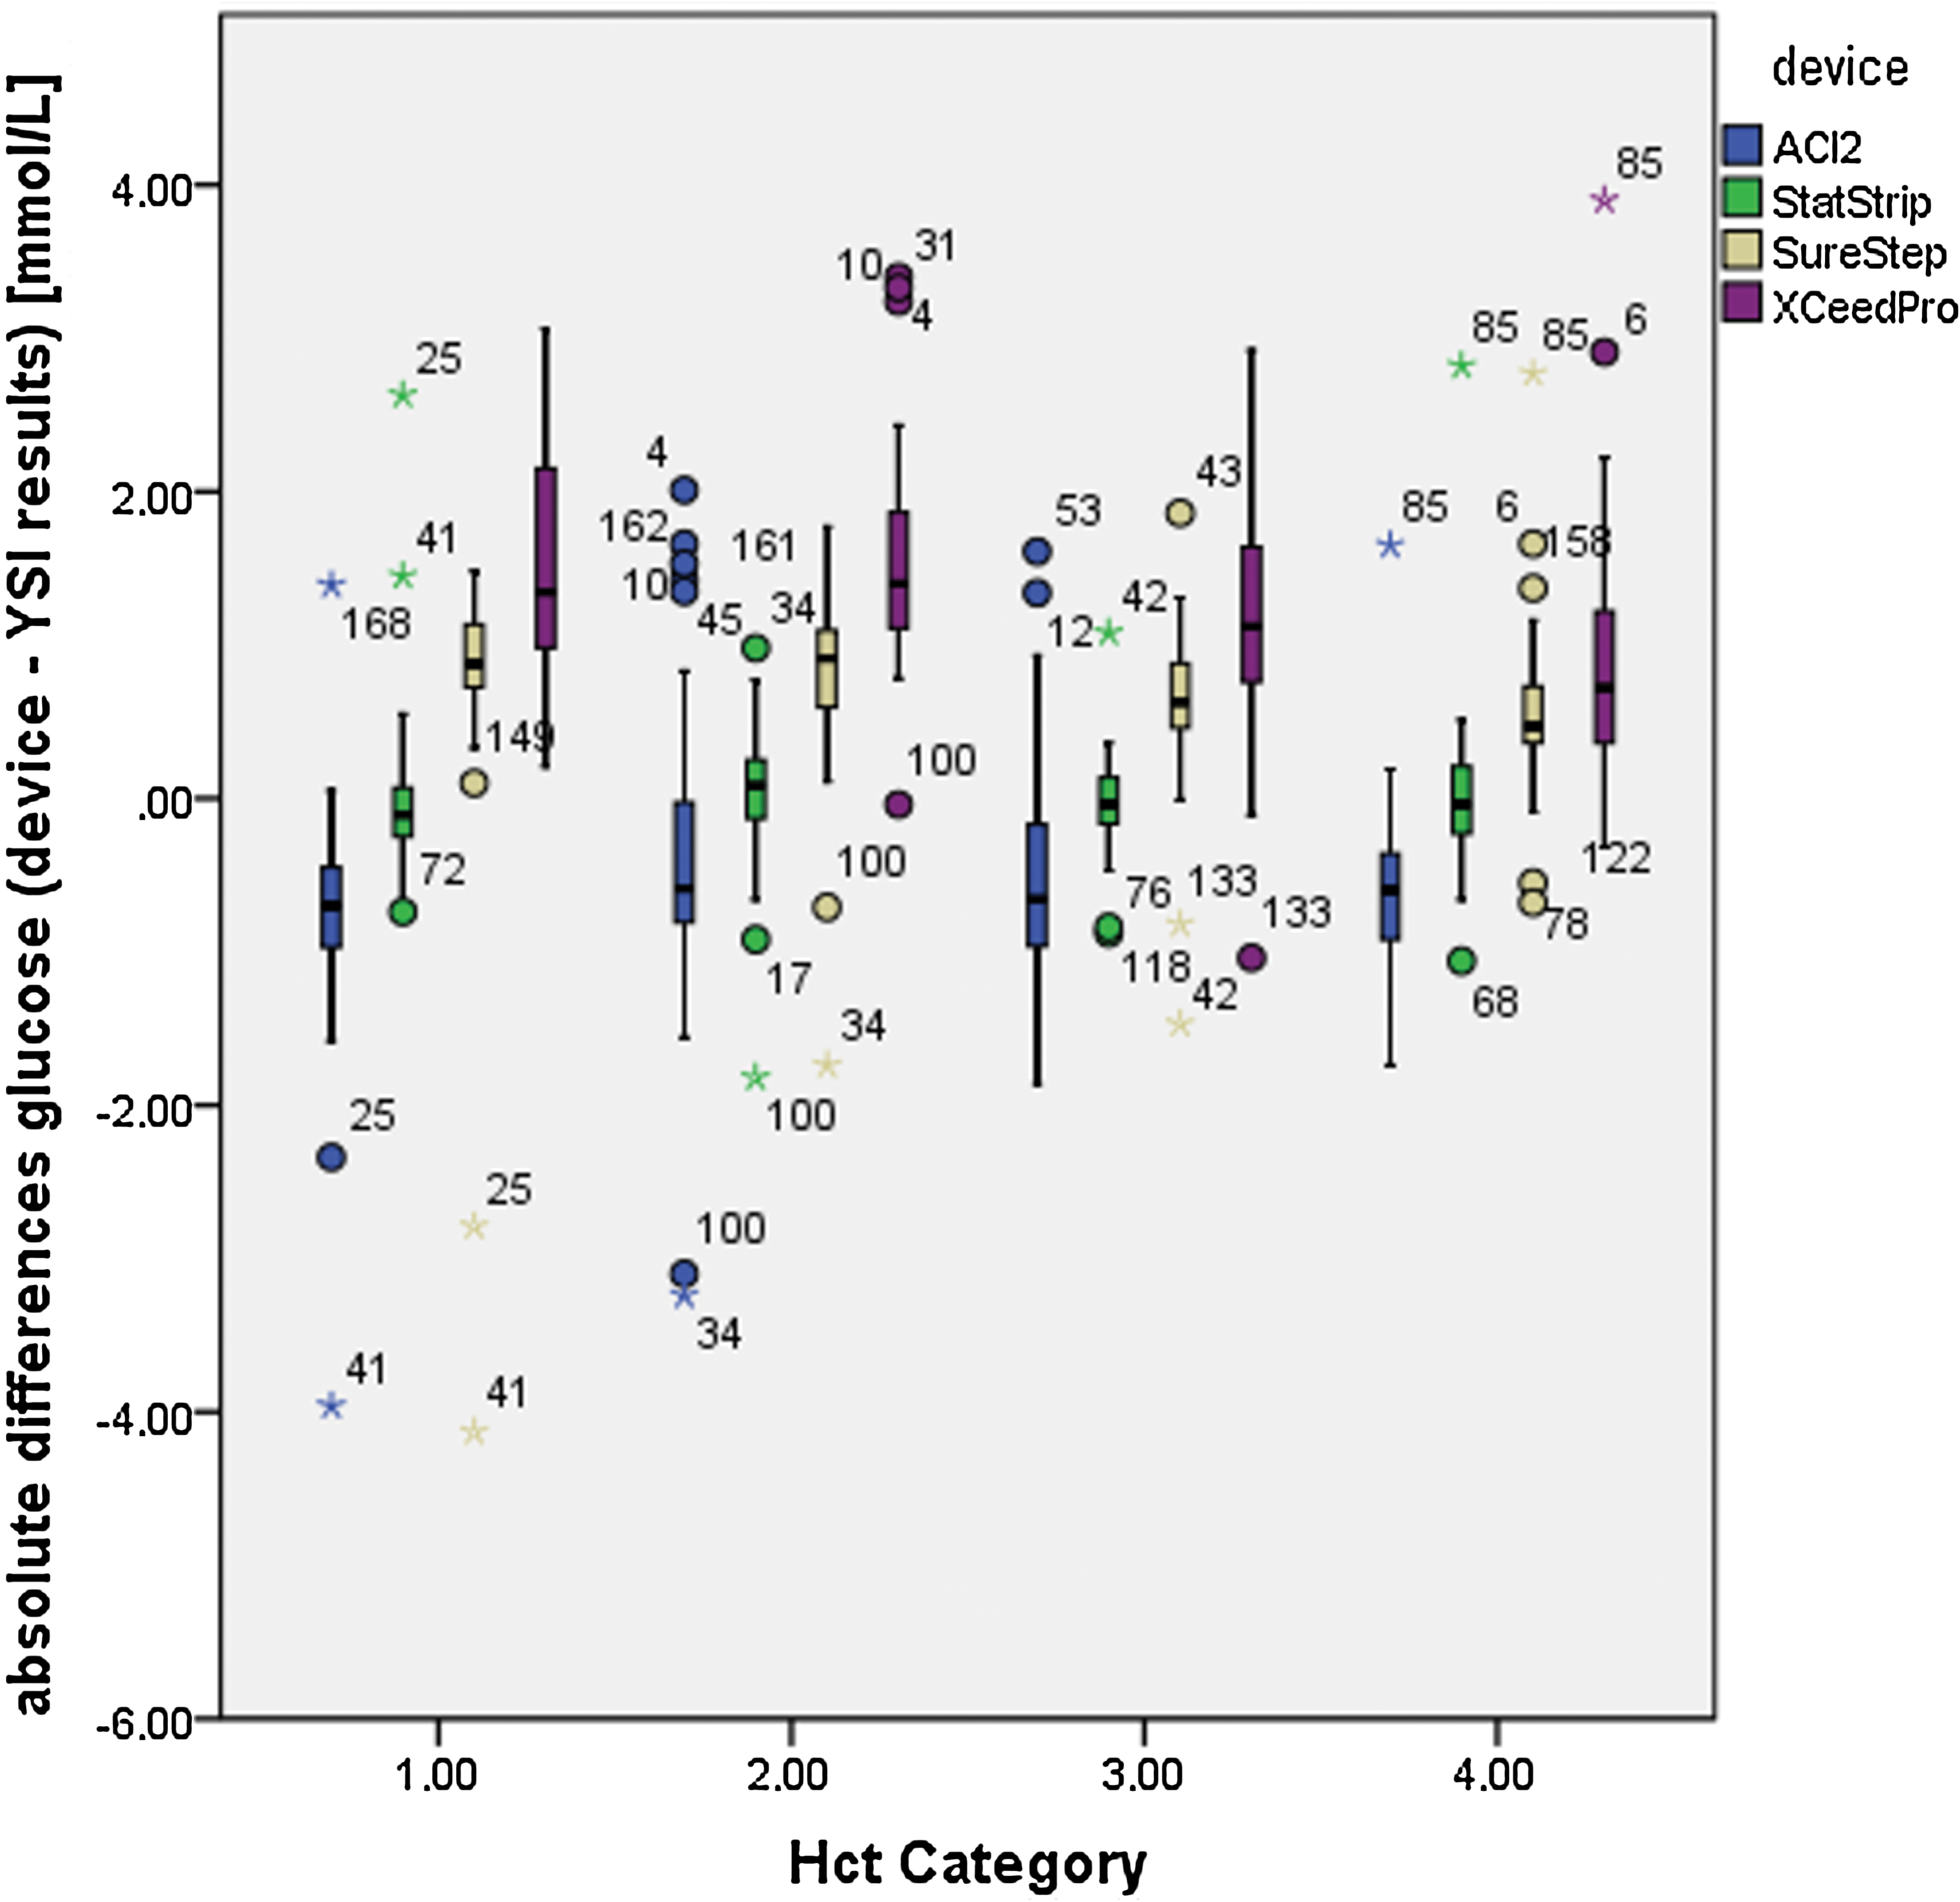
Boxplot of absolute differences per device in glucose measurements within the hematocrit (Hct) categories. Each boxplot contains median, 25th and 75th percentiles, and minimum and maximum of the observed, not-outlying values, outliers (circles), and extreme values (asterisks). ACI2, Accu-Chek Inform II. Color images available online at
Glucose dependency
Glucose values were in the range from 3.87 mmol/L to 29.52 mmol/L. The accuracy was again ascertained in four groups: from 3.87 to 6.03 mmol/L (41 samples, category 1), from 6.07 to 7.29 mmol/L (46 samples, category 2), from 7.39 to 8.61 mmol/L (42 samples, category 3), and from 8.62 to 29.35 mmol/L (44 samples except Xceed Pro with 40, category 4). StatStrip showed an accuracy above 98% in each of the glucose groups. A minimum of 93.5% was reached by Accu-Chek Inform II and 88% by SureStep, whereas Xceed Pro performance was between 60% and 78% accuracy. The strongest linear correlation (Table 2) was seen with SureStep, but all devices showed a significant bias dependency on the absolute glucose values as illustrated by the boxplot in Figure 4.
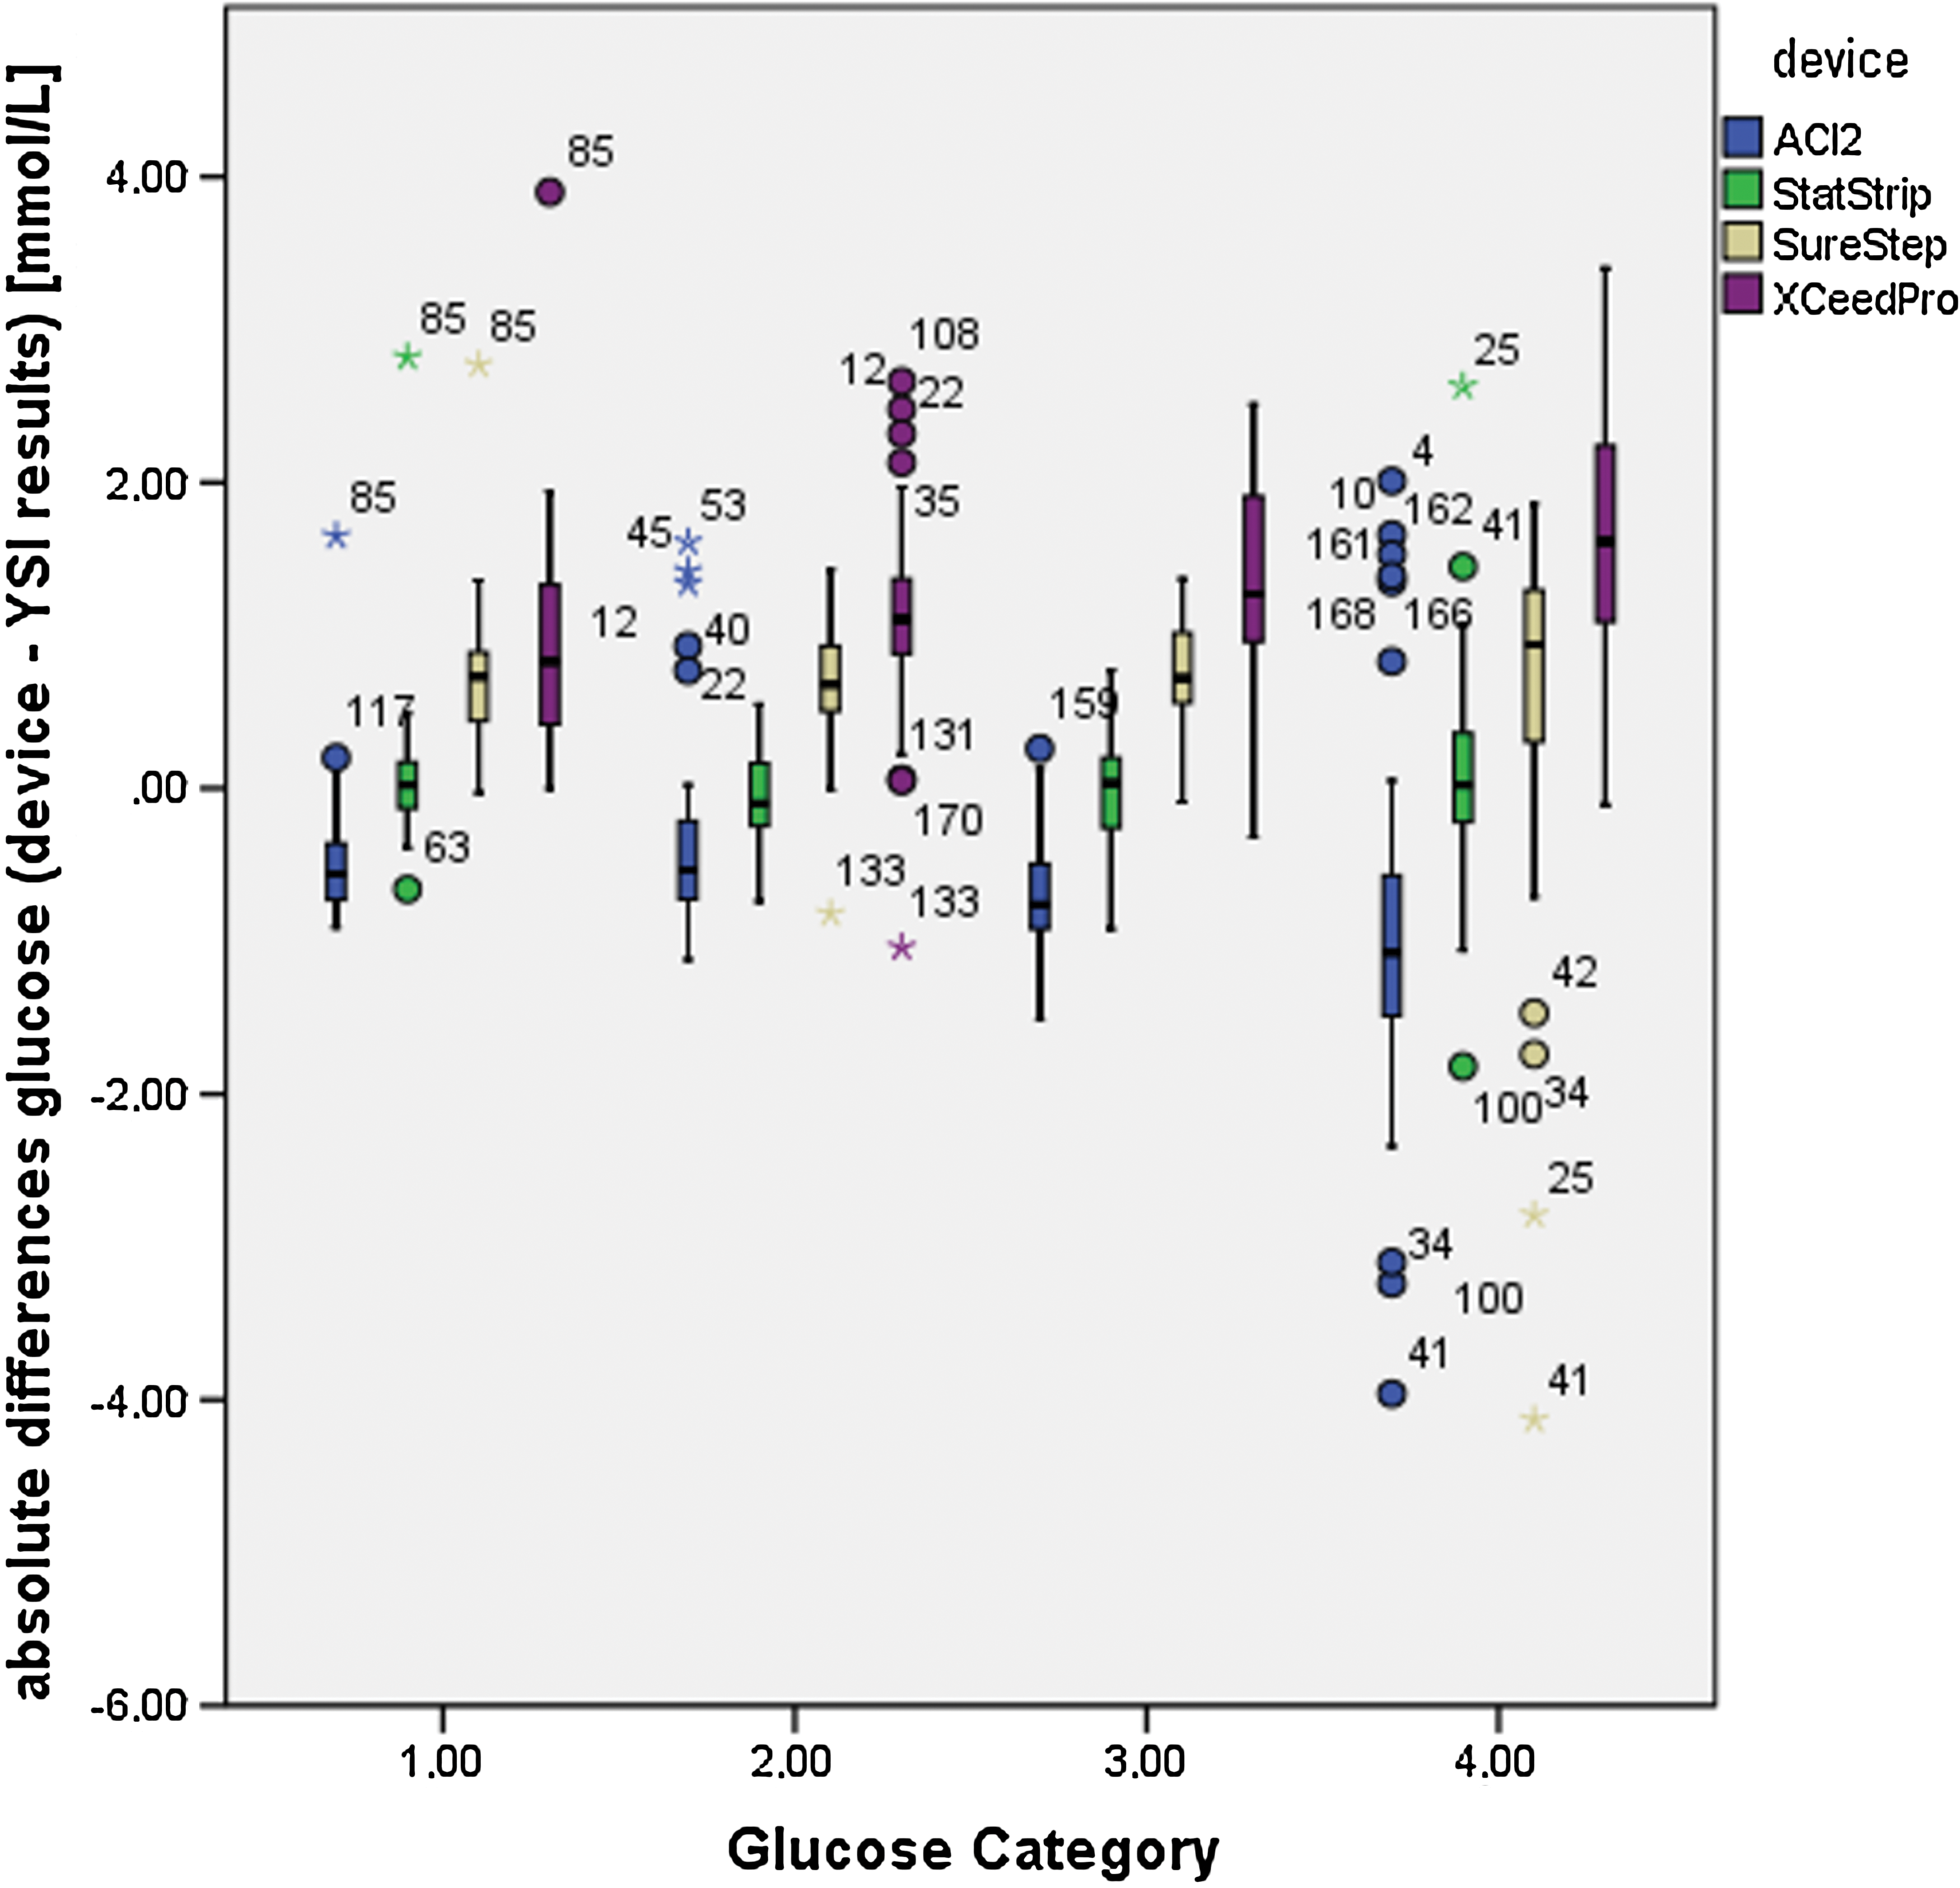
Boxplot of absolute differences per device in glucose measurements within the glucose categories. Each boxplot contains median, 25th and 75th percentiles, and minimum and maximum of the observed, not-outlying values, outliers (circles), and extreme values (asterisks). ACI2, Accu-Chek Inform II. Color images available online at
Maltose-spiked patient samples
Seven blood samples additionally spiked with maltose to reach a final concentration of 2,500 mg/L (7.30 mmol/L) maltose were analyzed by all devices, in duplicate. When samples were additionally spiked with distinct concentrations of maltose or xylose, the mean bias should not exceed identical ISO 15197 requirements. The unspiked samples showed a glucose range from 5.21 to 13.31 mmol/L with a mean of 8.34 mmol/L (n=14). Mean relative bias of the unspiked samples to YSI 2300 results were 12.9% for SureStep, 15.7% for Xceed Pro, 4.2% for StatStrip, and −1.9% for Accu-Chek Inform II.
Mean relative bias values after maltose addition to the YSI 2300 results of the corresponding unspiked samples were now 12.2% for SureStep, 13.7% for Xceed Pro, −0.2% for StatStrip, and −1.6% for Accu-Chek Inform II. Accuracies lay at 100% for StatStrip and Accu-Chek Inform II, 92.9% for SureStep, and 71.4% for Xceed Pro.
A direct comparison of the absolute mean values (Gaussian distribution tested, paired, two-sided t tests) derived from all glucose meters (including YSI 2300) showed only for the Accu-Chek Inform II a significant elevation (P=0.043 shifting the mean from 8.19 mmol/L to 8.45 mmol/L) caused by the addition of maltose.
Xylose-spiked patient samples
Another nine blood samples additionally spiked with xylose to reach a final concentration of 700 mg/L (4.7 mmol/L) xylose were analyzed with all devices, in duplicate. The untreated samples showed a glucose range from 5.28 to 17.79 mmol/L with a mean of 8.24 mmol/L (n=9). Mean relative deviations to YSI 2300 results were 17.1% for SureStep, 17.7% for Xceed Pro, 6.4% for StatStrip, and −1.3% for Accu-Chek Inform II.
After addition of xylose no changes to the mean deviations outranging 6% could be detected for all except for one device (StatStrip). Mean relative deviations (n=18 each device) from the YSI 2300 results were now 11.5% for SureStep, 18.0% for Xceed Pro, 28.5% for StatStrip, and −5.3% for Accu-Chek Inform II. Accuracies lay at 100% for Accu-Chek Inform II, 83.3% for SureStep, 61.1% for Xceed Pro, and 33.3% for StatStrip.
A direct comparison of the absolute mean values (Gaussian distribution tested, paired, two-sided t tests) derived from all glucose meters (including YSI 2300) showed only for the StatStrip a highly significant elevation (P<0.001 shifting the mean from 9.40 mmol/L to 11.31 mmol/L) caused by the addition of xylose.
Data interpretation of results from samples between single instruments of one type
Mean differences between two devices of one type cover a range from 0.32% to 17.2%. Maximum differences (related to the mean absolute values of the two measurements of one sample) were 13.2% for the YSI 2300, 13.2% for SureStep Flexx, 70.4% for Xceed Pro, 22.2% for StatStrip, and 20.3% for Accu-Chek Inform II.
The mean absolute differences and ranges (mean, minimum, maximum) between the two devices per type were as follows (all in mmol/L): YSI, −0.025, −1.12, 1.26; SureStep Flexx, −0.2042, −0.83, 1.78; Xceed Pro, −0.0918, −1.28, 0.61; StatStrip, 0.0218, −1.33, 1.39; and Accu-Chek Inform II, 0.048, −1.56, 2.34.
QC measurements
Table 3 comprises results of all QC measurements. The relative RMSD (column 6) of all mentioned handheld glucose meters (coefficient of variation) at the “low” QC level of all meters was higher (6.1%) than at the “high” QC level (3.6%). A quantitative conclusion for Xceed Pro devices failed caused by merely qualitative QC results. All other devices were capable of going below the required RMSD limit of 11%.
All data are absolute units (in mmol/L).
CV, coefficient of variation; RMSD, root mean square of deviation.
Discussion
The Discussion is structured in two parts (patients' samples and QC) like Results.
Patients' samples
Because only leftover blood from routine blood gas analysis was used for comparison of the glucose meters, the limitation to heparinized blood is given. Nevertheless, a clinical relevant influence on the results is not to be expected. 35 In the following paragraphs the results of the measurements from ICU patients' blood are highlighted from the different points of view.
Overall accuracy
Only Precision Xceed Pro failed to reach the ISO 15197 overall 95% accuracy criterion. A positive bias of the results is found with the XceedPro and the SureStep. StatStrip showed the best absolute accuracy, and Accu-Chek Inform II performed with a moderate negative bias.
Medication
We did not find new medication interferences.
In one of our patients' samples with intravenously administered ascorbic acid we saw a positive bias in all tested glucose meters except StatStrip. The most distinctive deviation was seen for Accu-Chek Inform II, which is an already known source of interaction and mentioned in the Roche product insert.
Oxygen/Hct/glucose
StatStrip was the only system to accomplish ISO 15197 95% accuracy in all oxygen portions. Accu-Chek Inform II had one dropout portion (93%), and SureStep had two portions (91% and 93%) in the lower oxygen (<150 mm Hg) content. Xceed Pro failed in every portion. Similar results were found when the Hct ranges are split into categories.
The lower the Hct, the lower was the accuracy for Xceed Pro. SureStep and Accu-Chek Inform II failed in two lower or middle Hct categories: SureStep, 91% and 92%; Accu-Chek Inform II, 93% and 94%.
Glucose variations did not affect the accuracy of the StatStrip system (all portions above 98%). Accu-Chek Inform II reached only in the range from 6.07 to 7.29 mmol/L an accuracy of 93.5%, whereas SureStep failed in the lower category (88%). In all other categories the 95% hurdle was taken by both systems. In none of the categories was Xceed Pro able to resolve a accuracy above 78% (minimum 60%), highlighting the limited performance of the system. The absolute biases and spreading of all devices correlate with the amount of glucose so that in the hypoglycemia-endangered category the smallest absolute spreading was detected. Nevertheless, positive biases in glucose category 1 (3.87–6.03 mmol/L), which were seen with SureStep and Xceed Pro, imply a probably clinical relevant overestimation of real glucose levels in patients' blood.
Maltose/xylose
Elimination of false hyperglycemia diagnosis by cross-reaction of maltose with some glucose meters was a major disadvantage to prior systems. 36 Only Xceed Pro and SureStep Flexx showed significant response (dropping according to ISO 15197 below 95% accuracy) to a maltose stimulus of a concentration being at least twice the level that might be reached by medications containing maltose (0.9 mmol/L) 12 or by peritoneal dialysis with metabolic maltose release (1,112±59 mg/L and 3.25±0.17 mmol/L, respectively). 37 A statistically significant absolute increase of the mean glucose levels of 0.26 mmol/L was seen with the Accu-Chek Inform II; all other increases (SureStep and YSI 2300) or decreases (Xceed Pro and StatStrip) had P>0.05.
Xylose, another type of sugar that is used for diagnostic reasons, is assumed for all systems not to interfere. According to ISO 15197 we found a significant deviation for results measured in blood samples containing a clinical accessible amount range of xylose (2.26±0.82 mmol/L) 38 with the StatStrip system. SureStep Flexx and Xceed Pro were, to a lesser extent, also influenced by xylose. The absolute means of glucose were statistically significant elevated (1.9 mmol/L) only for the StatStrip system. All other devices showed no significant changes in the glucose levels measured in the presence of xylose.
QC
Comparison of samples from patients in critical conditions (e.g., in ICUs or during extensive surgery) is the outstanding challenge for glucose POCT devices. Minimum requirement for their use is the compliance to local 39 QC guidelines, which is set at 11% RMSD for non–unit-use-reagents. Therefore it is a challenge for strip-based quantification of glucose, particularly at a lower level, which statutorily has only to comply with the manufacturers' requirements. It should be pointed out that “low”-level QC samples have a range of target values from 40 mg/dL (2.22 mmol/L) for Sure Step Flexx to 119 mg/dL (6.61 mmol/L) for Accu-Chek Inform II. Even though all devices were capable of reaching a relative error (RMSD) below 11% as required for the not–unit-use devices, the value for YSI 2300 and all glucose meters (except Xceed Pro) is 7.86%. A quantitative conclusion for QC results of the Xceed Pro devices could not be drawn because only qualitative results were displayed.
As expected, the high-level QC results, with target values between 211 mg/dL (11.7 mmol/L) for Rapidlab and 450 mg/dL (25 mmol/L) for YSI 2300, had a lower mean RMSD from YSI 2300 (without Xceed Pro) of 4.15%. Probably the artificial high frequency of QC measurements (two or three times per day) implements a benevolent bias.
Professional care glucose meters of the recent generation such as StatStrip and Accu-Chek Inform II with Performa test strips (marked with a green symbol on the test strip box) as well as the older system SureStep Flexx are capable of fulfilling ambitious QC regimens. Speed of testing time, requirement of low blood volume (data not shown), and reduction of interference sensitivity demonstrate the beneficial developmental paths in glucose POCT. Variations in partial oxygen pressure, Hct, or maltose are no more destructive in the observed ranges, but there still are interferences to face, such as xylose for the StatStrip or ascorbic acid for the Accu-Chek Inform II/Performa system.
In conclusion, especially for ICU patients who undergo mechanical ventilation or intravenous volume therapy leading to oxygen pressure (partial oxygen pressure of 14–317 mm Hg) and Hct (values of 19–43%) variations, the accuracy of new handheld glucose meters has improved in comparison with the former generations of glucose meters.
The new ones (StatStrip and Accu-Chek Inform II) show no positive bias and help to protect in particular sedated patients from probably iatrogenic hypoglycemic periods.
Footnotes
Acknowledgments
The study was funded by a grant from Roche Diagnostics (Rotkreuz, Switzerland) and the Department of Anesthesiology of the University of Regensburg.
Author Disclosure Statement
S.H. and B.G. declare that no competing financial interests exist. M.G. received consultant fees and lecture/travel fees from Siemens Healthcare Diagnostics GmbH (Eschborn, Germany) and Instrumentation Laboratory GmbH (Kirchheim, Germany). Additional research grants were funded by Roche Diagnostics (Graz, Austria and Mannheim, Germany), Siemens Healthcare Diagnostics' Instrumentation Laboratory (Kircheim, Germany), and Radiometer GmbH (Willich, Germany).