
Abstract
Background:
Our study examines the hypothesis that in addition to sugar starch-type diet, a fat-protein meal elevates postprandial glycemia as well, and it should be included in calculated prandial insulin dose accordingly. The goal was to determine the impact of the inclusion of fat-protein nutrients in the general algorithm for the mealtime insulin dose calculator on 6-h postprandial glycemia.
Subjects and Methods:
Of 26 screened type 1 diabetes patients using an insulin pump, 24 were randomly assigned to an experimental Group A and to a control Group B. Group A received dual-wave insulin boluses for their pizza dinner, consisting of 45 g/180 kcal of carbohydrates and 400 kcal from fat-protein where the insulin dose was calculated using the following algorithm: n Carbohydrate Units×ICR+n Fat-Protein Units×ICR/6 h (standard+extended insulin boluses), where ICR represents the insulin-to-carbohydrate ratio. For the control Group B, the algorithm used was n Carbohydrate Units×ICR. The glucose, C-peptide, and glucagon concentrations were evaluated before the meal and at 30, 60, 120, 240, and 360 min postprandial.
Results:
There were no statistically significant differences involving patients' metabolic control, C-peptide, glucagon secretion, or duration of diabetes between Group A and B. In Group A the significant glucose increment occurred at 120–360 min, with its maximum at 240 min: 60.2 versus −3.0 mg/dL (P=0.04), respectively. There were no significant differences in glucagon and C-peptide concentrations postprandial.
Conclusions:
A mixed meal effectively elevates postprandial glycemia after 4–6 h. Dual-wave insulin bolus, in which insulin is calculated for both the carbohydrates and fat proteins, is effective in controlling postprandial glycemia.
Background
However, there are still too few published studies that analyze the effectiveness of the three standardized types of insulin boluses (characterized below) and their metabolic effect on postprandial blood glucose level. The published research shows that a prolonged delivering of insulin, in both the normal- and square-wave type boluses for a mixed meal, normalizes glycemia much more efficiently than the normal-wave bolus setting acting alone. 6 –10 Jones et al. 6 and Lee et al. 7 have found that for a high fat content in a meal, such as in popular pizza, the dual-wave bolus has been shown to most effectively match the postprandial glycemic control, as well as to adjust for the fasting glucose level. According to the study protocol in these two publications, 6,7 only the CHOs were accounted for in a total dual-wave insulin bolus dose.
The hypothesis was formed that not only the CHO products lead to postprandial hyperglycemia, but, in addition, the fat-protein nutrients raise the blood glucose concentration up to 6 h postmeal as well. Therefore, the idea of the modernized algorithm for calculating the prandial insulin programming for a mixed meal was conceived. In this new algorithm, the required insulin dose is calculated for the specific CHO product and is to be delivered immediately as a quick bolus, and for a fat-protein product it is to be delivered in a modified extended bolus. Unfortunately, there are still no strict guidelines for the accounting the fat and protein components in food as an important factor of PPHG, nor are there detailed instructions for the protocol of the proper accurate fat-protein adjusting to achieve the required total meal insulin.
There is a strong suspicion that PPHG is related to the increased secretion of glucagon. It is known that the glucagon level falls after oral glucose but not after a protein-containing meal in subjects without diabetes. Based on a recently published study 11 that analyzed the change in glucagon postmeal secretion during the first year from T1D onset, it was established that during depletion of C-peptide, glucagon secretion is increased after a meal.
The first objective of the present study is to assess the impact of a fat-protein meal on postprandial hyperglycemia, and the effectiveness of computed insulin dose for both CHO and fat-protein meal, in controlling the postprandial elevated glucose level. The second objective is to assess the change of glucagon secretion after a meal, as a potential factor affecting the postprandial elevation of glucose.
Subjects and Methods
Study design
The protocol of the study was prepared by our medical team at the Department of Pediatrics, The Warsaw Medical University, Warsaw, Poland, and then presented to and approved by the Ethics Committee at the State Warsaw Medical Chamber, to be conducted as randomized, open-label trial at the in-patient clinic for children with diabetes. Written legal informed consent was signed and included parents' and/or the legal guardian's consent for all pediatric participants. The eligible participants have met all the inclusion criteria, according to study protocol as T1D, CSII, 12–18 years old, and negative fasting C-peptide. The exclusion criteria were following: a poor metabolic control (glycated hemoglobin >10%); either presently on steroid therapy or likely to require one in a near future; intestinal malabsorption status, such as celiac or pancreatic disease; virus or bacterial infection; body mass index >30 kg/m2; and physical or intellectual restraints.
Procedure
Prior to the first screening visit at the clinic, all patients and their caregivers were instructed in both getting acquainted with the procedure and understanding it. During the first screening visit, a fasting blood sample was collected for biochemical analysis, C-peptide, and glycated hemoglobin. Between the screening and randomization visits, the basal insulin requirement and ICR was titrated for each individual, based on a seven-point glycemia profile.
The patients were treated with an insulin pump (Spirit [Roche Diagnostics, Indianapolis, IN] or Paradigm® 712 or 722 [Medtronic, Northridge, CA]), using either of two insulin analogs, aspart or lispro. They were randomly assigned to either the experimental Group A or the control Group B. Patients in Group A received a dual-wave insulin bolus following dinner, with the required insulin dose calculated using the algorithm: n CU (10 g of CHO)×ICR/normal wave+n fat-protein×ICR/extended wave. The set time for an extended insulin bolus was 6 h postprandial.
The control Group B received a normal-wave bolus, and their insulin dose was calculated as CU×ICR.
Meal and food units
For the purpose of the study, a pizza dinner was served to all participants. It was made up of dough (starch [65 g]) and dressing (cheese [50 g], olive oil [5 g], salami [20 g], and chunks of ham [50 g]). The dough and dressing nutrients accounted for 46.8 g of CHOs, 33.1 g of fat, and 25.4 g of protein. All the nutrients were transformed into units, in which 1 CU was defined as 10 g=40 kcal of CHO; the fat-protein unit (FPU) was defined as 100 kcal of fat and protein. In total, pizza nutrients accounted for 4.5 CU and 4.0 FPU. The pizza meal was served at dinnertime (6 p.m.).
Laboratory assessment
Blood samples were collected at 0, 30, 60, 120, 240, and 360 min after meal/prandial-insulin setting. In 20 healthy children without diabetes, blood samples were taken to estimate glucagon concentration. The plasma glucose concentrations were evaluated using the hexokinase method and were analyzed at the Warsaw Medical University Laboratory. The plasma glucagon concentration and C-peptide were assessed using a radioimmunoassay method (human radioimmunoassay kit), in accordance with the manufacturer's instructions (Millipore, Billerica, MA) at the Department of Gastroenterology and Metabolic Disease Laboratory. For glucagon, the normal range in healthy individuals without diabetes is 50–150 pg/mL, and for C-peptide, it is 1.06–3.59 ng/mL.
Sample size
The primary end points were set, based on the differences between the two groups in glucagon concentrations and plasma glucose concentrations at 30, 60, 120, 240, and 360 min postprandial.
We reasoned that when the initial end point was the concentration of glucagon, measured before the meal at 0 min and then at 2, 3, and 6 h postprandial, if the difference between 0 min and the ensuing time points amounted to <25% (±15 g/L), then it was significant. Using 1:1 randomization and assuming the possibility of an error β=20% (power 80%) and α=5%, it was further determined that every group should consist of 10 patients. After predicting that about 30% of patients might not complete the study, the size of the group examined was determined to have a total of 26 patients. The randomization lists were prepared by an independent person working outside the project, using the standard function of StatsDirect statistical software (StatsDirect StatsCard software [
Statistical analysis
All statistical evaluations were conducted on the intention-to-treat population. The regularity of distribution of all parameters was evaluated using the Shapiro–Wilk test. The significance of difference of mean between the two groups was calculated, using Student's t test for parameters with normal distribution. To check the assumption of normal distribution, the Mann–Whitney test was used. The comparison of glucagon in consecutive time set points to the reference level in control Group B was analyzed by the Mann–Whitney test. The analysis of variance model, including the effect of time changes, the particular group, and interaction of time changes in the group, was used to define the variation of plasma glucose, glucagon, and C-peptide, in the 30-, 60-, 120-, 240-, and 360-min time span, with the baseline values as covariate. Spearman's Rank Correlation was used to describe association of plasma glucose with C-peptide level. The significance of variation in the set time points was assessed by paired Student's t test. The standard Student's t test was used for comparison of the increment of values at the consecutive time points. The level of significance was set in all analysis as α=0.05. The statistical analysis was performed with SPSS for Windows release 12.0.1 (2004) (SPSS Inc., Chicago, IL) and R release 2.9.2 (2009) (R Development Core Team, R Foundation for Statistical Computing [
This trial was conducted in accordance with Good Clinical Practice.
Results
The trial scheme is depicted in Figure 1. The mean age of the patients and the duration of T1D were similar in both control Group B and experimental Group A. Groups A and B were similar at baseline in glycated hemoglobin values (7.5±1.3% vs. 7.2±0.9%, respectively; P=0.51) and in total cholesterol and total glycerides. The low-density lipoprotein and high-density lipoprotein cholesterol concentrations were noticeably lower in experimental Group A (P<0.05). The characteristics of randomized Group A and B subjects are given in Table 1. The total daily and basal insulin doses, assessed by IU/kg/day, and the number of dual-wave boluses per day were comparable in both Group A and B. The insulin dose for a pizza meal was increased by the amount of insulin adjusted for fat-protein, according to the procedure protocol for Group A, and the difference between Group A and B was significant. The comparison of insulin requirement parameters for Groups A and B is presented in Table 2.

Flow diagram.
BMI, body mass index; Chol, cholesterol; HbA1c, glycated hemoglobin; HDL, high-density lipoprotein; LDL, low-density lipoprotein; Max, maximum; Min, minimum; TG, triglycerides.
Max, maximum; Min, minimum.
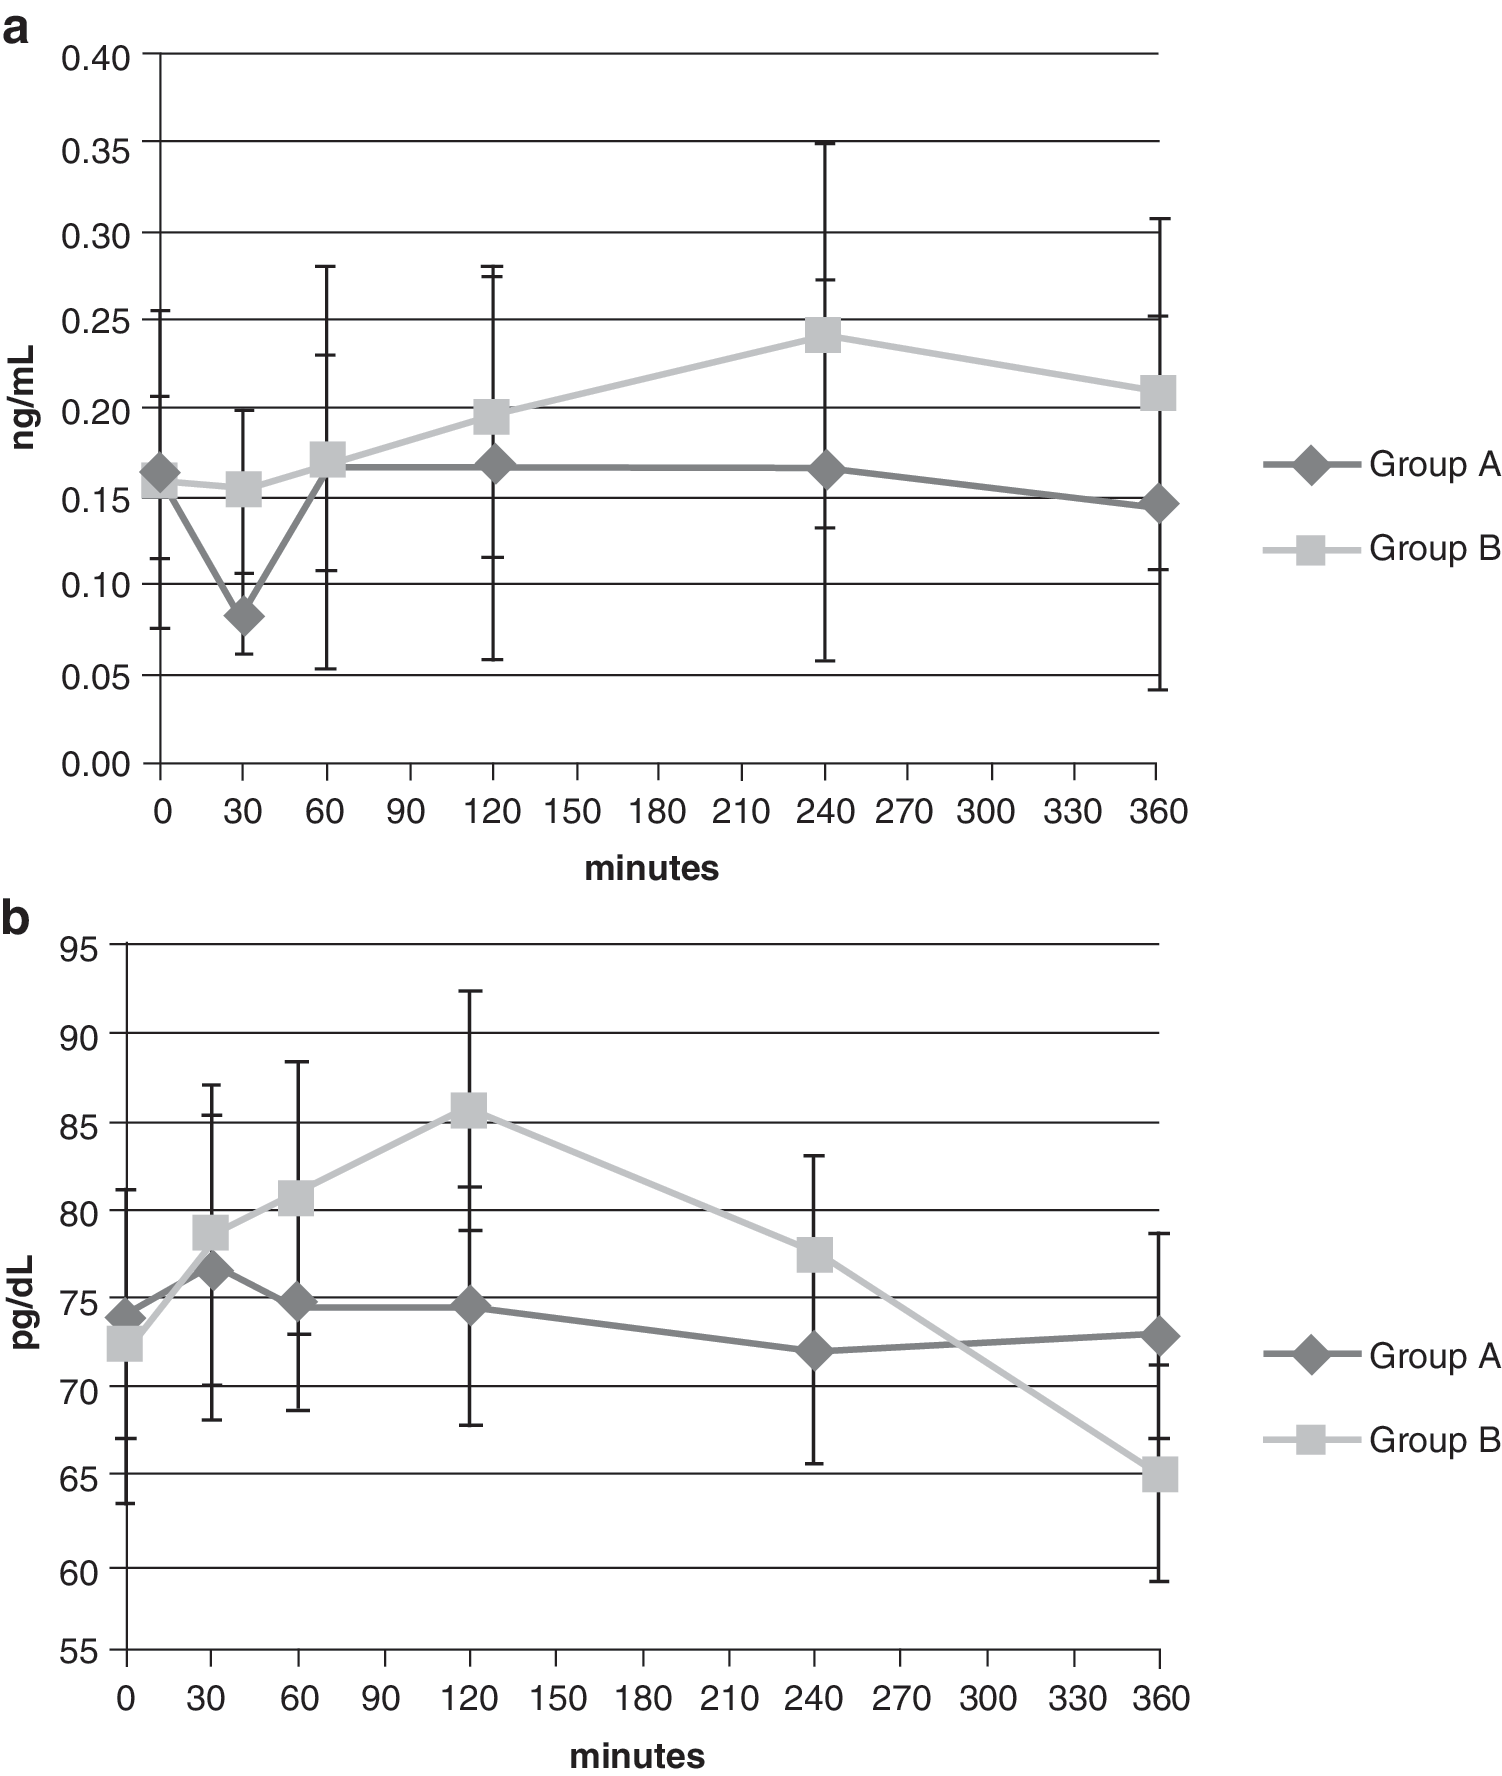
Glucagon and C-peptide concentrations
There were no differences in glucagon and C-peptide secretion between the two groups in set time (Fig. 2). In addition, there were no significant differences in change in glucagon level and change in C-peptide level readings. The comparison of glucagon concentration in patients with and without diabetes at 360 min shows a significantly lower value in control Group B, compared with a healthy population without diabetes (Group C) (Table 3).
Change in (
Max, maximum; Min, minimum.
Postprandial elevation of glucose
The baseline glucose level was comparable in Group A and B (96.8±29.9 mg/dL vs. 136.1±59.2 mg/dL, respectively; P=0.054). The analysis of variance showed a significant increase of glucose level in Group B in set time (P=0.008). Figure 3 presents the postprandial glucose elevation in both experimental Group A and control Group B. Assessing the change of glucose level from 0 min to ensuing measurement points set at 30, 60, 120, 240, and 360 min postprandial, relevant differences were observed only in control Group B at 120 (P=0.003), 240 (P=0.004), and 360 (P=0.003) min (Fig. 4). A significant negative correlation between the basal insulin requirement and postprandial glycemia in Group A at 60 and 120 min was also observed.

Change of glucose values in Group A and B with time. Data are mean±SE values. *P<0.05.

Change (Δ) of glucose level with time. Data are mean±SD values. *P<0.05.
The hypoglycemic episodes (levels below 50 mg/dL) are presented in Table 4. The difference between the two groups in biochemical hypoglycemia at 240 min was significant. Nonsymptomatic hypoglycemia occurred during the study.
Discussion
The analysis presented showed the postprandial rise of glycemia, resulting from a mixed sugar-starch and fat-protein meal. The CHOs contained in pizza, along with the additional fat and protein ingredients, cause a peak of hyperglycemia at 4–6 h postprandial when treated only with the regular insulin bolus. The increase of postmeal blood glucose level, compared to the initial premeal glucose level, was closely related to set time during the 6 h of the trial. In addition, the average glucose values between 2 and 6 h after the meal were lower in Group A, treated with dual-wave insulin boluses. In this group, the average insulin meal dose was higher because of added fat-protein to the diet, and the insulin was delivered in extended boluses. However, the average insulin dose for CHO product was comparable in both Groups A and B. Considering the average basal insulin dose in control Group B and experimental Group A, both with depletion of β-cell function, the rise of postprandial glycemia in set time seems to be related to prandial insulin dose and various kinds of insulin boluses. The postmeal analysis of glucagon secretion showed that hyperglycemia is not due to the increased secretion of glucagon. In both groups the average glucagon level was similar and did not fluctuate during the 6-h postprandial period.
Comparing the results of our study with previously published results, we found that our research is consistent with the earlier hypothesis that a meal rich in fat increases the glucose level during an extended period, up to 10–12 h postprandial. The difficulty in controlling hyperglycemia after a pizza meal is well documented. 12 Previous, independently conducted published studies by both Jones et al. 6 and Lee et al. 7 determined that administering insulin in the form of a dual wave, with the extended bolus programmed for 6–8 h, controls the elevated glycemia level better than only the normal wave bolus 6–12 h after ingestion of a meal rich in fat, such as pizza. These authors also concluded that a dual-wave bolus ensures a lower glucose level. The results of our present study lead to similar conclusions; however, the main difference is in the modified algorithm that we developed in calculating a total meal insulin dose formula. According to Lee et al. 7 and Jones et al., 6 their insulin formula protocol accounts only for the CHO elements in food, and as such alone, they are considered in total dose of insulin in dual-wave insulin boluses and roughly shared in normal-wave bolus and square-wave bolus. Our protocol improves the existing insulin formula protocol and calculates the total insulin dose in experimental Group A by strengthening it with the additional insulin accounted for by fat-protein: ICR×n CU±ICR×n FPU. In addition, as a departure from one of the first studies on the topic that tested four types of insulin boluses for a mixed/fat meal, the protocol of our study calls for some of the dose of insulin to be infused to all patients. We have found the lesser value of glucose at 240 min after meal, with the dual-wave and square boluses delivered, compared with the double- and normal-wave boluses. Our results also point to the effect of the late postprandial hyperglycemia.
Each patient differs in regard to response to metabolism, meal, study design, proportion of the normal and extended part of insulin boluses, and the method of glucose assessment, among other factors. However, every patient showed a significantly lower glucose level 4–12 h after receiving insulin in dual/square-wave boluses.
The analysis presented here shed new light on the strategy of functional insulin therapy, particularly on the terms and conditions of meal bolus programming. Our results indicate that fat-protein meal components lead to PPHG. The improvement over the existing formula is in a new attitude to postprandial insulin dosing, which is the response to a complete meal charge by the inclusion of fat-protein elements with the CHOs and, as such, to be considered in a total insulin dose. Based on our improved formula, the already existing programming of insulin pumps with the three standardized bolus settings for CHOs can be easily reprogrammed with the addition of a new fat-protein algorithm.
The limitations of our study are that the newly developed algorithm is not in reference to the algorithm used by Jones et al. 6 and Lee et al. 7 and that the dose of insulin for meal in our trial was reinforced by an additional quantity given to our experimental Group A. This study was conducted in 1 day only, with no further mixed sugar-starch/fat-protein meals tested. Furthermore, the study procedure did not evaluate the postprandial free fatty acid concentration, leaving to further study an understanding and explanation of the pathogenesis of PPHG over an extended interval after a meal rich in fat.
This study hopefully launches a critical discussion on the topic of fat-protein nutrients being accounted for in a general scheme for the CHOs. Still remaining are some unanswered questions, such as the pathogenesis of late postprandial hyperglycemia and its relation to the fat a meal contains, the prolonged absorption of newly ingested CHO product when the fat intake already took place, the increased free fatty acid concentration, or the increase of peripheral insulin resistance. The other issues remaining could be establishing the cutoff point on fat–protein content in a meal or the precise moment in which the additional extended bolus from the insulin pump should kicked in. The logistics issue still remains to be solved in implementing the new calculating procedure, as relevant therapy improvement in the general T1D, multifaceted, multi-aged population. How to successfully introduce this complex new algorithm to young patients and their parents/guardians and to ensure that the innovation will not end up being too difficult for many insulin pump users in their daily self-management routine (the user-friendly approach). The proper diet education should be verified in addressing critical aspects for the accurate setting of the insulin adjusting point. Finally, some new concepts and postulates are addressed in our trial, such as the late postprandial hyperglycemia, that could contribute to modern therapy, as well as the newly defined FPU, which could be visibly posted on all commercial food packaging, enabling the quick approximation and the proper meal insulin adjusting of the insulin pump gauge by its user.
Footnotes
Acknowledgments
We would like to extend our gratitude and thanks to Dr. Marianna Bąk for laboratory support. This study was supported financially by the Medical University of Warsaw. The creation and submission of the manuscript was supported by Novo Nordisk Poland.
Author Disclosure Statement
No competing financial interests exist.