
Abstract
Background:
Prediction of glycemic profile is an important task for both early recognition of hypoglycemia and enhancement of the control algorithms for optimization of insulin infusion rate. Adaptive models for glucose prediction and recognition of hypoglycemia based on statistical and artificial intelligence techniques are presented.
Methods:
We compared an autoregressive (AR) model using only glucose information, an AR model with external insulin input (ARX), and an artificial neural network (ANN) using both glucose and insulin information. Online adaptive models were used to account for the intra- and inter-subject variability of the population with diabetes. The evaluation of the predictive ability included prediction horizons (PHs) of 30 min and 45 min.
Results:
The AR model presented root mean square error (RMSE) values of 14.0–21.6 mg/dL and correlation coefficients (CCs) of 0.92–0.95 for PH=30 min and 23.2–35.9 mg/dL and 0.79–0.87, respectively, for PH=45 min. The respective values for the ARX models were slightly better (PH=30 min, 13.3–18.8 mg/dL and 0.94–0.96; PH=45 min, 22.8–29.4 mg/dL and 0.83–0.88). For the ANN, the RMSE values ranged from 2.8 to 6.3 mg/dL, and the CC was 0.99 for all cases and PHs. The sensitivity of hypoglycemia prediction was 78% for AR, 81% for ARX, and 96% for ANN for PH=30 min and 65%, 67%, and 95%, respectively, for PH=45 min. The corresponding specificities were 96%, 96%, and 99% for PH=30 min and 93%, 93%, and 99% for PH=45 min.
Conclusions:
The ANN appears to be more appropriate for the prediction of glucose profile based on glucose and insulin data.
Introduction
Glucose prediction models can be classified in different ways (e.g., compartmental vs. data-driven). 3 In recent years, the focus has been on the development of data-driven models because of their simpler structure, ability to process significant amount of data in real time, and ease of personalization. The majority of proposed methods have been based on autoregressive (AR) or AR moving average (ARMA) models and more recently on artificial neural networks (ANNs). ARMA models compute current values as a linear combination of past values and past prediction errors. Several versions exist where additional inputs can also be taken into account (AR model with external insulin input [ARX]). ANNs, on the other hand, are nonlinear models that have been successfully applied in complex, nonlinear problems.
Although AR and ARMA models are linear, they are used for glucose prediction because of their simple structure and relatively comprehensive behavior. Sparacino et al. 4 have investigated the ability to predict the glucose profile based on CGM time series by developing simple linear and first-order AR models with time-varying parameters. As a continuation of this work, Zanderigo et al. 5 evaluated those models using continuous glucose error grid analysis (CG-EGA), showing that their performance is similar, yet the AR model is more efficient in hypoglycemia prediction. Eren-Oruklu et al. 6 have developed adaptive ARMA models using CGM data from healthy and type 2 diabetes patients where parameter adjustment was based on the recursive least squares (RECLS) algorithm integrated with a change-detection method. The model resulted in average relative absolute deviation (RAD) values of 2.6% and 3.7% for healthy and diabetes patients and a prediction horizon (PH) of 30 min. In a more recent study, this group tested the ability of this method to provide early hypoglycemic alarms 7 and reduce false alarms, thus achieving increased specificity. Gani et al. 8 have developed an AR model using three approaches: (1) raw data and ordinary least squares; (2) smoothed data and ordinary least squares; and (3) smoothed data and regularized least squares (REGLS). The third approach proved the best with a root mean square error (RMSE) of 1.8 mg/dL and no time lag (TL) for PH=30 min and an RMSE of 14.4 mg/dL and TL of 12 min for PH=60 min. In further studies, the group claimed that the AR model can be used for all patients, based on assessment of the algorithm on testing sets derived from different patients and different CGMs. 9 Their results show RMSEs of about 3.6 mg/dL and TLs of 0.3 min for PH=30 min. Finan et al. 10 have proposed ARX models using information on past glucose, insulin, and carbohydrates (CHOs) consumed. Batch and recursive methods of identification were examined, and the models were assessed under normal conditions and conditions of reduced insulin sensitivity. Both approaches resulted in RMSEs of about 26, 45, and 60 mg/dL for PH of 30, 45, and 60 min, respectively.
Depending on their architecture, ANNs are mainly classified into feed-forward and feedback or recurrent ANNs. Feed-forward types have no feedback loops, whereas with the feedback or recurrent types the information can travel to both directions. ANNs have been applied to glucose prediction because of their intrinsic ability to model highly nonlinear and complex dynamics. Feed-forward ANNs are mainly used because of their simpler structure. A time-lagged feed-forward ANN trained with back propagation was proposed by Pappada et al. 11 The ANN, apart from subcutaneous glucose values, used information related to blood glucose levels, insulin dosage, nutritional intake, lifestyle, and emotional states. Despite efficient prediction of euglycemia and hyperglycemia, hypoglycemia tended to be overestimated. An improved version of the ANN has recently been proposed by the same group. 12 A further feed-forward ANN was presented by Perez-Gandia et al. 13 trained with the back propagation Levenberg–Marquardt algorithm. Present and past glucose samples from a CGM system were applied as inputs to the ANN. The RMSE was about 10, 18, and 27 mg/dL for PHs of 15, 30, and 45 min, respectively, and the corresponding TLs were about 4, 12, and 20 min. Feedback ANNs have also been proposed in combination with compartmental models, either for control 14,15 or for glucose prediction based on CGM, multiple daily insulin injection schemes, and food data. In all cases they outperformed the feed-forward ANNs. 16
Despite the advances made in this area, there are still open issues: (1) the influence of insulin has not been studied systematically; (2) the absence of a common database for the evaluation of the developed prediction models implies that they cannot be assessed objectively; (3) only one study has been published comparing a feed-forward ANN and an AR model for glucose prediction where much more simplified AR and ANN architectures were used; 13 and (4) online personalization of the models (online adaptive models) to account for inter- and intra-subject variability has not been studied extensively.
The findings presented here focus on the development and comparative assessment of adaptive data-driven models for glucose prediction using CGM and insulin pump data. The models are based on AR and ANN algorithms, with emphasis on their ability to be personalized to account for inter- and intra-subject variability.
Subjects and Methods
Virtual population of diabetes patients
We used glucose and insulin data of 8 days derived from a virtual population of 30 diabetes patients (10 adults, 10 adolescents, and 10 children) to ensure the reproducibility of the training (identification) and evaluation (with data not used during training) results. A virtual population, a simulated sensor that replicates the typical errors of continuous glucose monitoring, and a simulated insulin pump are included in the educational version of the Food and Drug Administration–accepted University of Virginia simulator 17 used in this study. The glucose and insulin data were estimated by the simulator under an appropriate meal scenario and insulin infusion scheme.
Meal scenario
The meal scenario consisted of four kinds of meals: breakfast, lunch, dinner, and snack. In order to simulate the daily variation in terms of meal quantity and timing, the meal scenario per day was created in a randomized way as follows: each meal kind was assigned a range of possible quantities of grams of CHO and a range of timings as • Breakfast: [30–60] g of CHO at [07:00–11:00] • Lunch: [70–100] g of CHO at [13:00–16:00] • Dinner: [70–110] g of CHO at [20:00–22:00] • Snack: [20–40] g of CHO at [23:00–00:00]
The accurate amount of grams of CHO and the timing for each meal and each trial day were chosen randomly from the respective ranges. As a second step, several dinners and snacks were omitted in order to represent the common case of missing these meals. The missed meals were randomly distributed within the trial days. The average duration of each meal was considered 15 min.
Insulin infusion scheme
The insulin infusion followed a basal–bolus scheme, with constant basal rate and bolus size based on an insulin:CHO ratio. In order to achieve sufficient glucose fluctuations and extreme values for the representative evaluation of the models' performance, the basal rate and bolus ratio were personalized to each patient.
The glucose variability in terms of mean (SD) glucose value and coefficient of variation increased with decreasing age group: adults, 132.1 (49.9) mg/dL and 37.2%; adolescents, 130.2 (51.6) mg/dL and 39.6%; and children, 142.5 (61.49) mg/dL and 41.9%, respectively.
Online adaptive AR/ARX models
Present glucose values can be estimated as linear combinations of past samples using AR models or past glucose and insulin samples using ARX models described by the following equations:
where k, s, and f are the model orders describing the range of past glucose and insulin values, ai and bj are the model parameters, and ɛ(t) is the one-step prediction error.
During training, the models are identified by selection of the orders and the parameter vectors that best fit the actual to the one-step-ahead predicted time series samples. First, the model order was chosen based on the minimization of the minimum description length criterion. For the intermediate parameter estimation during the investigation of the models' order, the REGLS 8 and the Tikhonov regularization approach 18 was used as presented in the Appendix. Once the optimal order was specified, the final parameter set was estimated using the covariance matrix approximation evolution strategy (CMA-ES). 19 Comparative assessment of the REGLS and the CMA-ES methods for the parameter identification has shown superiority of the latter, especially in the case of hypoglycemia prediction.
During evaluation, the models proceeded to a continuous adaptation of their parameters based on the RECLS algorithm. More details are presented in the Appendix. It should be noted that the initial RECLS parameter vector was set to the optimal parameter value estimated during training.
Online adaptive ANN-based models
Glucose regulation can be considered as a dynamic system, where the glucose level is the state variable and the insulin infusion rate is the external input. The general mathematical description is:
where
where y(t+1) and y(t) are the next and current glucose values predicted by the model, and F(y(t), u(t)) refers to the nonlinear function implemented by the ANN used. The ANN used is a fully connected, multilayered ANN with two feedback loops. It consists of one input layer with one external input corresponding to the last insulin infusion value, a variable number of hidden layers and neurons per layer, and an output layer with one neuron. The feedback loops are formed by the one-to-one connection from the network output to the state variable (glucose) and the feedback of the state variable into itself. The hyperbolic sigmoid and linear were used as transfer functions in the hidden and output layer, respectively. Before being fed into the ANN, the glucose and insulin input values were normalized in the range [−1.0, 1.0]. The state variable was initialized as the first glucose value available, and the ANN's weight matrices were assigned to random values in the range [−0.5, +0.5]. Because of the need for individualized (online adaptive) models, a real-time training algorithm of behaviors of indefinite duration was required. To this end, a teacher-forced, real-time, recurrent learning algorithm was used to train the ANN. 20 During training, the weights were online-updated for every new input of the ANN. In the teacher-forced version of the algorithm, replacement of predicted values with real values—if they are available—permits more efficient computation of the future activity of the ANN. Finally, the number of hidden layers and neurons was determined after trial-and-error processing during the ANN training based on minimization of the RMSE. The computational cost of the followed approach was considerably lower than traditional back-propagation through time-learning algorithms because the ANN does not need full access to the training set during the training phase and calculates the error function recursively. 21,22
Training and evaluation
The glucose and insulin data from the first 4 days per patient were used for training, whereas the remaining data were used for evaluation. The ability of the models to predict glucose at PHs of 30 and 45 min was assessed using the RMSE (in mg/dL), TL (in min), correlation coefficient (CC), and RAD. Performance was also evaluated using the CG-EGA. 23 The thresholds were set to ≤70 mg/dL for hypoglycemia and ≥180 mg/dL for hyperglycemia. The performance of the models during hypoglycemic events was also investigated by calculating the sensitivity and specificity (in %). 7
Results
This section presents the results of the three models. Figure 1A shows the actual glucose levels from one representative in silico adult patient and the 30-min-ahead glucose profiles predicted by the AR, ARX, and ANN models, and Figure 1B shows the corresponding 45-min-ahead predicted profiles. All profiles were estimated based on the data used for evaluation, and all models appear to be able to reflect the real glucose profile.
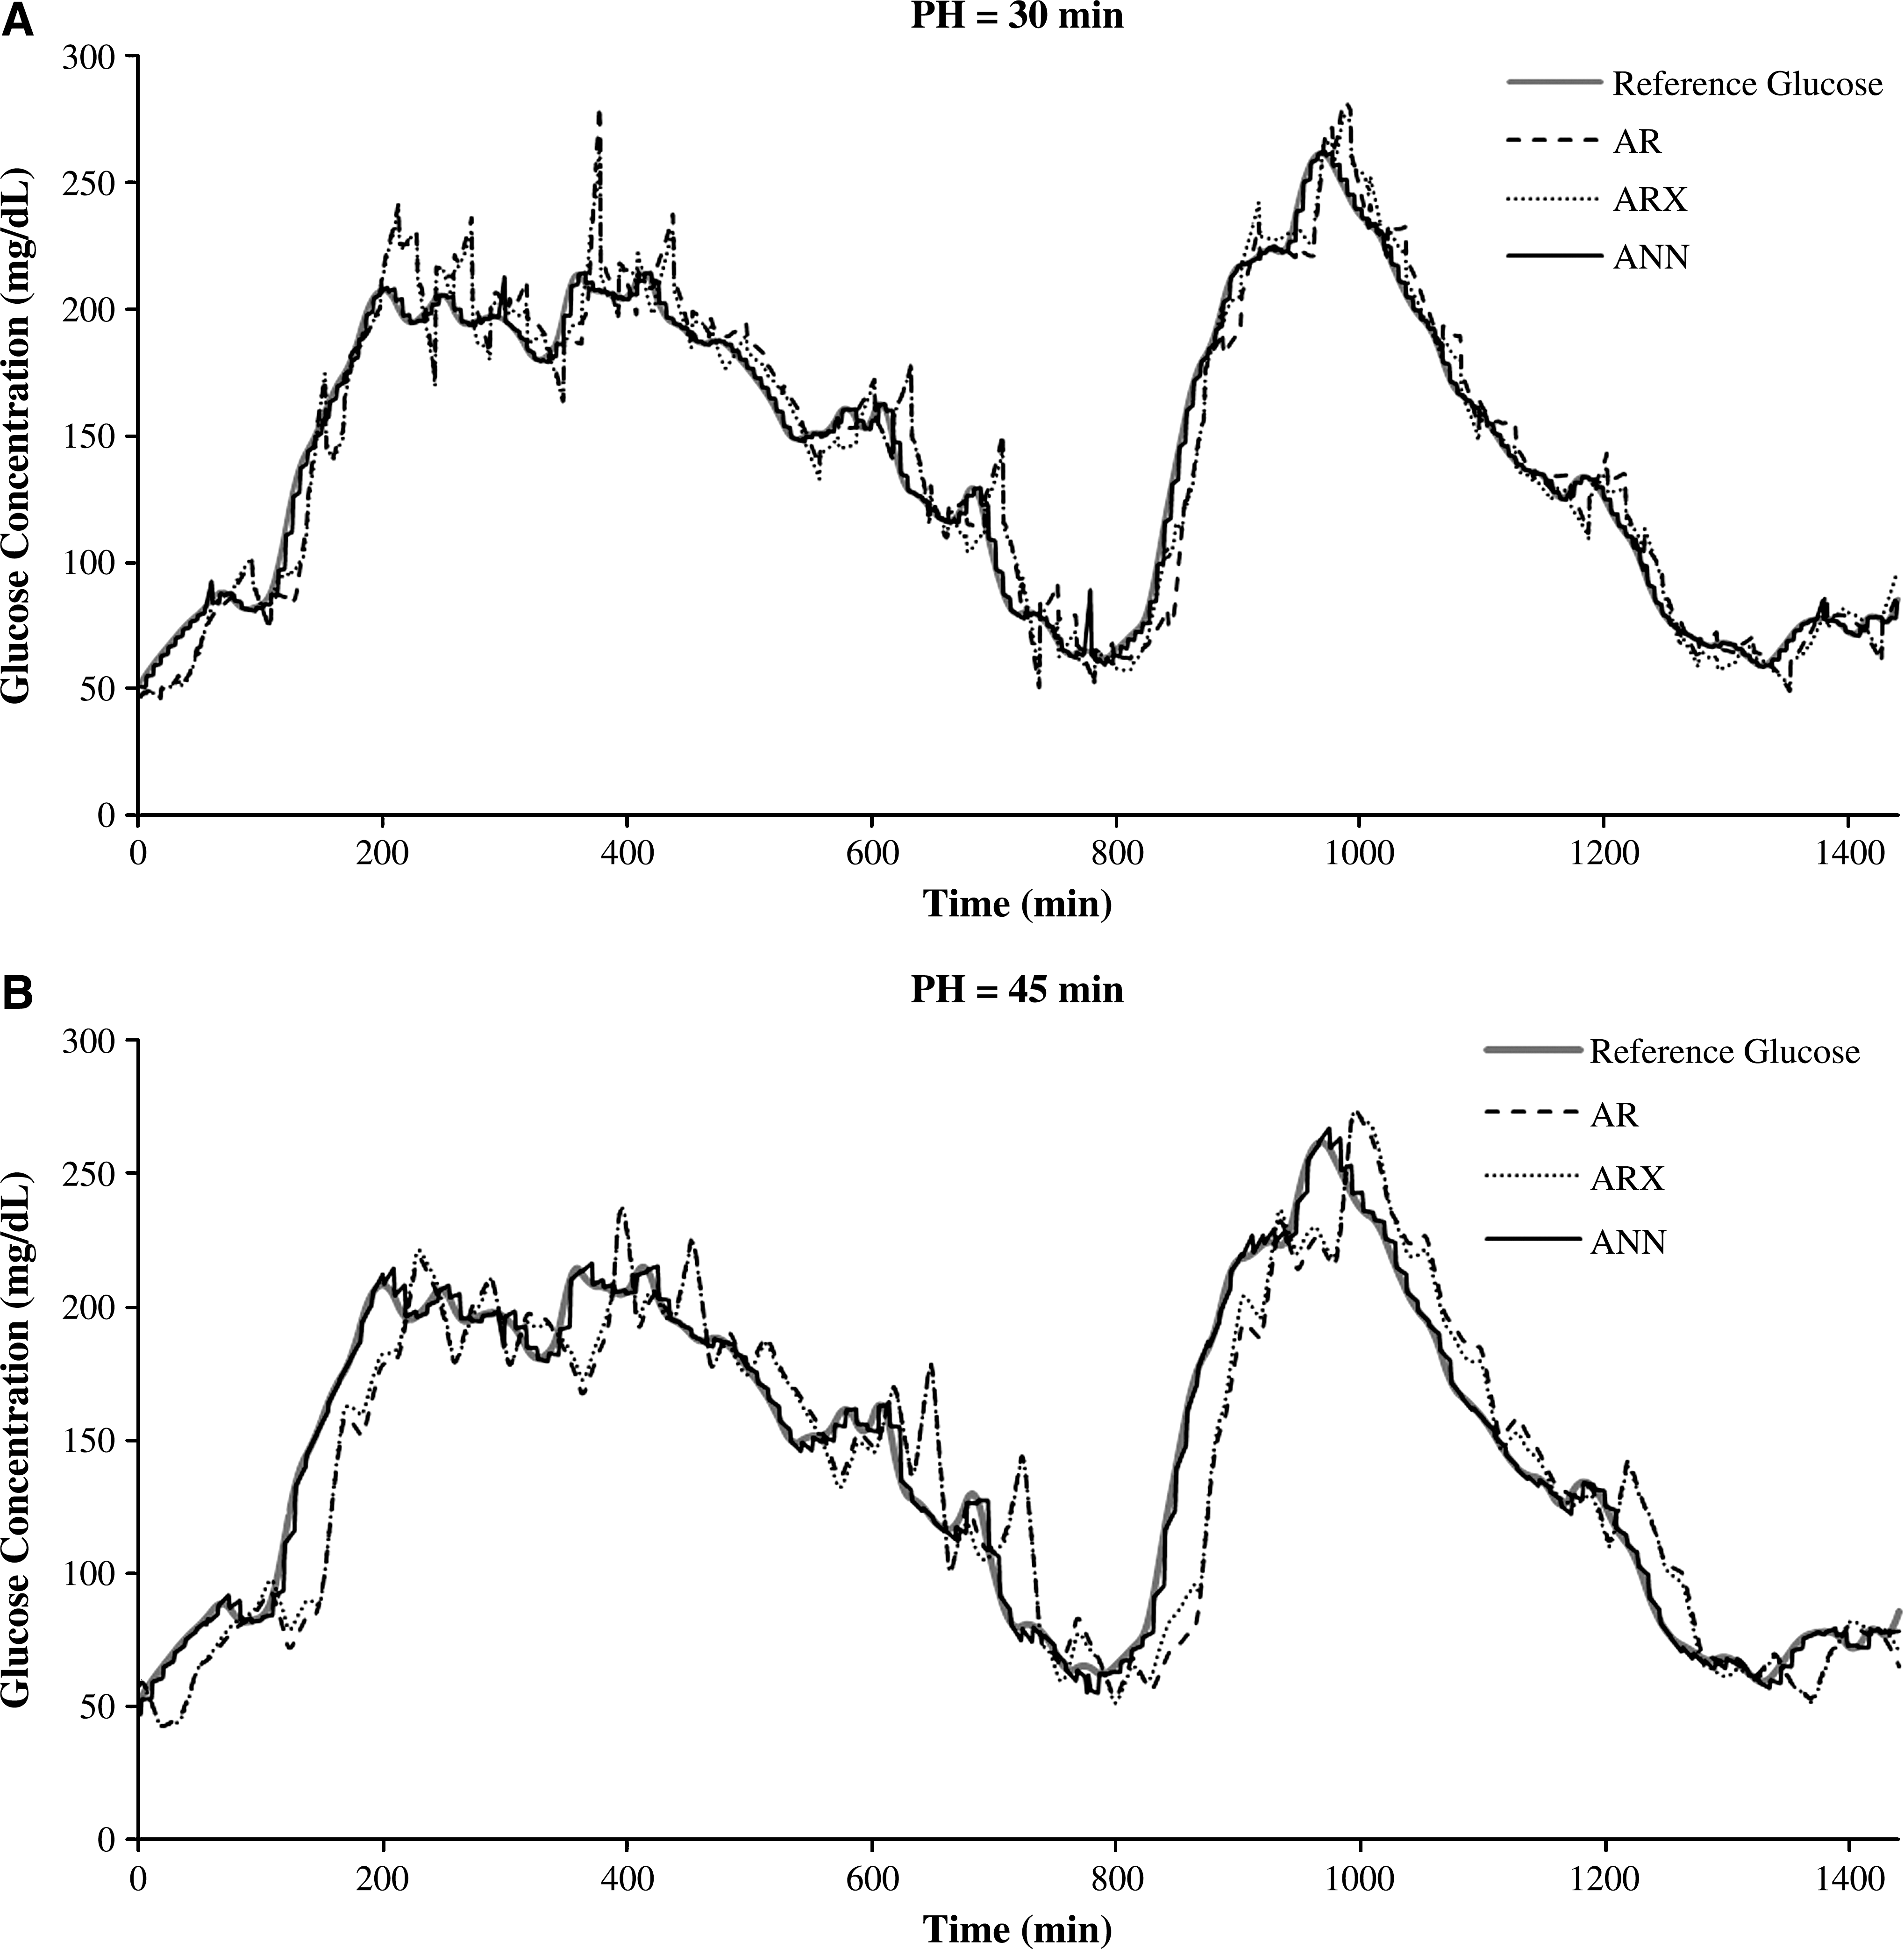
Reference (red) and predicted glucose concentration of online adaptive autoregressive (AR) models (black), autoregressive models with external insulin input (ARX) (dotted), and artificial neural network (ANN) models (dashed) for an in silico adult patient with a prediction horizon (PH) of (
Online adaptive AR models
Thirty subject-specific AR models—one for each patient—were identified during the training period. For the Tikhonov regularization, U was the design matrix containing the appropriate past glucose and insulin values for each time step of the training set. The regularization parameter was chosen as λ=0.2, where, by trial and error, this value was observed to give better results, balancing the minimization of the prediction error and the smoothness of the model parameters. L was selected as a second derivative operator. For the CMA-ES optimization, the initial coordinate-wise SD was chosen by trial and error as σ 0=0.007. The TL, RMSE, CC, and RAD values for the AR models are presented in Table 1A as mean values and SDs for the three groups of patients. The results in Table 1A show that the performance of the model deteriorates with the increase in PH: TL, +162% to +258%; RMSE, +66% to +77%; CC, −8.4% to −14.8%; and RAD, +65% to +74%. The change in performance is more significant in younger age groups, indicating higher sensitivity of the AR models when more complex data with higher variability are considered. CG-EGA demonstrates that more than 76% of the predictions for PH=30 min and more than 61% for PH=45 min were accurate. In the hypoglycemic range, clinically accurate predictions were achieved for PH=30 min for 82% of the estimates in adults, 78% in adolescents, and 76% in children. The corresponding values for PH=45 min were 70%, 70%, and 61%, respectively. Furthermore, the average sensitivity and specificity of the AR models for the prediction of hypoglycemia were 78% and 96%, respectively, for PH=30 min; lower values were found for PH=45 min (sensitivity, 65%; specificity, 93%).
ANN, artificial neural network; AR, autoregressive; ARX, autoregressive model with external insulin input; CC, correlation coefficient; RAD, relative absolute deviation; RMSE, root mean square error; TL, time lag.
Online adaptive ARX models
The same identification procedure was used as for AR models. The parameter s was chosen to be equal to 45 (maximum PH) to enable only insulin information already provided to be used. This did not influence the model's accuracy because the PHs investigated were short, and the maximum action of the insulin analogs takes place between 30 and 120 min after infusion. The performance of the ARX model is shown in Table 1B. The change in ARX performance in response to the PH increase was similar to the AR model's (TL from +185% to +335%, RMSE from +56% to +79%, CC from −8.4% to −11.5%, and RAD from +65% to +74%) with deteriorating performance in younger groups with more complex data. CG-EGA showed more than 76% of the predictions to be accurate for PH=30 min and 64% for PH=45 min. In the hypoglycemic range, the percentage of clinically accurate predictions for PH=30 min was 81% in adults, 80% in adolescents, and 76% in children. The corresponding PH=45 min values were 70%, 72%, and 64%. ARX models presented increased average sensitivity to hypoglycemia prediction compared with AR models (PH=30 min, 81%; PH=45 min, 67%), whereas the average specificity remained the same (PH=30 min, 96%; PH=45 min, 93%).
Online adaptive ANN-based models
As for the AR models, 30 patient-specific models were identified during the training period. The ANN provided very efficient predictions for all patients and PHs with almost zero TL and significantly high correlations (Table 1C). As expected, the performance decreased as the PH increased, with changes in TL from +71% to +100%, RMSE from +40% to +42%, and RAD from +39% to +45%; the CC was 0.99 in all cases. According to the CG-EGA, more than 89% of the predictions were clinically accurate for all the patients and PHs. In the hypoglycemic range, 93–94% of the predictions were clinically accurate for all patients and PHs. This is in line with the high values for sensitivity and specificity for the prediction of hypoglycemia (PH=30 min, sensitivity 96%, specificity 99%; PH=45 min, sensitivity 95%, specificity 99%). The above results indicate that the nonlinear architecture of the ANN allows for an accurate and universal approach to total glucose range prediction.
Discussion
The comparative assessment of the two recursive linear models reveals a general superiority of the ARX models underlining the importance of additional information. Particularly in the case of children, there is a significant improvement in the prediction performance when ARX models are used, a fact suggesting that more complex data sets require more complex models for a sufficient representation of their dynamics. In the case of simpler data series (as in adults) the performance of the two models is similar, implying that additional information is not always necessary or even positive because it may introduce unneeded complexity and computational burdens and should be considered according to the respective data set.
The ANN outperformed the recursive linear models, with more accurate predictions for all patients and for both PHs. The decrease in performance with an increasing PH was about half of that observed with the recursive models, showing that the ANN is more robust. Furthermore, the ANN is able to handle the more complex data of adolescents and children with equal efficiency, whereas a significant deterioration in performance was seen for these age groups with the recursive models. With regard to the prediction of hypoglycemia, the ANN model was better than both AR and ARX models in terms of CG-EGA in hypoglycemic range, sensitivity, and specificity for both PHs.
Conclusions
Three types of online adaptive models were developed and compared to evaluate their efficiency in near-future glucose prediction. The performance of AR models with and without external input revealed the significance of using additional information in data modeling. Complex data sets require more detailed models for the representation of their dynamics, whereas in simpler cases the additional inputs can impose unneeded complexity. The ANN produced very accurate glucose predictions, indicating that nonlinear approaches seem to be more appropriate for glucose time-series predictions. Evaluations using real patient data will assist in drawing firmer conclusions on the superiority of one model over others.
Appendix
Tikhonov regularization approach
Tikhonov regularization approach is used for the approximation of a stable solution to a minimization problem with ill-posed characteristics. The general solution is given by the following equation:
where θ is the AR (or ARX) parameter vector, y is the glucose time series, U is the design matrix, λ is the regularization parameter, L is a well-conditioned matrix to impose smoothness on the parameters, and θ* is the optimal parameter vector.
Recursive least squares algorithm
For the presented AR/ARX models the parameters are adapted in real-time based on the RECLS algorithm, which is described by the following equations:
where
Footnotes
Author Disclosure Statement
No competing financial interests exist.