
Abstract
Background:
Coinjection of hyaluronidase has been shown to accelerate insulin absorption in healthy volunteers and patients with type 1 diabetes mellitus. This study was undertaken to compare the postprandial glycemic response of patients with type 2 diabetes mellitus (T2DM) administered insulin lispro with and without recombinant human hyaluronidase (rHuPH20) and regular human insulin (RHI) with rHuPH20.
Methods:
This double-blind three-way crossover study compared the insulin pharmacokinetics and glucodynamic response to a standardized liquid meal (80 g of carbohydrate) in 21 patients with T2DM who received subcutaneous injections of individually optimized doses of lispro±rHuPH20 and RHI+rHuPH20. The optimum dose (targeting postprandial glucose [PPG] of 70–140 mg/dL) of each preparation was selected by the investigator following a fixed-dose escalation procedure in three dose-finding meals.
Results:
Co-injection of lispro+rHuPH20 accelerated pharmacokinetics relative to lispro alone (time to peak insulin concentration, 43 vs. 74 min; P=0.0045) with increased exposure in the first hour (184% of control; P<0.0001) and reduced exposure after 2 h (67% of control; P=0.0001). These accelerated pharmacokinetics improved both total hyperglycemic excursions (area under the curve for 0–4 h >140 mg/dL, 56% of control; P=0.048) and hypoglycemic excursions (area under the curve for 0–8 h <70 mg/dL, 34% of control; P=0.033), allowing over three times as many patients to reach the American Diabetes Association's target of peak PPG <180 mg/dL without requiring glucose treatment for hypoglycemia. The mean optimum dose of lispro was reduced 8% from 0.275 U/kg without rHuPH20 to 0.254 U/kg with rHuPH20 (P=0.04). RHI+rHuPH20 had responses and optimum doses comparable to insulin lispro alone. All insulin preparations were well tolerated.
Conclusions:
Lispro+rHuPH20 provided superior control of glycemic excursion compared with lispro alone, with lower insulin requirements and reduced hypoglycemic excursions.
Introduction
The extracellular space in SC tissue provides a barrier to bulk fluid flow because hyaluronan, a high-molecular-weight glycosaminoglycan, binds free water molecules and provides a high-viscosity gel-like matrix. 19 –21 As a result, when insulin formulations are injected into the SC space, the injected insulin–zinc complexes are caught in a local depot, with impeded access to capillary beds and high concentrations retarding dissociation to capillary-permeable insulin monomers and dimers. 10 –22 Hyaluronidases have a long history of clinical use, increasing the dispersion and absorption of subcutaneously administered drugs, which is accomplished by depolymerizing the hyaluronan and transiently enabling dispersion via bulk fluid flow within the local tissue rather than by the slower diffusion-mediated process when the hyaluronan matrix is intact. 23 –27 Results from recently conducted studies in healthy volunteers and patients with type 1 diabetes mellitus have demonstrated that addition of recombinant human hyaluronidase (rHuPH20) to insulin products accelerates the pharmacokinetics (PK) of subcutaneously injected insulin, approximately doubling the insulin exposure in the first hour and halving the insulin exposure beyond 2 h relative to the insulin product alone. 28 –30 These accelerated insulin PK are accompanied by a corresponding acceleration of insulin action (glucose required to maintain euglycemia in glucose clamp experiments) with an earlier onset and shorter duration of insulin action.
The primary objective of the present study was to compare blood glucose (BG) concentrations as a function of time after a standardized test meal in patients with T2DM treated with individually dose-optimized amounts of prandial insulin products either alone (lispro) or co-injected with rHuPH20 (lispro and RHI).
Subjects and Methods
This Phase 2, randomized, double-blind, crossover study was conducted in patients with T2DM (18–70 years old) being treated with ≥60 U of insulin/day. Other inclusion criteria included a body mass index of 18–45 kg/m2, A1C ≤10%, and treatment with insulin for ≥12 months. All patients provided written informed consent to participate in the trial, which was conducted with institutional review board approval.
The investigational insulin preparations were prepared by diluting either Humalog® or Humulin® R (both from Eli Lilly, Indianapolis, IN) insulin lispro to 95 U/mL with rHuPH20 (100 μg of rHuPH20/mL; 12,000 U/mL) for a final rHuPH20 concentration of 5 μg/mL. The active comparator for this study was insulin lispro (Humalog), which was diluted to 95 U/mL with sterile diluent (Eli Lilly). All study drugs were injected subcutaneously in the abdominal wall, alternating between the left and right side. The sequence of study drugs was randomly assigned.
For the test meal, a standardized liquid meal (16 oz of standard formula Ensure® [Abbott Laboratories, Abbott Park, IL], containing 80 g of carbohydrate) was consumed immediately (within 5 min) following study drug administration. Three dose-finding visits were conducted during which escalating doses (0.1, 0.15, and 0.225 U/kg) of an insulin preparation were administered. Postmeal glucose values were collected for 6 h during these dose-finding visits. Dose escalation was aborted if a patient experienced a hypoglycemic event requiring intravenous glucose administration for treatment (at the investigator's discretion, generally for BG <60 mg/dL or symptomatic hypoglycemia) during the low- or intermediate-dosing visits. Following all dose-finding visits for each study drug the investigator chose a dose intended to result in optimal glycemic control for an additional test meal session. The optimum dose was chosen as either the minimum dose required to produce a 4-h peak PPG of <140 mg/dL without hypoglycemia (BG ≥70 mg/dL) or the maximum dose tolerated without hypoglycemia. The sequence of the three study drugs was randomized, and both the investigator and the patients were blinded to study drug identity.
Patients reported to the research institute on the morning of each study day after having withheld prandial insulin for at least 9 h and basal insulin therapy for at least 24 h (36 h for insulin glargine). BG levels were stabilized with intravenous insulin or glucose infusion within a range of 90–130 mg/dL for approximately 3 h during the baseline period. There were no interventions in the final 30-min period immediately preceding study drug injection. Blood samples were collected on each study day at 30, 20, 10, and within 5 min before, at 3, 6, 9, 12, 15, 20, 25, 30, 45, 60, 75, 90, 120, 150, 180, 210, 240, 300, and 360 min after, and for the optimum dose visit additionally at 420 and 480 min after injection of each study drug. For the measurement of serum insulin (optimum visit only) samples were prepared, shipped, and assayed using a standard radioimmunoassay validated for both RHI and lispro (Millipore, St. Charles, MO). BG levels were determined using a YSI STAT2300 glucose analyzer (YSI Inc., Yellow Springs, OH).
Efficacy outcomes were determined for patients who completed all study treatments (n=21). The safety population included all patients exposed to any study drug (n=23). PK parameters were assessed using baseline-subtracted serum insulin data subjected to noncompartmental analyses (Model 200) using WinNonlin version 5.2 (Pharsight, Cary, NC). Comparisons of PK and pharmacodynamics data were performed using a repeated-measures analysis of variance to control for the crossover design. No adjustments were made for multiple statistical tests. Temporal outcome and fractional exposure data are presented as arithmetic means, and peak insulin concentration (C max) and area under the curve (AUC)last are presented as geometric means.
Results
The baseline demographics and disposition of the patients enrolled in this study are described in Table 1.
Data are n (percentage) or mean (SD).
Baseline values are from all 23 patients.
BMI, body mass index.
Optimization of insulin dose
Eighteen patients completed all scheduled dose escalations for each insulin preparation, whereas three patients were limited by hypoglycemia at the first or second visit for one or more study drugs (and received investigator-selected doses for their remaining dose-finding visits for those study drugs). Following all dose-finding visits for each study drug the investigator chose a dose intended to result in optimal glycemic control. The mean optimum dose was 0.275±0.075 U/kg (27.3 U; range, 11–39 U) for lispro alone, 0.254±0.072 U/kg (25.2 U; range, 9–39 U) for lispro+rHuPH20, and 0.288±0.070 U/kg (28.7 U; range, 8–43 U) for RHI+rHuPH20. The mean optimum dose of lispro+rHuPH20 was significantly but modestly less than either lispro alone (−7.7%, P=0.041) or RHI+rHuPH20 (−12.2%, P=0.0013). The optimum doses of lispro alone and RHI+rHuPH20 were comparable (P=0.19). The optimum doses were higher for the 18 patients who completed all scheduled dose escalations (30.0, 27.4, and 31.1 U for lispro alone, lispro+rHuPH20, and RHI+rHuPH20, respectively), with the optimum dose for lispro+rHuPH20 again significantly less (−8.7%, P=0.014) than lispro alone or RHI+rHuPH20 (−11.9%, P=0.0008).
Glucose response
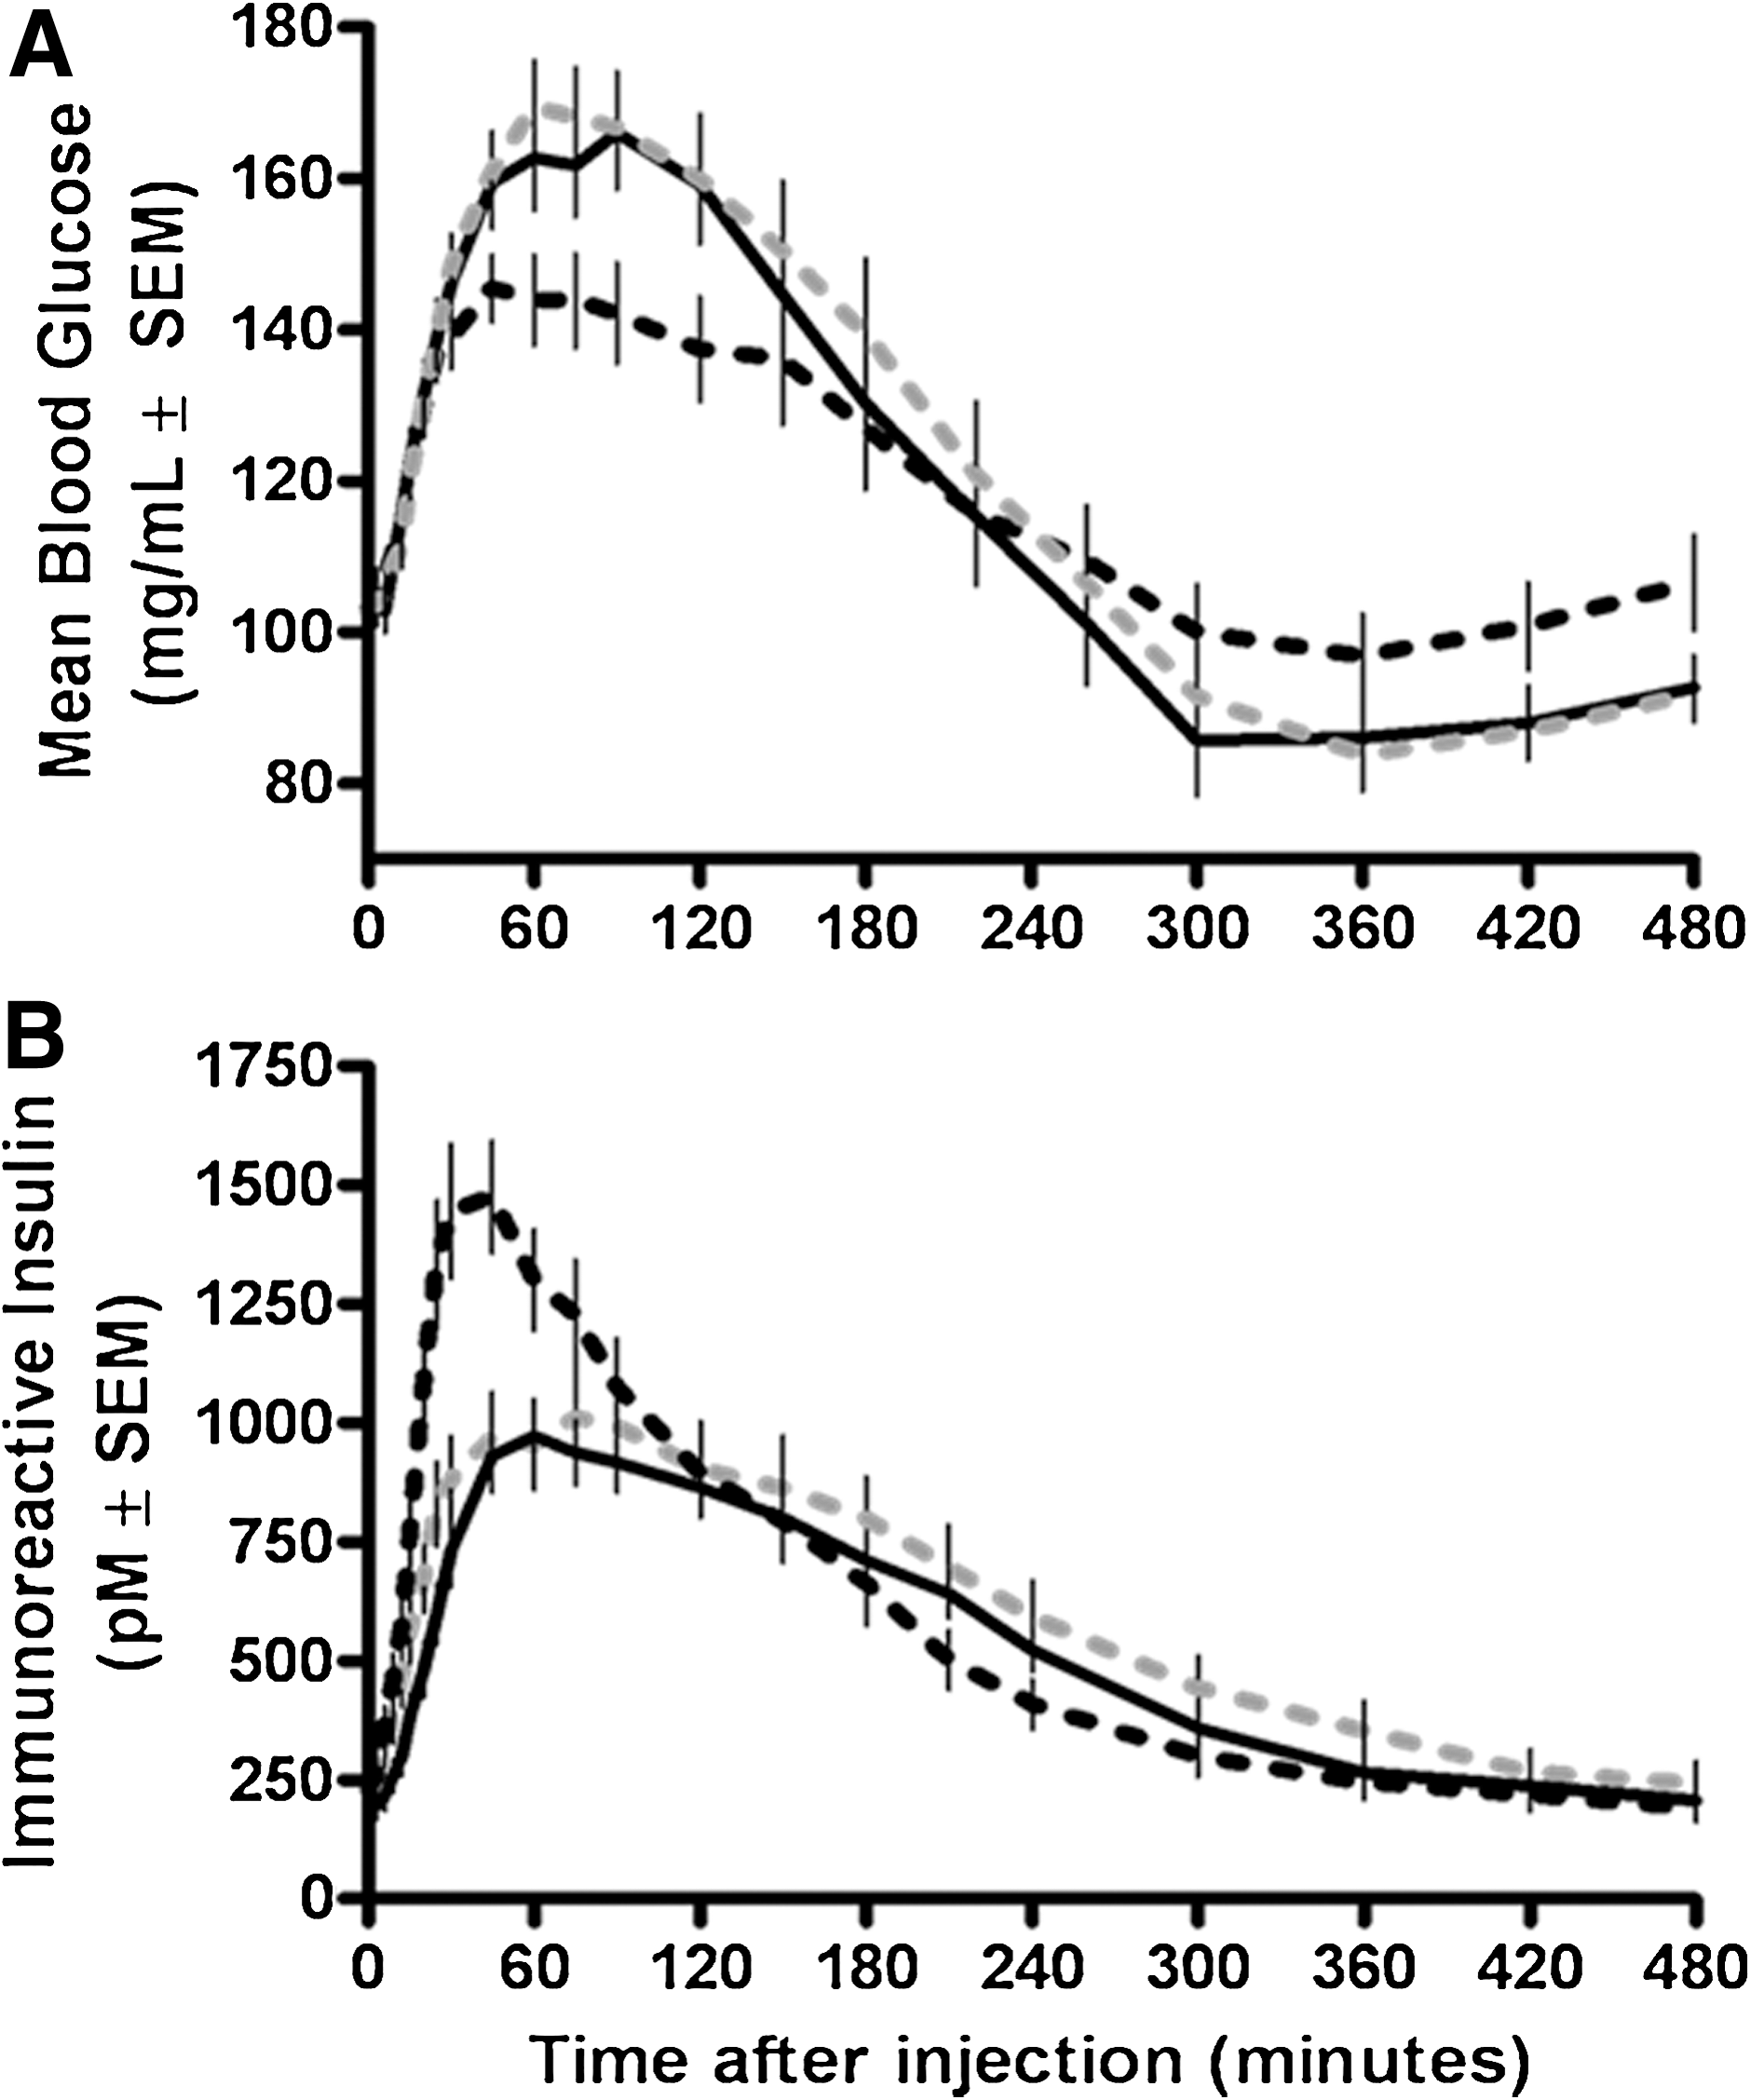
Mean glycemic response curves following the optimum dose meal challenges are shown in Figure 1A. Patients treated with lispro alone were generally unable to achieve optimum PPG control. No patients satisfied the stringent protocol-specified target (PPG between 70 and 140 mg/dL), and only three of 21 patients (14%) satisfied the ADA target of a peak PPG <180 mg/dL without requiring glucose to treat hypoglycemia. When the same patients were treated with RHI+rHuPH20, the results were slightly better, with one patient (5%) satisfying the protocol target and five patients (24%) satisfying the ADA target without requiring glucose administration. With lispro+rHuPH20 more patients were able to achieve adequate glycemic control, with two (10%) meeting the stringent protocol target and 10 (48%) meeting the ADA target without the need for glucose rescue. Thus for composite end points of controlling postprandial hyperglycemia without hypoglycemia, lispro+rHuPH20 provided superior control relative to lispro alone.
(
Co-administration of lispro with rHuPH20 also reduced hyperglycemic excursions relative to lispro alone independent of glucose rescue (Table 2). PPG excursions from the premeal baseline level were reduced by 39% (P=0.0098), 37% (P=0.0017), and 32% (P=0.0014) at 120, 90, and 60 min, respectively. The area of hyperglycemic excursion (AUC0–4h>140mg/dL) was decreased 44% for lispro+rHuPH20 compared with lispro alone (P=0.048). More patients met the ADA target of peak PPG <180 mg/dL after injection of lispro+rHuPH20 (15 of 21; 71%) than after injection of lispro alone (10 of 21; 48%). Results for RHI+rHuPH20 were comparable to those for insulin lispro alone (Table 2).
Significance of the difference (P value) from control was based on an analysis of variance mixed model with a fixed effect for study drug and compound symmetric covariance matrix among repeated measurements.
Hyperglycemia parameters were measured during the first 4 h following study drug administration and meal ingestion.
Calculated based on the excursion from premeal baseline.
Peak postprandial glucose (PPG) <180 mg/dL.
Hypoglycemia was defined as any blood glucose (BG) <70 mg/dL or symptoms of hypoglycemia responding to treatment with glucose.
Treated at the discretion of the investigator (blinded to study drug identity), generally for BG <60 mg/dL or symptoms of hypoglycemia.
ADA, American Diabetes Association; NA, not applicable; RHI, regular human insulin; rHuPH20, recombinant human hyaluronidase.
Lispro+rHuPH20 also reduced the incidence and extent of hypoglycemia compared with lispro alone (Table 2); fewer patients (four of 21 [19%]; P=0.0023) required glucose administration to treat hypoglycemia (glucose given per investigator discretion, generally for BG <60 mg/dL and/or symptoms) compared with 10 (48%) for insulin lispro alone. Similarly, fewer patients (six of 21 [29%]; P=0.03) with lispro+rHuPH20 experienced any hypoglycemia (BG <70 mg/dL with or without symptoms) relative to for lispro alone (12 [57%]). Despite the lower incidence of glucose administration for lispro+rHuPH20, the total area of hypoglycemic excursion AUC<70mg/dL was decreased by 66% (P=0.033), and the mean BG minimum was higher (P=0.016) at 89 mg/mL for lispro+rHuPH20 compared with lispro alone (76 mg/dL). Results for RHI+rHuPH20 were comparable to those for lispro alone (Table 2).
Insulin PK
Serum insulin concentrations observed in this study were derived both from the exogenously applied insulin formulations and from any contributions of the patients' own insulin response to the liquid meal (C-peptide was not measured). Mean immunoreactive insulin concentrations obtained following optimum dose meal challenges are shown in Figure 1B. Geometric mean total insulin exposure (AUClast) was 15% greater for lispro+rHuPH20 than for lispro alone (P=0.010), whereas total exposure was comparable for RHI+rHuPH20 and lispro alone (Table 3). Exposure had a faster onset and shorter duration for lispro+rHuPH20 than for lispro alone, resulting in approximately twice the exposure (32% vs. 17% of total exposure; P<0.0001) in the first hour after injection and almost half the exposure beyond 2 h (37 vs. 55% of total exposure, P<0.0001). Early time to reach half of the maximum exposure was 19 min for lispro with rHuPH20, compared with 27 min for lispro alone (P<0.0001). The time to 10% exposure was similarly reduced, from 46 min for lispro alone to 31 min for lispro with rHuPH20 (P<0.0001). The duration of exposure (last mean residence time) was also reduced for lispro+rHuPH20 compared with lispro alone (108 vs. 149 min, P<0.0001). The timing of insulin exposure was generally comparable for RHI+rHuPH20 and lispro alone, although the onset of exposure was slightly faster, and very early exposure (in the first 15 min after injection) was slightly greater for RHI+rHuPH20.
Significance of the difference (P value) from control was based on an analysis of variance mixed model with a fixed effect for study drug and compound symmetric covariance matrix among repeated measurements.
Calculated as the geometric mean±coefficient of variance, geometric mean ratio, and significance of the ratio different from 100%.
The fractional exposure in the indicated time period as a fraction of the total exposure and expressed as a percentage based on the integrated AUC.
AUC, integrated area under the time–exposure curve; C max, peak exposure; MRT, mean residence time; RHI, regular human insulin; rHuPH20, recombinant human hyaluronidase; t 50%, time to half of the maximum exposure either before (early) or after (late) peak exposure; t max, time to peak exposure.
Safety results
All injections were well tolerated. Adverse events were generally mild, not study drug related, and of similar frequency regardless of the treatment administered (Table 4). The events considered causally related to study drug exposure were all mild and included injection site erythema and induration in one patient after injection of lispro alone, injection site pain in one patient after injection of RHI+rHuPH20, injection site pain in one patient after injection of lispro+rHuPH20, and injection site erythema in one patient after injection of RHI+rHuPH20. No patients were withdrawn from the study because of the occurrence of adverse events.
AE, adverse event; RHI, regular human insulin; rHuPH20, recombinant human hyaluronidase.
Discussion
This study confirmed in patients with T2DM that co-administration of rHuPH20 accelerated insulin PK as has previously been shown in healthy volunteers 28,29 and patients with type 1 diabetes. 30 Across these studies, each insulin when injected subcutaneously with rHuPH20 has an earlier onset of exposure, greater and earlier peak exposure, and a shorter duration of exposure than the insulin alone, with approximately twice the insulin exposure in the first hour and approximately half the insulin exposure beyond 2 h.
This study also confirms and extends to patients with T2DM an observation in patients with type 1 diabetes, that insulin injected with rHuPH20 improved glycemic response to a standardized test meal. 30 In the prior study, which was designed to compare insulin PK at a physiologic dose, the insulin dose with rHuPH20 was optimized for each patient, and then the glycemic response to the same dose of insulin alone was compared (i.e., doses were not individually optimized for each study drug independently). Hyperglycemic excursions were reduced for both lispro and RHI with rHuPH20 compared with the insulin alone; however, this result was interpreted cautiously because of limitations of the PK study design. In the current double-blind study, using individually optimized doses of each study drug, lispro+rHuPH20 provided superior glycemic control with significantly reduced hyperglycemic and hypoglycemic excursions at a modestly but statistically significantly reduced dose compared with insulin lispro alone.
The results of the two studies are slightly different, with both studies showing reduced postprandial hyperglycemia, but only the present study also showed reduced hypoglycemia. This difference may be a result of the separate optimization of insulin doses for each study drug resulting in a moderately lower dose of lispro with rHuPH20. Other differences may have also contributed to the observed differences such as the higher insulin dose in insulin-resistant T2DM patients, greater carbohydrate content of the meal, and T2DM patients' endogenous insulin production.
Limitations of this study include the use of a liquid test meal, which, despite being standardized, is nevertheless not representative of real-world food intake. Although necessitated by blood sampling limits, the lack of an RHI alone treatment arm limits the ability to interpret the effect of rHuPH20 on the PK and glucose response to the RHI+rHuPH20 treatment. However, because these parameters were comparable for RHI+rHuPH20 relative to lispro alone, it is clear that rHuPH20 has a similar effect on RHI as it does on lispro because the faster PK and superior PPG control of lispro when injected subcutaneously immediately before a meal relative to RHI are well established. 29,31 The study drug exposure was limited to eight injections of an insulin with rHuPH20, which were separated by an approximately 1-week washout period, and the safety and tolerability of chronic exposure to insulin formulated with rHuPH20 remain to be demonstrated. Finally, the translation of these tightly controlled laboratory results to clinical benefits in the treatment of diabetes will need to be investigated.
The results of this study suggest that formulation of a rapid-acting insulin analog such as lispro with rHuPH20 may provide benefits for treating patients with diabetes by decreasing postprandial hyperglycemic excursions, reducing the risk of hypoglycemic events, and lowering the insulin doses required for optimal glycemic control.
Footnotes
Acknowledgments
We wish to thank the patients and study personnel who made this study possible and gratefully acknowledge Lutz Heinemann for thoughtful review of the draft manuscript. This study was sponsored by Halozyme Therapeutics, San Diego, CA.
Author Disclosure Statement
D.V. and D.M. are employees of and E.L. consults for Halozyme Therapeutics Inc., the sponsor of this work. M.H. and L.M. declare no competing interests.