
Abstract
Background/Aim:
There are few data regarding insulin levels in the lungs during diabetes therapy with inhaled insulin. We examined the disposition of inhaled human insulin (Exubera® [EXU] human insulin [recombinant DNA origin], Pfizer, New York, NY) in the lungs by measuring trough insulin levels in bronchoalveolar lavage (BAL) fluid after 12 weeks of EXU treatment.
Methods:
After a 4-week run-in period of subcutaneous insulin therapy, 24 subjects with type 1 diabetes mellitus (T1DM) and 26 with type 2 diabetes mellitus (T2DM) continued their basal insulin regimen and received premeal subcutaneous (SC) insulin for 13 weeks, followed by 12 weeks of premeal EXU. BAL was performed approximately 12 h after the last insulin dose at (1) baseline, (2) following SC insulin, and (3) following EXU.
Results:
Twenty patients with T1DM and 24 patients with T2DM completed all three bronchoscopies. BAL trough insulin levels were undetectable at baseline or following SC insulin. After EXU therapy, they increased to a median of 4.5 nM (1.6–9.0 nM) and 2.3 nM (0.5–9.4 nM) in T1DM and T2DM, respectively. BAL trough insulin levels did not correlate with treatment efficacy, adverse effects, plasma insulin levels, or changes in pulmonary function. A larger proportion of previous EXU doses was present in the BAL in patients with T1DM. We found no correlation between average daily insulin doses and BAL trough insulin levels.
Conclusions:
BAL trough insulin increased following EXU therapy, but this increase did not correlate with other clinical or laboratory parameters, suggesting no significant biological action. Further studies are warranted to better understand inhaled insulin deposition and clearance and possible effects of increased insulin levels on the lungs.
Introduction
The first inhaled human insulin formulation that reached clinical use was Exubera® (EXU) human insulin [recombinant DNA origin] inhalation powder, Pfizer, New York, NY), which was approved for use in adults with type 1 or type 2 diabetes mellitus in the United States and the European Union in 2006 and later voluntarily removed from the market by Pfizer in October 2007. 5
After inhalation, EXU follows a pharmacokinetic and pharmacodynamic profile similar to that of injected rapid-acting insulin analogs, 6 with comparable rates of hypoglycemia in patients treated with EXU or rapid-acting analogs in clinical trials. 7 –9 The proportion of the original EXU dose that is available for absorption has been estimated as 40%, 10 of which only about one-quarter appears in the circulation. The fate of the missing insulin is poorly understood, but there is little evidence of pulmonary accumulation of proteins delivered through the lungs. 11 The insulin concentrations present in the alveolar lining fluid (ALF) during long-term EXU treatment in humans have not been reported until now.
The efficacy and tolerability of EXU and SC insulin have been similar in clinical trials, 12 –17 yet a small decline in the forced expiratory volume in 1 s (FEV1) and the diffusing capacity for carbon monoxide (DLCO) has been reported for patients treated with EXU relative to those treated with SC insulin. These declines appeared within 1–3 weeks of initiation of therapy, did not progress further after 12 weeks of therapy, and reversed after discontinuation of EXU therapy. 12 –17 Furthermore, a long-term (8-year) follow-up of patients continuously treated with EXU showed minimal changes in any pulmonary function test, similar to those expected in an adult population with diabetes. 18 It is interesting that similar changes have been reported with different inhaled insulin products, 19,20 and there is also indirect evidence hinting that observed changes in pulmonary function tests may be due to nonspecific responses of the lung to an osmotic load. 20 Other components of this bronchoalveolar lavage (BAL) study reported that EXU therapy is not accompanied by signs of pulmonary inflammation at the macroscopic or microscopic level. 21
To better understand the transport of insulin and other potentially therapeutic proteins across the air–blood barrier, as well as the mechanisms of the changes in pulmonary function observed during inhaled insulin therapy, it is crucial to study the alveolar concentrations of insulin during EXU therapy.
We aimed to explore the disposition of EXU in the lungs by measuring insulin levels in the BAL fluid, to correlate those levels with clinical and laboratory parameters relevant to diabetes treatment, and to extend these observations to a model of pulmonary deposition and disposition following inhalation of insulin.
Subjects and Methods
Patients
Detailed methods have been published previously. 21 In brief, the study included subjects with type 1 diabetes mellitus (T1DM) between 18 and 55 years of age and subjects with type 2 diabetes (T2DM) between 30 and 55 years of age. Patients had to have normal DLCO, total lung capacity, forced vital capacity (FVC), and FEV1, 22 –24 and an FEV1/FVC ratio of >70%. Glycated hemoglobin A1c (HbA1c) levels had to be between 5.5% and 11.0%. Patients with T1DM should have fasting insulin C-peptide <0.2 pmol/mL and a body mass index of ≤30 kg/m2, and patients with T2DM should have a body mass index of ≤35 kg/m2.
Subjects needed to have been on a stable insulin regimen for at least 2 months prior to the screening visit. We excluded patients with any reported pulmonary or respiratory disease, as well as those receiving medications for the treatment of pulmonary disease. Exclusion criteria also included a history of smoking (5 packs/year or more), atopy, brittle diabetes, or conditions that could predispose to severe hypoglycemia. All subjects were using SC insulin at study entry.
Study design
This report encompasses two studies: one in subjects with T1DM and one in subjects with T2DM. Both studies had the same design: 31-week, multicenter, nonrandomized, comparator-controlled, open label, sequential design (Fig. 1). Following screening, subjects began a 4-week run-in period, during which diabetes control was optimized by SC insulin therapy consisting of two or three daily doses of insulin lispro or regular insulin, plus either once- or twice-daily administration of neutral protamine Hagedorn (NPH) insulin or once-daily administration of insulin glargine before bedtime. 16 Baseline measurements refer to those performed at the end of this run-in period.
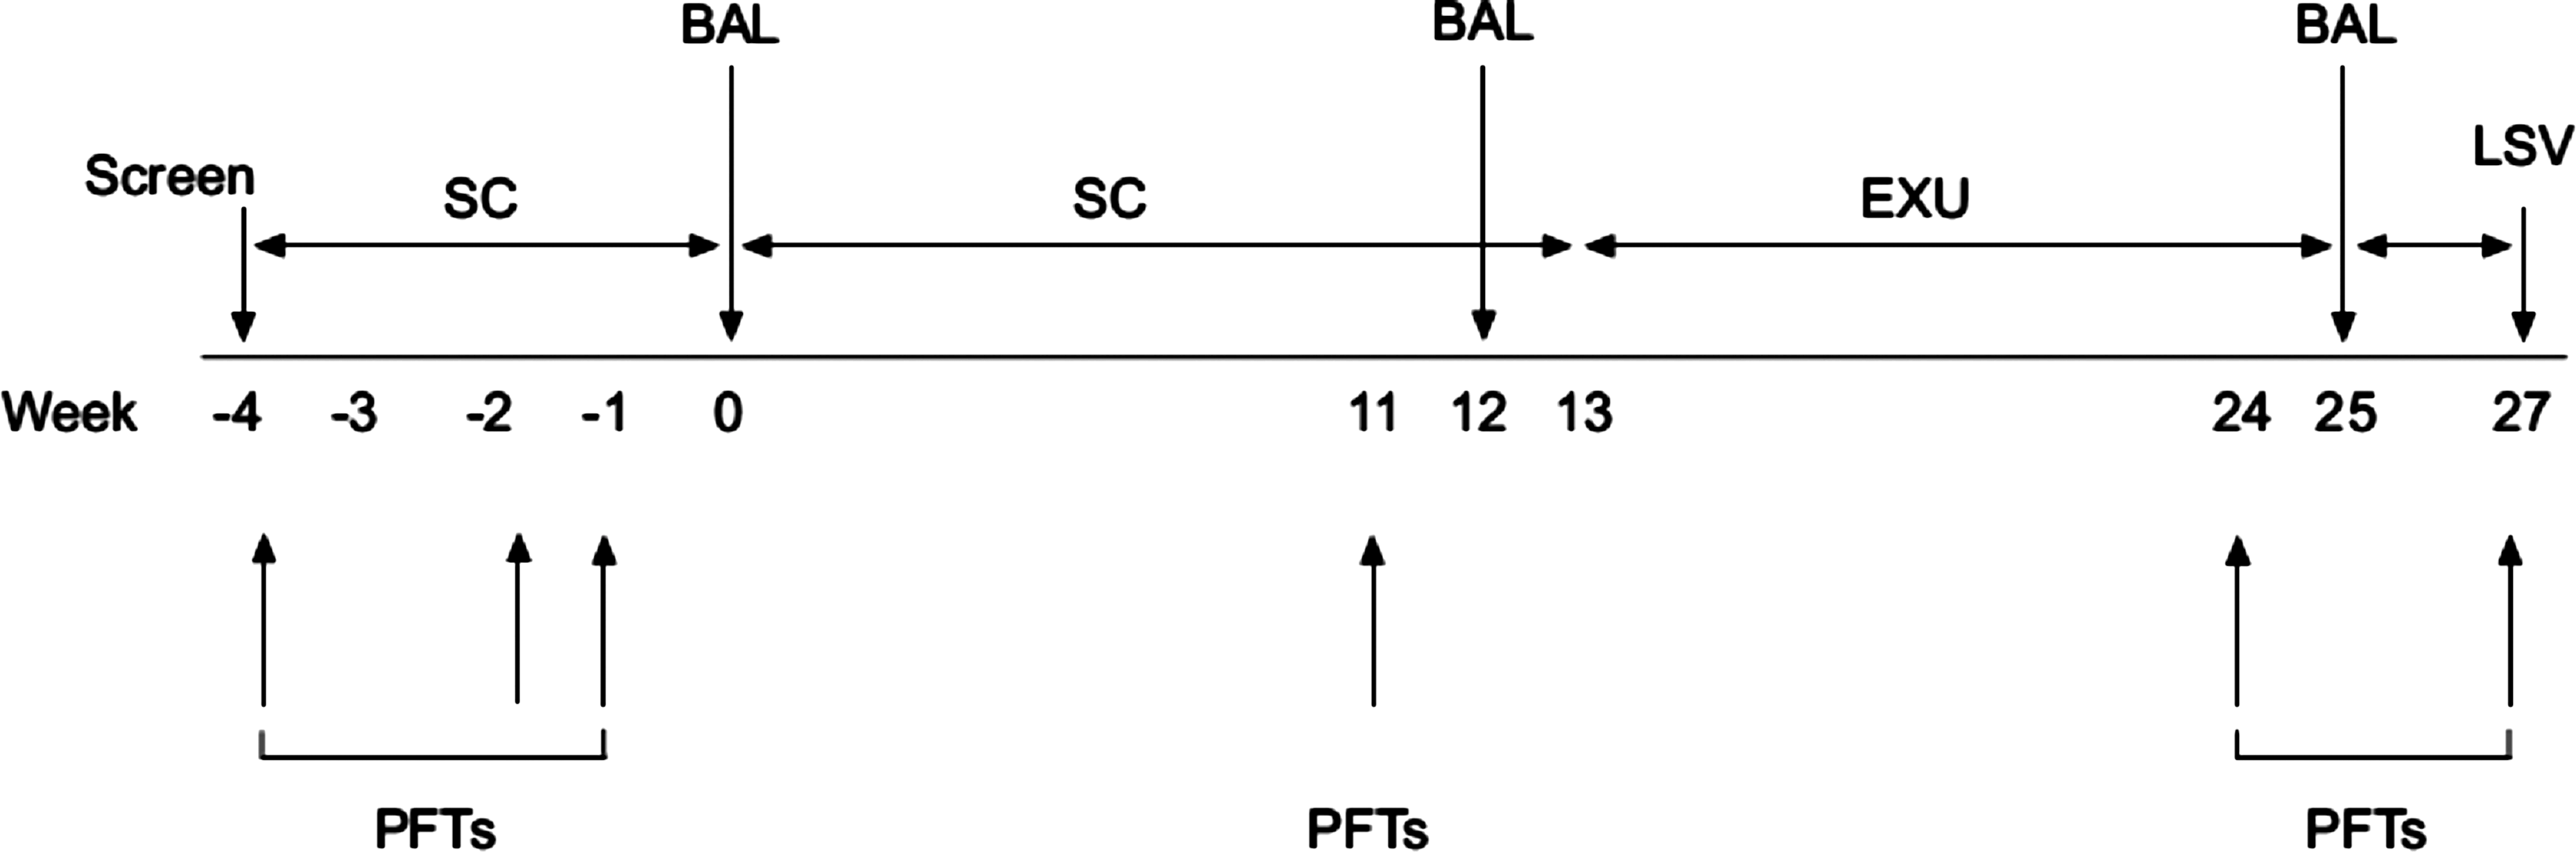
Study design. BAL, bronchoalveolar lavage; EXU, Exubera®; LSV, last subject visit; PFT, pulmonary function test; SC, subcutaneous insulin.
During the active phase of the study, all subjects received the same SC insulin regimen as in the run-in period for 13 weeks (SC therapy). This was followed by premeal EXU with intermediate/long-acting SC insulin for 12 weeks (EXU therapy) and then a 2-week washout period. The studies were conducted in compliance with the International Conference on Harmonization–Good Clinical Practice Guidelines, and all patients gave written informed consent. The protocol and informed consent documentation were reviewed and approved by the institutional review boards at each of the participating investigational centers: three sites in the United States for the study in T1DM (enrolling 16, 6, and 2 patients, respectively) and two sites in the United States for the study in T2DM (enrolling 21 and 5 patients, respectively).
Measurements
Fiber optic bronchoscopy was performed at baseline (week 0), after 12 weeks of SC therapy (week 12), and following 12 weeks of EXU (week 25) using a standardized protocol (see Rosenstock et al. 20 for details). BAL was postponed if the subject had an intercurrent respiratory tract illness. Initial processing of the BAL fluid was conducted at the five local sites. 21
Concentrations of free and total insulin in plasma and BAL fluid were determined by a sandwich enzyme-linked immunosorbent assay, using monoclonal antibodies against human insulin (Mercodia, Winston Salem, NC). For the determination of total insulin, insulin–antibody complexes were dissembled by quick acidification/neutralization of the sample. Then antibodies were precipitated with polyethylene glycol, and insulin was measured in the supernatant by enzyme-linked immunosorbent assay. For the determination of free insulin, insulin–antibody complexes were precipitated with polyethylene glycol, and then insulin was measured in the supernatant by enzyme-linked immunosorbent assay.
For BAL insulin determinations (free or total), the lower limit of detection was 30 pmol/L. The average intra-assay coefficients of variation were 7.8% for free insulin and 12.5% for total insulin. The average inter-assay coefficients of variation were 11.7% for free insulin and 14.3% for total insulin.
Antibodies directed against insulin (insulin antibodies [IAb]) of the immunoglobulin [Ig] G and IgA isotypes were measured in BAL and serum at weeks 0, 12, and 25 using radioimmunoassays. The lower limit of detection of IAb was 5.3 μIU of insulin bound/mL for BAL IgG and 62 μIU of insulin bound/mL for serum IgG. Values of BAL IgG IAb below the limit of detection were imputed as 2.65 μIU/mL, and values of serum IgG IAb below the limit of detection were imputed as 31 μIU/mL.
Pulmonary function tests (spirometry, lung volumes by helium dilution, and DLCO) were conducted at screening (week −4) and at weeks −2, −1, 0, 11, 24 and 27, using standardized methodology. 16,17,25 HbA1c and fasting plasma glucose levels were collected at screening, baseline (week 0), and weeks 11 and 24. General safety monitoring, including reporting of adverse and hypoglycemic events, was conducted throughout the entire trial.
Statistical methods
The results of the primary study end points of change in total and differential BAL cell counts have been reported elsewhere. 21 In the present analysis, baseline-adjusted concentrations of free and total insulin after 12 weeks of EXU therapy are compared with concentrations after 12 weeks of SC ([EXU−SC]−[SC−baseline]).
Because of evident deviations from a normal Gaussian distribution, BAL insulin data were reported as median (interquartile range) values, and comparison of medians between treatment phases were done using nonparametric statistical methods (Wilcoxon signed ranks test). Spearman correlation coefficients between insulin levels and relevant clinical and laboratory variables were calculated. The primary analysis set consisted of all patients who had insulin measurements from all three BAL fluid samples. The sample size was 20 patients with T1DM and 24 patients with T2DM. Because of the absence of prior data on the normal distribution of insulin concentrations in BAL among patients, it was not possible to calculate the power of this study sample a priori.
Results
Initial screening was performed in 42 patients with T1DM and 48 patients with T2DM. Of these, 24 patients with T1DM and 26 with T2DM were enrolled and assigned to treatment. Four T1DM patients (three during the SC insulin phase and one during the EXU phase) discontinued treatment, and none of the T2DM patients discontinued treatment. Thus the primary analysis set comprises 20 patients with T1DM and 24 patients with T2DM who completed the two treatment phases and had all three measurements of pulmonary function performed. Basic patient demographics, pulmonary function tests, and insulin doses at the end of the study are reported in Table 1.
Values are mean (SD) values unless stated otherwise.
Inhaled insulin doses are defined as those present in the blisters prior to administration; part of this dose may be lost to the inhalation device. Medians are given followed by the range.
DLCO, diffusing capacity for carbon monoxide; FEV1, forced expiratory volume in 1 s; IQR, interquartile range.
BAL and plasma insulin concentrations
BAL trough insulin levels could not be detected at baseline or following SC insulin therapy in patients with T1DM or T2DM (Table 2). Median trough insulin levels in BAL increased to 4,560 pmol/L (4.5 nM) at the end of the EXU therapy phase in patients with T1DM and to 2,337 pmol/L (2.3 nM) in patients with T2DM. Given that part of the insulin measured in the total insulin assay may be bound to antibodies and not biologically active, we also measured trough levels of free insulin in BAL. The results were very similar: free BAL insulin was not detectable at baseline or after SC treatment, and the median after the EXU therapy phase was 4,575 pmol/L (4.5 nM) for patients with T1DM and 2,255 pmol/L (2.2 nM) for patients with T2DM. There was wide variation in insulin doses among patients, so we also explored median trough insulin levels in BAL values adjusted for the last insulin dose (i.e., the pre-dinner inhaled insulin dose on the night before the BAL was performed). Patients with T1DM had a median of 1,277 pmol/L/mg of inhaled insulin, whereas patients with T2DM had a median of 301 pmol/L/mg of inhaled insulin; therefore a relatively larger proportion of the administered dose of insulin could be found in the BAL of patients with T1DM.
Data are median (interquartile range) values except for plasma insulin measurements, which had a normal distribution and are reported as mean (SD).
Reported P values are for the baseline-adjusted difference between week 25 and week 12.
BAL, bronchoalveolar lavage; EXU, Exubera; IgG, immunoglobulin G; ND, not detectable; SC, subcutaneous.
Mean fasting plasma levels of total insulin were 350 pmol/L and 405 pmol/L at baseline in patients with T1DM and T2DM, respectively (Table 2). They were essentially unchanged following 12 weeks of SC insulin therapy. After 12 weeks of EXU therapy, fasting total insulin levels rose to 1,985 pmol/L and 1,982 pmol/L, respectively. In contrast, fasting concentrations of plasma free insulin were 134 pmol/L at baseline in patients with T1DM and 181 pmol/L in those with T2DM (Table 2) and remained largely unchanged following 12 weeks of either SC insulin or EXU therapy. The difference in the pattern of total versus free plasma insulin measurements suggests that the increase in plasma insulin at the end of the EXU phase was at the expense of antibody-bound insulin, as has been previously reported in other clinical trials of EXU. 12 –16
BAL and plasma anti-IAb concentrations
IAb of the IgA isotype were not detectable at any week in either BAL or serum. Baseline concentrations of serum IgG IAb were detectable in patients with T2DM but not in patients with T1DM. Median serum IgG IAb levels remained the same after SC treatment and increased at the end of the EXU phase, from 31 to 77 μIU/mL (P=0.009) in patients with T1DM and from 64 to 90 μIU/mL (P=0.001) in patients with T2DM. Conversely, BAL IgG IAb levels were undetectable at all three measurements in both patients with T1DM and T2DM.
Correlation between BAL insulin levels and clinical variables
In an attempt to assess whether BAL trough insulin levels were associated with changes in pulmonary function, with the efficacy of the insulin therapy, or with the occurrence of adverse effects, scatter plots were created correlating BAL trough insulin levels with several clinical measurements (Fig. 2). In order to remove extraneous variation coming from different doses of insulin the night before the BAL was performed, most scatter plots show the correlations with dose-adjusted BAL trough insulin levels (in pmol/L/mg of inhaled insulin). The only significant correlation was that between dose-adjusted BAL trough insulin levels and change in FEV1 from week 11 to week 24 in subjects with T1DM (Spearman's r=0.588, P=0.013).
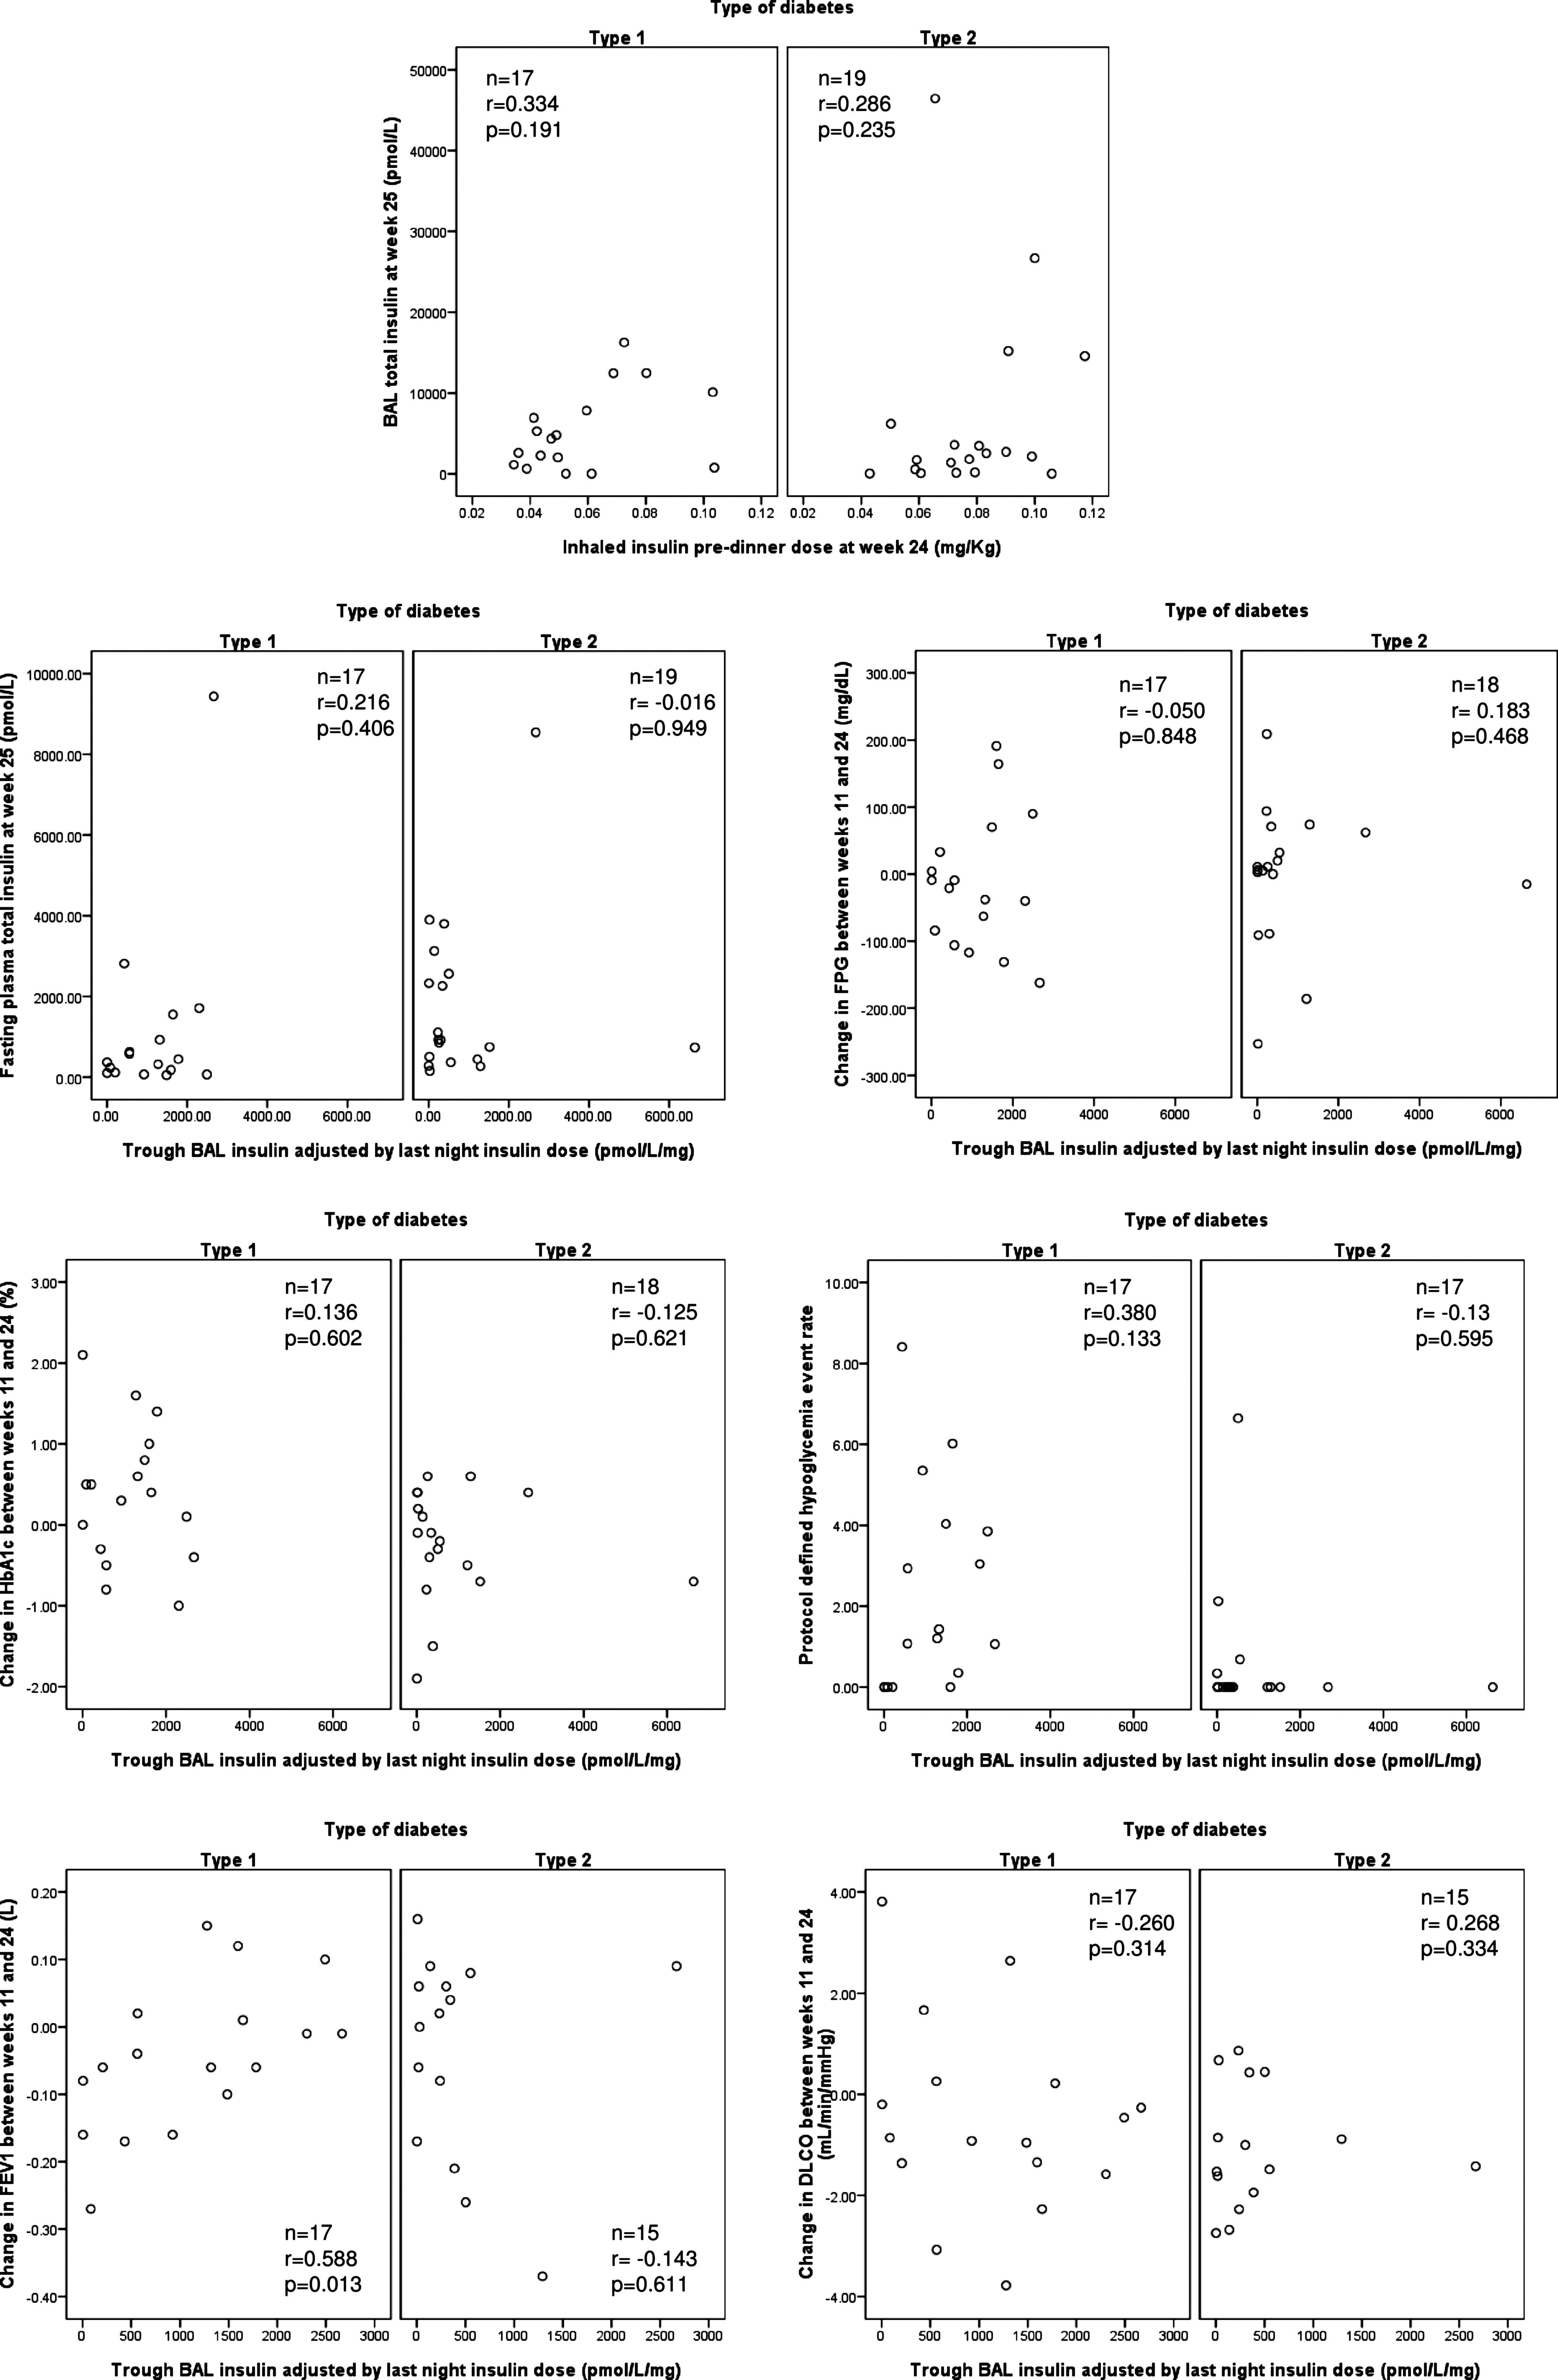
Scatter plots between bronchoalveolar lavage (BAL) trough insulin and relevant clinical variables. DLCO, diffusing capacity for carbon monoxide; FEV1, forced expiratory volume in 1 s; FPG, fasting plasma glucose; HbA1c, glycated hemoglobin A1c.
Estimate of insulin concentration in lung-lining fluid
The BAL procedure involves extensive dilution of the epithelial ALF, so that BAL concentrations of all substances (including insulin) are lower by several orders of magnitude compared with those in the actual ALF. With the purpose of estimating the fraction of inhaled insulin that remained in the ALF 12 h after its administration, we made an attempt to estimate the actual concentration of trough insulin in the ALF at two times: (1) immediately after the administration of the EXU dose and (2) when the BAL was performed.
The estimation of insulin concentrations in ALF immediately after EXU administration involved the following calculations and assumptions (Table 3): 1. We estimated the alveolar surface area from sex and height using the prediction equations previously published by Colebatch and Ng.
26
2. We estimated the volume of ALF from the alveolar surface area, assuming the ALF layer has an approximate thickness of 0.07 μm.
1
3. Previous data estimate that approximately 40% of the insulin dose in EXU blisters reaches the deep lung, where it is potentially available for absorption.
11
Thus we multiplied the pre-dinner dose of EXU placed into the delivery device by 0.4 to obtain the amount of insulin that would reach the terminal airways and then be dissolved in the ALF. We converted this amount to molar units.
It is also possible that small quantities of prior inhaled insulin doses are present in the alveolar lining fluid (ALF) at this time.
BAL, bronchoalveolar lavage; EXU, Exubera®; IQR, interquartile range.
By dividing the insulin that reaches the distal lung by the amount of ALF, we get an estimation of the insulin concentration immediately after EXU administration. The estimation of trough insulin concentrations in ALF (i.e., the concentrations at the moment the BAL was performed) involved multiplication of the measured BAL trough insulin concentrations by a dilution factor, which has been estimated to be approximately 200 for the standard BAL procedure in normal adults. 27,28
Using this approach, the median concentration of insulin in ALF immediately following the last EXU inhalation was estimated to be 34.7 μM in patients with T1DM and 60.9 μM in patients with T2DM. The respective median ALF trough insulin concentrations were 0.91 μM and 0.46 μM. Patients with T1DM retained in their ALF a median estimated 2.6% of the previous (12 h earlier) administered dose, whereas patients with T2DM retained about 0.72% (Table 3).
The only clinical variable that was associated with the percentage of insulin retained in the ALF was a change in FEV1 between weeks 11 and 24, consistent with what was found for trough insulin concentrations, but the absolute difference in FEV1 between extreme quartiles of percent insulin retained was small (0.18 L). It is interesting that the same association was not observed for FEV1 in week 24 as a percentage of the predicted value.
Discussion
To our knowledge, this is the first report of the concentrations of inhaled insulin (EXU) in the lungs of patients with diabetes using BAL methodology. Mannkind (Valencia, CA) has recently reported pharmacokinetic data on the deposition and absorption of Technosphere® insulin. 29 Their experiments differ from ours in that they performed BAL after a single acute exposure to inhaled insulin. Moreover, they studied normal human volunteers without diabetes. These data and other features of Technosphere® insulin have been summarized in a recent review. 30
Our results are strengthened by the inclusion of patients with both T1DM and T2DM, by the direct comparison between EXU and SC insulin in the same individuals, and especially by the use of repeated BAL measurements after 12 weeks of continued therapy by each route.
We did not find detectable trough levels of total or free BAL insulin after 12 weeks of SC insulin therapy in patients with T1DM or T2DM. This may reflect the significant dilution of ALF by the BAL process, limited diffusion of plasma insulin across the air–blood barrier into the air lumen, and the likely absence of a system for transporting insulin from the blood across the air–blood barrier into the alveolar spaces. Several studies in vitro and in animal models have failed to discover such a system. 11,31 More sensitive insulin assays should ultimately measure these low levels of insulin in BAL from these patients.
After 12 weeks of EXU therapy, trough BAL insulin levels significantly increased to a median of 4.5 nM in patients with T1DM and 2.3 nM in patients with T2DM. This difference in favor of patients with T1DM was evident despite the fact that T2DM patients were in general older and heavier and required larger inhaled insulin doses (Table 1). When trough BAL insulin concentrations were adjusted by the pre-dinner EXU dose, the proportion of the dose still present in BAL was about fourfold higher in patients with T1DM. In this regard, it has been documented that insulin resistance, which is prevalent in T2DM but not in T1DM, is clearly associated with lower FEV1 and FVC values. 32 These changes may reflect a mild obstructive affectation of the airways that could prevent some EXU from reaching the bronchioles and alveoli where absorption takes place. Thus, the lower levels of BAL insulin in patients with T2DM could be due not to differences in absorption efficiency but to differences in the ability of EXU to reach the absorptive zone. Another possibility is that insulin resistance somehow modifies the air–blood barrier to promote protein absorption. Low-grade chronic inflammation, which usually accompanies insulin resistance, could be the factor increasing the permeability of the pulmonary epithelium to small proteins. However, these potential explanations must be explored more thoroughly in future studies.
Our data clearly show that insulin concentrations in the BAL and thus the ALF are far higher for inhaled insulin rather than injected insulin. Presumably, this also means that Type 1 and Type 2 cells, endothelial cells, and other cells present in the lungs are exposed to higher levels of insulin. In spite of that, BAL insulin concentrations (after EXU therapy) were not correlated with the efficacy of insulin therapy assessed by either HbA1c or by fasting plasma glucose. When we compared variations in BAL insulin (1) with the frequency of hypoglycemic adverse events, (2) with the thickness of the air–blood barrier and other determinants of DLCO, or (3) with the plasma concentrations of total or free insulin, significant correlations were absent. Similar results were obtained when we correlated the estimated percentage of EXU dose present 12 h later with the same clinical and laboratory variables. However, we found a significant positive correlation between BAL insulin concentrations and the change in FEV1 during EXU therapy in patients with T1DM: patients with higher BAL insulin showed smaller reductions or even positive changes in FEV1 during EXU therapy. Because part of the liquid retrieved during BAL actually reflects the composition of the fluid lining respiratory bronchioles and other small airways, higher BAL insulin levels could reflect more insulin deposited in small airways instead of alveoli, and this correlation could be interpreted as a bronchodilating effect of insulin. Insulin itself may possess anti-inflammatory properties. 33 Nevertheless, the absolute difference in FEV1 between patients with the lowest versus highest BAL insulin was modest (<0.4 L), and the association did not exist for patients with T2DM. Thus it is not possible to rule out that this is a chance finding before other studies confirm such a hypothesis.
One potential limitation of our study is that we only have a single measurement of insulin between the last dose of EXU and approximately 12 h later. We cannot rule out a correlation between BAL insulin and plasma glucose at other times, especially earlier in the morning. However, a clinical study with multiple BAL samples across a 12-h period is unlikely to be feasible. In addition, BAL insulin concentrations and changes in HbA1c during EXU therapy were not associated. This implies that the presence of nonabsorbed insulin in the alveoli does not impact the overall efficacy of inhaled insulin as a diabetes treatment.
We are aware that our calculations for the concentrations of insulin in ALF are based on multiple assumptions supported by scientific literature but subject to imprecision. Notwithstanding, they do demonstrate the exposure of lung cells to higher concentrations of insulin than during similar diabetes treatment via injection. They also highlight the slower absorption and higher persistence of alveolar insulin in T1DM and provide a useful approximation for comparison purposes. In this respect, one concern with the use of inhaled insulin formulations is the potential for insulin as a growth factor in the lung epithelium that might favor the progression of preexisting tumors. We estimated the trough ALF insulin concentrations after 12 weeks of EXU therapy to be 0.91 μM in T1DM and 0.46 μM in T2DM. Furthermore, the insulin concentrations to which surrounding tissues are exposed after an SC injection of insulin are likely to be much higher than those seen by the alveolar epithelium after a dose of inhaled insulin. The nominal potency of recombinant human insulin is approximately 28.5 U/mg, and the insulin molecular mass is 5.8 kDa; so 1 mole of insulin is 5,800 g, or 1 g=0.17 millimoles. For the most commonly used concentration of SC insulin (U100), every milliliter contains 100 U, so the insulin concentration is 3.5 mg/mL, or 3.5 g/L, which equals 0.6 mmol/L or 600 μM. By contrast, our estimations of insulin concentrations in the ALF immediately after inhaled insulin deposition (Table 3) are 34.7 μM for patients with T1DM and 60.9 μM for patients with T2DM. This is a 10–20-fold lower concentration. It is very unlikely that these concentrations of insulin could induce mitogenic effects through the insulin-like growth factor-1 receptor because the affinity of insulin for the insulin-like growth factor-1 receptor is about 100 times lower than that of insulin-like growth factor-1. 34 Moreover, the estimated normal concentration of endogenous pulmonary insulin-like growth factor-1 (0.3 μM 35 ) would saturate any available receptors. All of this suggests that there are no important local mitogenic or anti-apoptotic effects of insulin at the estimated ALF concentrations during EXU therapy.
Plasma concentrations of total insulin were significantly increased after EXU therapy, but the same did not happen with plasma concentrations of free insulin. Because the difference between total and free insulin represents antibody-bound insulin, this may reflect higher levels of IAb produced as a consequence of receiving insulin via the respiratory tract. This has been seen of other proteins delivered to the lung such as recombinant human DNase I (Pulmozyme®, Genentech Inc., South San Francisco, CA). 36 It is likely that when proteins cross epithelial barriers in the lung and move through lymphatic pathways and through lymph nodes, antibodies are produced. In both cases, these are non-neutralizing antibodies and seem to have no significant biological activity. We do know that phagocytosis, processing, and subsequent presentation of insulin epitopes by connective tissue macrophages and dendritic cells enhance humoral responses to insulin. Previous studies have documented the ability of alveolar macrophages to ingest inhaled proteins. 37 In contrast, alveolar macrophages seem to have little appetite for insulin. Moreover, alveolar macrophages in general are relatively inefficient in terms of preserving and presenting antigens. 38 In conclusion, increased levels of IAb are associated with the inhalation route. However, this increase in antibody-bound insulin did not affect insulin biological activity as reflected by antidiabetes efficacy and is consistent with previous reports of inhaled insulin therapy. 12 –15
Our findings at the end of the EXU phase highlight features of the body's response to the administration of therapeutic proteins via the lung: (1) The humoral immune response to inhaled insulin seemed to be restricted to the serum compartment, as evidenced by the fact that the increases in plasma insulin were accounted for by antibody-bound insulin, but increases in BAL insulin were accounted for by free insulin. This coincides with the increases in anti-insulin IgG (circulating) but not IgA (secretory). (2) In agreement with previous reports, 21 there is no indication of an immune-mediated inflammatory response in the lung. (3) The lung can become tolerant of increased levels of native proteins, delivered by inhalation, that it has not encountered usually.
Limitations of our study include those inherent to the BAL technique. There is inter- and intra-individual variability in sampling because of the uncertainty about the exact source of the retrieved fluid. We do not know what fraction of the lung surface has been lavaged. This is reflected by the wide SDs and interquartile ranges of BAL measurements. Nevertheless, this kind of direct measurement provides unique information about the disposition of inhaled insulin and may also prove useful in the development of other inhaled protein therapeutics.
In summary, we found that diabetes therapy with EXU for 12 weeks is associated with a significant increase in concentrations of insulin in BAL in patients with T1DM or T2DM. Increases in insulin and BAL presumably reflect concurrent increased insulin concentrations in the ALF as well as in and on lung cells. However, these increases were not correlated with treatment efficacy, adverse effects, plasma insulin levels, or pulmonary function. The ultimate determination of its significance both acutely and after long-term exposures will require further study.
Footnotes
Acknowledgments
This study was sponsored by Pfizer, Inc.
Author Disclosure Statement
C.O.M. has no conflict of interest to report. J.D.B. reports that he has received a grant from Pfizer to study the fate of insulin delivered to the lungs in animals. G.L.F., J.G.T., P.F.S., and R.J.R. are employees of Pfizer Inc.