
Abstract
Background:
Although postural control strategies have been largely explored in diabetes patients with peripheral neuropathy, the literature on their postural control strategies related to peripheral neuropathy level and task complexity is still limited. The aim of this study is then to investigate how balance task difficulty influences postural strategies in diabetes patients with peripheral neuropathy.
Subjects and Methods:
Postural strategies and instability were evaluated in 25 diabetes patients during four standing tasks. The root mean square value of the anterior–posterior angular velocity, measured at the trunk and the ankle, was investigated and analyzed using cross-correlation functions (CCFs). Correlations between balance and clinical variables were analyzed.
Results:
A significant decrease in CCFs between trunk and ankles was observed under dynamic balance conditions. Correlations were observed between postural strategies and balance instability with the level of peripheral neuropathy and with hip and ankle strength.
Conclusion:
Postural strategies are influenced by more demanding standing tasks and correlated with the level of peripheral neuropathy and strength of muscles in diabetes patients.
Introduction
Slight differences in center of pressure (COP) measurements are usually reported between groups when control subjects are compared with patients having diabetes per se. However, differences are amplified when diabetes is accompanied by PN. 2 In fact, using COP parameters 3,4,6,9 –14 or, more recently, an accelerometer-based method, 15 studies demonstrated a poor postural control during quiet standing in diabetes patients with PN compared with control subjects and diabetes patients without PN. Diabetes patients with PN showed larger sway area, 3,12,13 larger velocity of sway, 12,13 larger COP range, 3,6 higher root mean square (RMS) values of the COP–center of mass, 9 and acceleration variables. 15
In another study, Centomo et al. 16 found no difference between diabetes patients without PN and healthy subjects in COP measures during a quiet standing task. However, during a more complex task (reaching task), the same authors found differences between the groups, with higher COP velocity, amplitude, and range in the diabetes patients. 16
Although postural control strategies have been largely explored in diabetes patients with PN, the literature on their postural control strategies related to PN level and task complexity is still limited. 3,16,17 An assessment of their postural control strategies in relation to selected clinical factors and task complexity will permit a better understanding of the postural instability in diabetes patients with different levels of PN.
Therefore, the objectives of this study are (1) to investigate how increasing balance task difficulty influences postural strategies in diabetes patients with PN and (2) to examine if a correlation exists between postural strategies and selected clinical factors (muscle strength and level of PN). We hypothesize that an increased level of PN and muscle weakness in diabetes patients 18 will increase instability during standing and decrease the synergy between body segments (inverse correlation between segment measurements). These relations will be enhanced as the task complexity increases.
Subjects and Methods
Patients
A sample of 25 type 2 diabetes patients were selected from a previous study. 19 To be included, patients must have been medically diagnosed with diabetes type 2 with a blood sugar level of greater than 7 mmol/L in the fasting state, 20 had PN, and be able to realize all balance tasks (quiet and dynamic standing tasks). From the 35 patients included in the intervention group of the previous study, 19 25 patients possessed these inclusion criteria.
The presence of PN was confirmed by a vibration perception threshold (VPT) at the tips of the internal maleoli and both great toes using a Rydel–Seiffer 128-Hz tuning fork. 21 This method has been recently recommended for routine screening of diabetic neuropathy. 21 For each specific point, the patients were asked to indicate when they could no longer feel the vibration. The investigator rated the vibration on a 9-point grading scale (0–8). A patient was considered to have PN if the VPT at one site was lower than or equal to 4 over 8. 21,22 One of the investigators did all the measurements.
Patients were excluded if they had foot ulcer (a non-diabetic neuropathy due to Charcot–Marie–Tooth disease, alcohol intake, or thyroid dysfunction) or a history of neurological (other than PN), surgical, or orthopedic conditions, which could influence the balance evaluation. The study protocol was approved by the relevant institutional ethics committees. All participants gave their written consent to participate in this study.
Instrumentation
The use of miniature sensors to investigate balance has increased in the last decade. Many advantages of using sensors such as gyroscopes and accelerometers for assess balance and gait have also been recently pointed out. 23 The main advantage is that sensors can be fixed at every level of interest. Afterward, the relations among the signals representing different body segments can be investigated. Cross-correlation function (CCF) analyses have been proposed to investigate the coordination of human movements in motor control. 24 The CCF is generally used to determine the relation between two time-varying signals. The highest correlation between two signals at a specific time lag permits the establishment of the degree of synergy between the movements of two segments. Using this method, postural strategies can be highlighted by investigating different body levels or sides during standing tasks, which allows the relation between strategies and clinical factors to be examined.
The Physilog® system (BioAGM, Lausanne, Switzerland), which is composed of five miniature sensors combining a uniaxial gyroscope and bi-axial accelerometers, was used to collect the anterior–posterior angular velocities at the trunk and ankle levels. One sensor was taped to a sacral belt at the level of lumbar segments L5–S1. Two other sensors were taped to the anterior face of the right and left shanks just up to both maleoli. All sensors were oriented in the pitch directions. All data were recorded simultaneously at a frequency of 200 Hz.
The maximal isometric strength of the hip and ankle flexor and extensor muscles was measured bilaterally using a handheld dynamometer (Microfet®, Hoggan Health, West Jordan, UT) and following the Hoggan Health Industries recommendation protocol. 25 Each test was repeated three times. The maximal value obtained from the three trials was kept for further analysis. The mean of the values on the right and left sides were used and normalized to the patient's weight for data analysis.
Evaluation and data analysis
The participants' strength was first evaluated. Afterward, each participant was equipped with the Physilog system. Then, the data (angular velocities at both the ankle and trunk levels) were collected during the performance-oriented assessment of balance (POMA-B). 26 The POMA-B is a balance evaluation for the elderly that is based on nine specific tasks (sitting balance, arises, attempts to arise, immediate standing balance, standing balance for 1 min with eyes open, nudged, standing balance for 1 min with eyes closed, turning 360°, and sitting down). The maximal score for the POMA-B test is 16, meaning “perfect” stability, whereas the minimum score (0) means complete instability. This test was first developed and validated to evaluate the risk of falling, but it is now also used to evaluate balance disorders in the elderly. 27 After the POMA-B test was completed, patients were asked to undergo dynamic balance testing on a Biodex® Balance system (Biodex Medical Systems, Shirley, NY), during which the same data (angular velocities) were collected. The Biodex Balance system is a multi-axial device that objectively measures the participant's ability to stabilize under dynamic conditions. This device uses a circular platform that rotates simultaneously in both the anterior–posterior and medial-lateral axes, and it is possible to control the instability degree in 12 levels within a platform tilt of 20°. Two difficulty levels were performed by changing the resistance of the platform to deviations; that is, when the platform provided the least resistance to tilt (least stable), the balance test was most difficult. Each patient begins with level 8, followed by level 6 (more difficult level). Each balance test lasted 60 s and was done once.
The angular velocity signals at the trunk and ankle levels were analyzed for the eyes open and eyes closed standing conditions obtained during the POMA-B test. From the 1 min of data collected at both conditions, 30 s were kept for analysis (the first and last 15 s were removed). The angular velocity signals were also analyzed for both Biodex Balance tests (levels 8 and 6). As for the other conditions, 30 s were kept for data analysis. All signal processing was performed using MATLAB version 7.4.0 (The MathWorks, Inc., Natick, MA). First, the offset of the gyroscope signal was removed by subtracting the mean of each recorded signal. Then, a third-order Butterworth filter with a cutoff frequency of 5 Hz was applied to smooth the signals. The RMS of the angular velocity was calculated for each signal and for all conditions.
The angular velocity recordings were also analyzed in terms of the normalized CCF in order to estimate the degree of synergy between different levels and sides. The CCF estimates the similarity between two different datasets, and ranges between 1 and −1. For this study, the normalized CCFs were calculated for each pair of signals (trunk vs. right ankle, trunk vs. left ankle, and right ankle vs. left ankle) (Fig. 1). Two identical signals will return a CCF equal to 1, and two identical signal shifted by 180° will return a CCF of −1; if there is no relation between signals, the CCF will be close to 0. In the present study, all CCFs with time lags ranging from −500 to +500 ms (100 frame values) were calculated. For a normalized CCF between x and y, a positive time lag means that x is ahead of y, whereas a negative lag means that y is ahead of x.
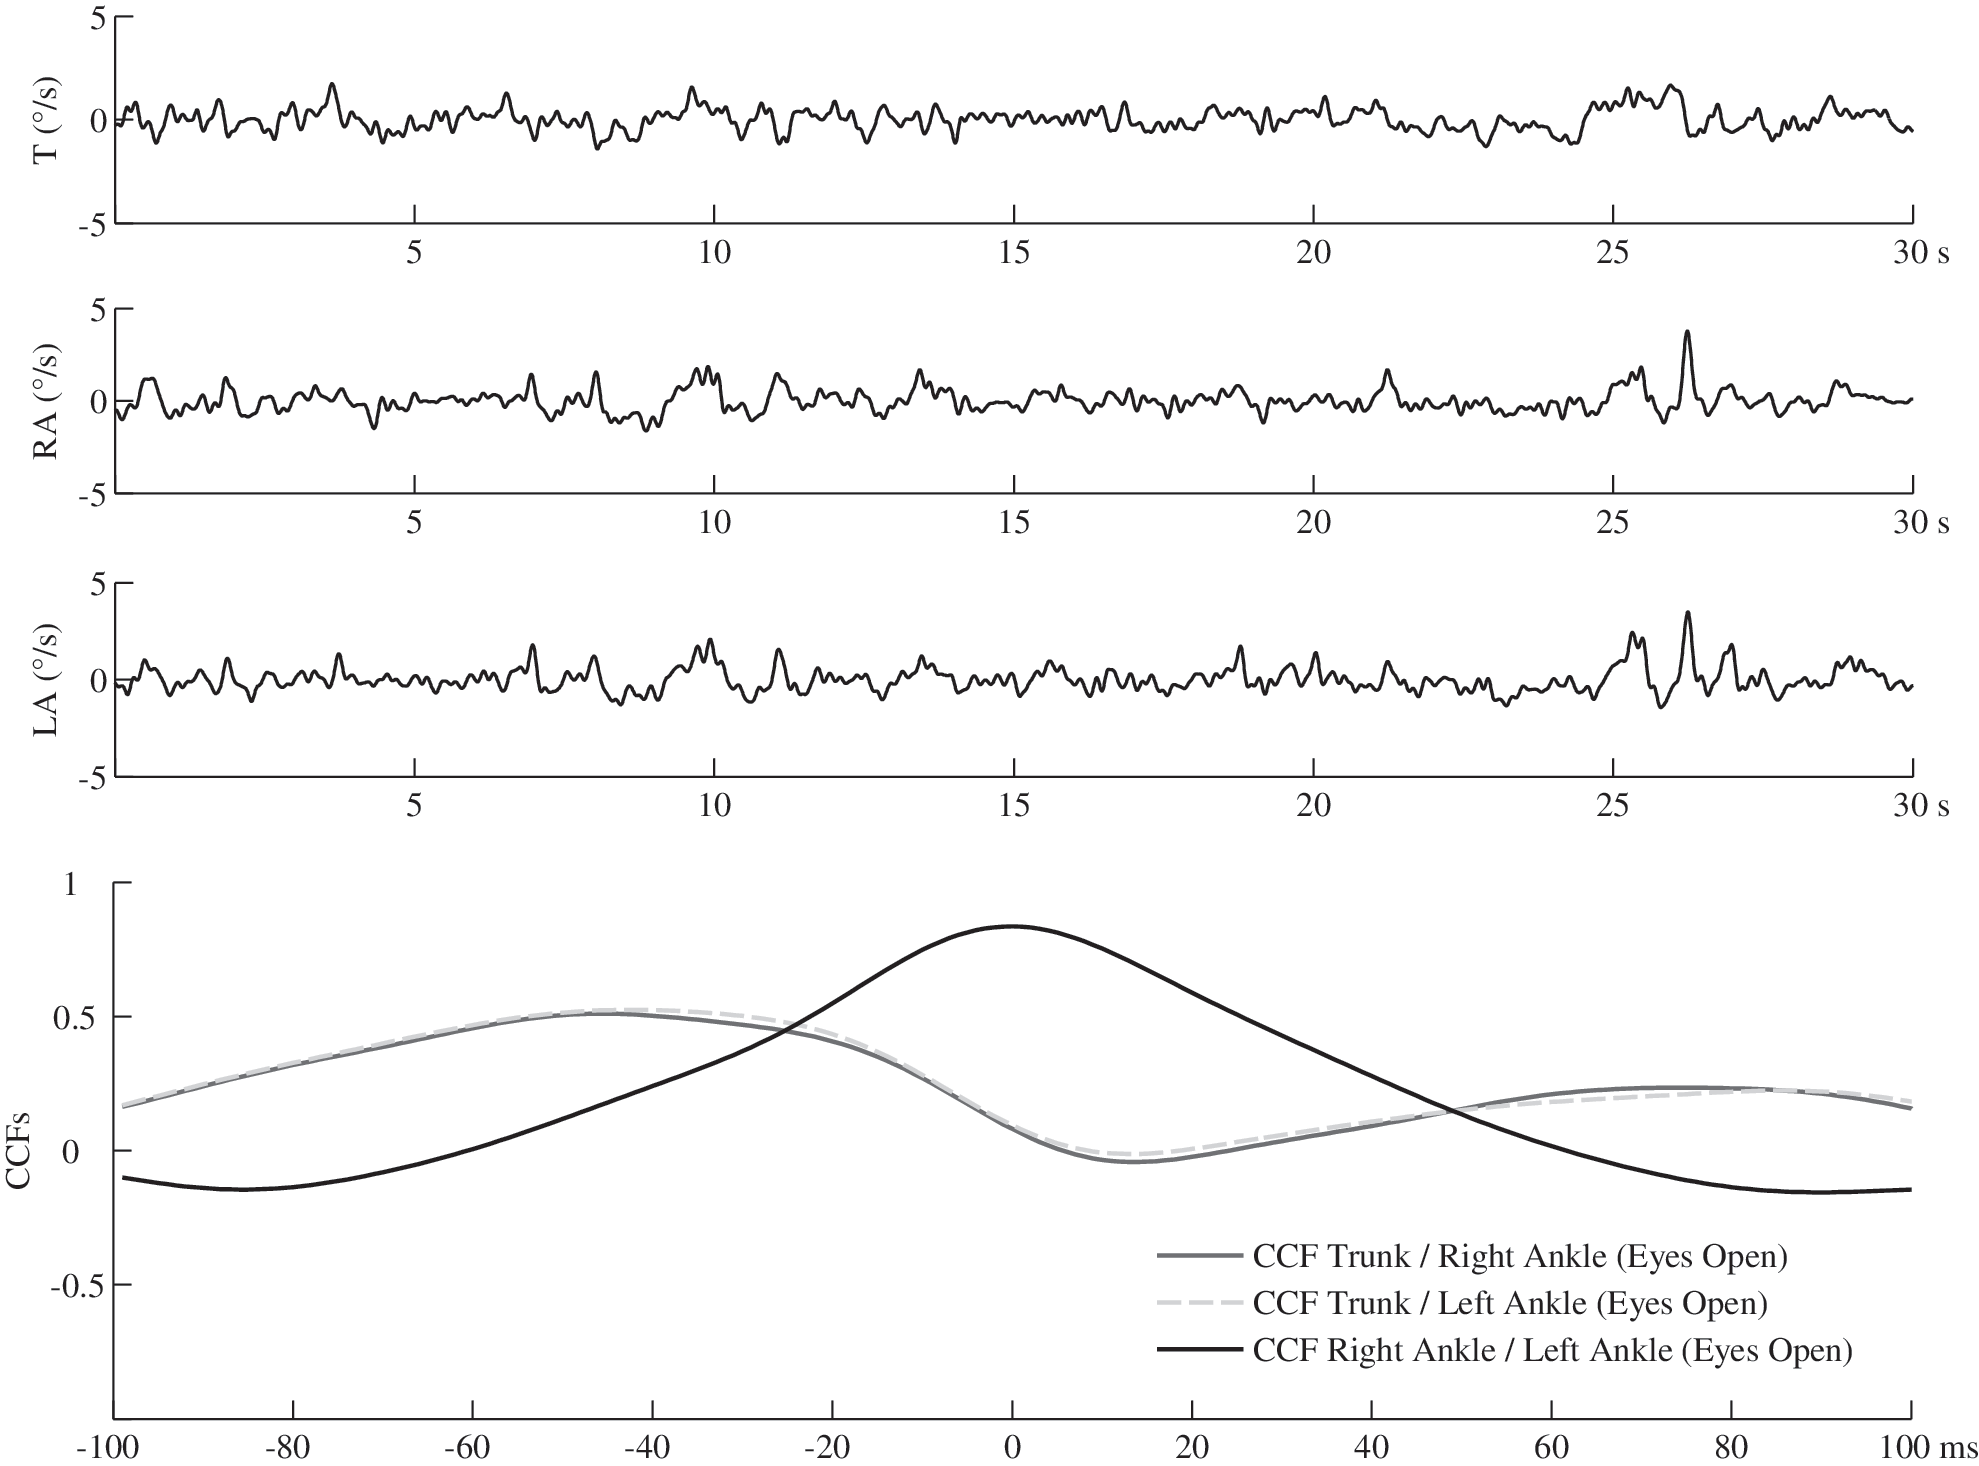
The three top curves show the original signals to be cross-correlated: at trunk level (T), at right ankle (RA), and at left ankle (LA). Bottom: The cross-correlation functions (CCFs) between signal velocity values (in °/s) obtained.
Statistical analysis
Statistical analysis was performed using STATISTICA version 8.0 (StatSoft, Inc., Tulsa, OK). The determination of balance instability and postural strategies according to task complexity was done for each segment level on each parameter using repeated-measures analysis of variance. The effect sizes using the partial η 2 (hp 2 ) were also calculated to evaluate the strength of the effect. Tukey's post hoc test was done if a task effect was found. At P<0.5, the difference was considered significant. To determine the extent to which clinical factors (level of PN and maximal hip flexor, hip extensor, ankle plantar flexor, and ankle dorsiflexor muscular strengths) influence stability and postural strategies (the RMS values and CCFs between the trunk and ankles), Pearson's correlation analyses were performed. A correlation (r) smaller than 0.1 was considered as trivial, between 0.1 and 0.3 as small, between 0.3 and 0.5 as moderate, and anything higher than 0.5 as large. 28 The average of the VPT obtained at the four sites (the tips of the internal maleoli and both great toes) for each patient was taken as the level of PN in the analysis. 21 A lower score means a higher level of PN.
Results
The average and SD values for the patients' characteristics, muscle strength, and VPT values were as follows: age, 63.5±7.2 years; weight, 81.8±14.7 kg; height, 167.4±8.4 m; body mass index, 29.2±4.9 kg/m2; hip flexor, 3.01±0.68 N/kg; hip extensor, 1.64±0.69 N/kg; ankle plantar flexor, 3.13±0.74 N/kg; ankle dorsiflexor, 2.75±0.70 N/kg; and VPT, 3.3±1.1.
A significant task effect was observed in the RMS values of the anterior–posterior angular velocity at the trunk (df=3; P<0.0001; hp 2=0.34), right ankle (df=3; P<0.0001; hp 2=0.35), and left ankle (df=3; P<0.0001; hp 2=0.38) levels. Post hoc tests show significant differences between Biodex-6 and all other tasks in each RMS value (Fig. 2). A trend of increasing RMS values between eyes open, eyes closed, and Biodex-8 was also noted for each variable (Fig. 2). Only the RMS of the left ankle showed a significant difference (P=0.034) between eyes open (0.38±0.19) and Biodex-8 (1.20±0.76).

Task complexity effect represented by the root mean square (RMS) values obtained at the trunk, right ankle, and left ankle levels for each of the four tasks (eyes open, eyes closed, Biodex-8, and Biodex-6). Significant (P<0.05) differences are indicated between *eyes open and Biodex-8, †eyes open and Biodex-6, ‡eyes closed and Biodex-6, and §Biodex-8 and Biodex-6.
The analyses of the anterior–posterior angular velocities between the trunk and both ankles show positive (in-phase) CCFs in the eyes open condition in 23 of the 25 patients and in all patients in the eyes closed condition. During the more complex tasks (Biodex at levels 8 and 6), the CCFs decreased significantly (P<0.0001), showing anti-phase (negative CCFs) behavior between the trunk and ankle levels (Fig. 3A), indicating that the trunk and ankles work in opposite directions. Both ankles show in-phase CCF results in the eyes open, eyes closed, and Biodex 8 conditions (Fig. 3B).
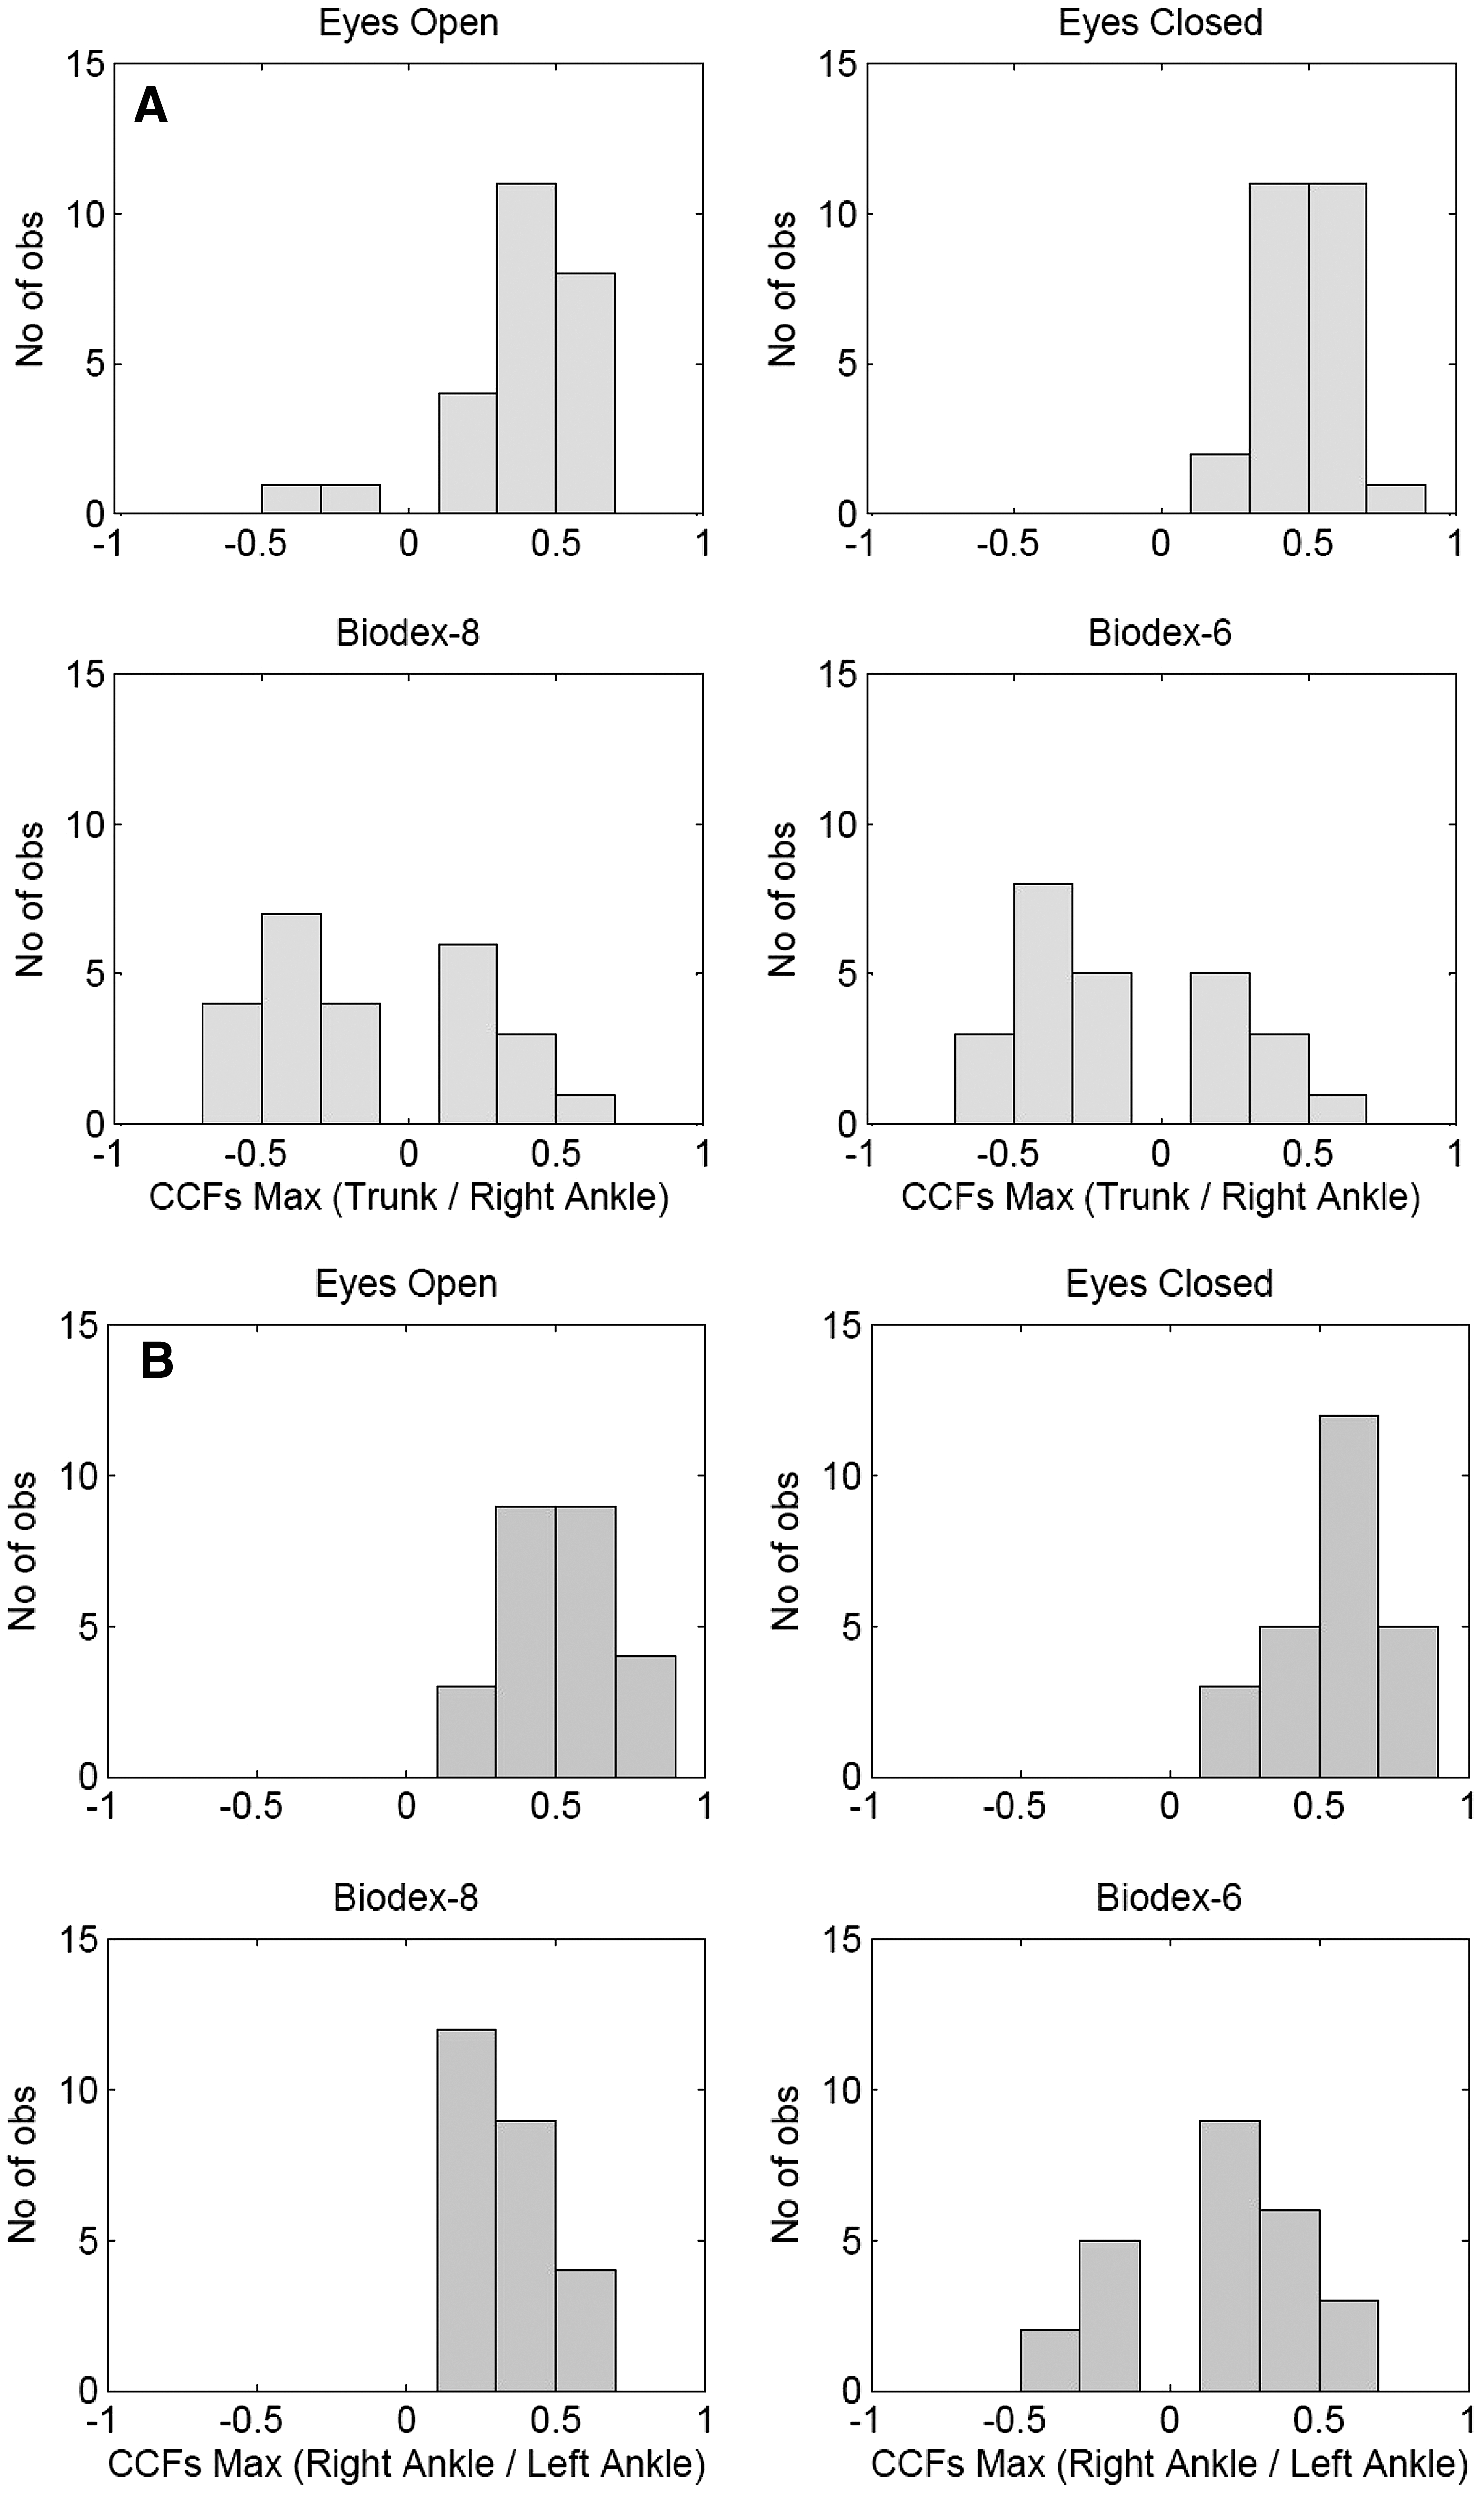
Number of observations (y-axis) of maximal values of the cross-correlation functions (CCFs Max) (x-axis) for each of the four tasks: (
Regarding the lag-time analyses between the trunk and ankle signals, 60% and 56% of the patients had both ankles preceding the movement of the trunk in the eyes open and eyes closed conditions, respectively. However, only 24% and 20% of the patients maintain the same strategies in Biodex-8 and Biodex-6, respectively. Hence, for 80% of the patients (20 of 25), the trunk moves ahead of the ankles during more complex tasks.
Significant correlations were observed between the level of PN (average of the VPT values for each patient) and muscle strength and both RMS values and CCFs (Table 1 and Fig. 4).

Scatterplots illustrating the relation between the level of sensibility (
Significant correlation (P<0.05).
CCF, cross-correlation function; LA, left ankle; PN, peripheral neuropathy; RA, right ankle; RMS, root mean square.
Discussion
The present study investigated the postural strategies in diabetes patients with PN using CCF analysis of the anterior–posterior angular velocities at trunk and ankle levels.
Because previous studies have already demonstrated the differences in the postural control between patients with PN and healthy subjects as well as the importance of PN in the postural instability of diabetes patients (see the review by Bonnet et al. 2 ), this study has only focused on the investigation of postural strategies in diabetes patients with different levels of PN. For this reason, we do not include a control group.
In the present study, two clinical factors associated with diabetes—the level of PN and muscle strength—were linked to postural strategies and instability during different standing tasks. We first observed that in diabetes patients with PN, the RMS of the angular velocities at the trunk and ankle levels increases as the task complexity increases. We further observed a diminution of the CCFs between both ankles, indicating that the ankles do not act in a perfectly symmetric manner to assure stability. The results show an increase in the time lag between both ankles with increasing task complexity. This result indicates that the ankles are not synchronously involved in the stabilization process but always have a minimum delay between them.
In a study conducted by Nardone et al., 17 the authors reported only a slight difference between simple and more challenging balance tasks in patients with PN; these investigators examined the difference in PN balance under static and dynamic conditions using CCFs of anterior–posterior displacements between reflective markers positioned at two levels: the head and one lateral malleolus. The same authors also investigated the difference among normal subjects, subjects with diabetes, and subjects with several PN conditions. They reported differences between normal and diabetes subjects and between diabetes subjects and those with PN, showing lower CCF values in PN groups. The most notable differences were under eyesclosed conditions. They also reported greater time lags delay between head and ankle in PN subjects compared with the normal group. 17 In the present study, we demonstrated significant difference between static and dynamic tasks. We reported an increase in signal variability using the angular velocity RMS between simple quiet standing tasks (eyes open and eyes closed) and standing on a mobile platform (Biodex-8 and Biodex-6). We also found a decrease in the maximum CCFs between signals as the tasks became more challenging. However, the results obtained by Nardone et al. 17 are not comparable with our results because they investigated the relation between the head and one ankle displacement and we highlighted the relation between the trunk and both ankles' angular velocities. Masani et al. 29 have shown different CCFs between the analysis of displacement or velocity, and they concluded that “postural control system during quiet stance adopts a control strategy that relies notably on velocity information.” Therefore, gyroscope sensors (measuring directly angular velocity) appear to be as an easy and accurate way to assess balance. 23
The results of the present study also highlighted the relation of the level of PN with postural strategies and instability. We demonstrated that the more complex the task, the greater the influence of the level of PN on diabetes patients' balance. In fact, although little or no correlation has been observed during the eyes open and eyes closed conditions, significant correlations of the level of PN with each RMS value have been found during the more destabilizing tasks (Biodex-8 and Biodex-6). These results show that as the level of PN increased, the instability measured by the RMS of the angular velocity also increase.
We had expected diabetes patients with PN to have asymmetric postural control that would increase with task complexity. In fact, as illustrated in Figure 3B, some patients use anti-phase strategies between both ankles under dynamic balance tasks, whereas others do not. In a study conducted by Bunderson et al., 30 the authors simulated asymmetric and symmetric feedback postural control using optimal control models. They demonstrated that, compared with a symmetric feedback, an asymmetric inter-joint feedback strategy has a positive impact on coordination by improving the endpoint control of the limb by 16%, reducing the energy cost by 21%, and increasing inter-joint coordination by 40%. The results obtained in the present study do not fully confirm our hypothesis and the one proposed by Bunderson et al. 30
The main limitation of this study is that the angular velocity was collected only in the sagittal plane. In fact, the multi-joint and muscle coordination involved in the equilibrium process does not simply act around the anterior–posterior axes but in every degree of freedom at each joint and for each muscle. Nevertheless, and as reported in a recent study, 31 no unique balance test can evaluate all the body mechanisms involved in postural balance control. The second limitation is that the patients included in this study were those able to fully complete the four standing tasks. This was done to ensure the highest sample size possible to investigate the relation between postural strategies and task complexity given selected clinical factors. However, it could have subestimated the correlations because the more unstable patients were excluded. Another limitation of this research is the small sample of patients. In this regard, we calculated the statistical power for all significant parameters detected in this study and found an average power of 100% using an α error level of 5%. This power analysis shows that the number of patients was enough to detect a difference if one exists.
The results of this study highlight the decrease in correlation between both ankles as well as the increase in anti-phase strategy between trunk and ankles during more challenging tasks in diabetic patients with PN. To our knowledge, this study is the first to have explored bilateral postural strategies using angular velocity through CCF analyses in diabetes patients with PN.
This study suggested that more the level of PN is important and the strength of muscles is impaired, the more the postural strategies and balance control will be affected. These factors should be taken into consideration in the management of balance deficits and risk of falling in the diabetes population.
Footnotes
Acknowledgments
This work was supported in part by the Fonds Québécois de la Recherche sur la Nature et les Technologies. We would like to thank Lara Allet, Ph.D. for data collection and all the patients for their participation.
Author Disclosure Statement
No competing financial interests exist.