




Abstract
Background:
Granulocyte-macrophage colony-stimulating factor (GM-CSF) is a pro-inflammatory cytokine with growth factor–like properties for monocytes and dendritic cells (DCs). In the present study, serum GM-CSF levels and the activation status of DCs were studied in type 2 diabetes mellitus (T2DM) subjects.
Methods:
Study subjects were recruited from the Chennai Urban Rural Epidemiology Study. Healthy controls (n=45) and T2DM patients (n=45) were included in the study. Serum levels of GM-CSF, interleukin-1β, interleukin-6, and tumor necrosis factor-α were measured. Enumeration of circulating DCs (myeloid [m] and plasmocytoid [p]) and its surface antigen expression were quantified by flow cytometry.
Results:
The serum GM-CSF levels were significantly higher among diabetes subjects compared with subjects without diabetes and showed a positive correlation with glycated hemoglobin (r=0.208, P=0.018). The serum GM-CSF levels were lower in subjects on combined insulin and oral hypoglycemic agents (OHA) treatment (1.09 pg/mL) compared with those taking OHA alone (1.9 pg/mL). The increased GM-CSF levels were associated with the activated phenotype of mDCs and pDCs, as determined by up-regulation of the lineage markers.
Conclusion:
The activated state of mDCs and pDCs seen among diabetes subjects might be due to the increased levels of GM-CSF and other pro-inflammatory cytokines.
Introduction
The most important function of GM-CSF in the immune system is its ability to generate dendritic cells (DCs) from myeloid progenitor cells. DCs serve as a first line of defense mechanism, polarizing the T helper (Th) cells and thereby linking innate and adaptive immunity. 11,12 In diabetes, conventional DCs polarize the Th cells toward pathogenic Th1 cells (which induce insulin resistance), whereas the tolerogenic DCs polarize them toward protective T-regulatory cells. 13 In the present study, the serum levels of GM-CSF and the activation state of peripheral DCs were studied in T2DM subjects.
Subjects and Methods
Study subjects
The study subjects were recruited from the Chennai Urban Rural Epidemiological Study (CURES), an ongoing epidemiological study conducted on a representative population (≥20 years old) of Chennai (formerly Madras), the fourth largest city in India. The methodology of the study has been published elsewhere.
14
In brief, in Phase 1 of the urban component of CURES, 26,001 individuals were recruited based on a systematic sampling technique with random start. Fasting capillary blood glucose was determined using the OneTouch® Basic glucometer (Lifescan, Johnson & Johnson, Milpitas, CA) in all subjects. Details of the sampling are described on our website (
The inclusion criteria were patients within the normal range of white blood cell count (4.0–10.0×10³/mL) to minimize the confounding effect of infection. The exclusion criteria were smoking, alcohol intake, and patients presenting with symptoms suggestive of type 1 diabetes defined as history of diabetic ketoacidosis, heavy ketonuria (3+), continuous requirement for insulin within 1 year of diagnosis, and poor insulin reserve as shown by C-peptide.
15
Also, patients with a previous diagnosis of urolithiasis, liver cirrhosis, congestive heart failure, chronic lung diseases, chronic infections
Anthropometric and biochemical measurements
Anthropometric measurements including height, weight, and waist circumference were obtained using standardized techniques as detailed elsewhere. 14 Blood pressure was recorded using a mercury sphygmomanometer (Deluxe BP apparatus, Diamond, Pune, India). Two readings were taken 5 min apart, and the mean of the two was taken as the blood pressure. Fasting plasma glucose (glucose oxidase–peroxidase method), serum cholesterol (cholesterol oxidase–peroxidase–amidopyrine method), serum triglycerides (glycerol phosphate oxidase–peroxidase–amidopyrine method), and high-density lipoprotein cholesterol (direct method; polyethylene glycol–pretreated enzymes) were measured using a Hitachi-912 autoanalyzer (Roche Diagnostics, Basel, Switzerland). The intra- and inter-assay coefficients of variation for the biochemical assays ranged between 3.1% and 7.6%. Low-density lipoprotein cholesterol was calculated using the Friedewald formula. The plasma concentrations of high-sensitivity C-reactive protein were measured by nephelometric assay. Leukocyte count was assessed using flow cytometry (model SF-3000, Sysmex, Kobe, Japan). In-kit quality controls were within an acceptable range.
Determination of cytokine levels by multiplex assay
The levels of cytokines (IL-1β, IL-6, TNF-α, and GM-CSF) in undiluted serum were estimated by the Bio-Plex™ multiplex cytokine assay system (Bio-Rad, Hercules, CA). The detection limits for the various cytokines were as follows: IL-1β, 2.7 pg/mL; IL-6, 2.31 pg/mL; TNF-α, 4.89 pg/mL; and GM-CSF, 0.67 pg/mL.
Flow cytometry
Peripheral blood cells (from NGT and T2DM patients) were incubated with DC lineage marker-specific monoclonal antibody at saturating concentrations. Red blood cells were lysed with BD lysing solution (BD Biosciences, San Jose, CA). The mouse anti-human monoclonal antibodies used in this study were fluorescein isothiocyanate–labeled anti-Lin (CD3, CD14, CD16, CD19, CD20, and CD56), allophycocyanin-labeled anti-CD11c, phycoerythrin-labeled anti-CD123, and peridinin-chlorophyll-protein-complex-labeled anti-HLA-DR. Monoclonal antibodies specific for the lineage markers Lin 1, HLADR, CD11c, and CD123 were used in all samples to gate on myeloid DCs (mDCs) and plasmocytoid DCs (pDCs). For analysis, 100,000 events were acquired per tube using a BD FACSCanto™ cytometer (BD Biosciences). Compensation was performed using BD CompBeads (BD Biosciences) for single-color controls, and unstained cells were used as negative controls. Data were analyzed using FlowJo software (Tree Star, Ashland, OR). Nonviable cells were excluded from analysis on the basis of forward and side scatter.
Statistical analysis
Student's t test and one-way analysis of variance were used to compare groups for continuous variables; the Mann–Whitney t test were used for parameters that did not show normal distribution. All the analyses were done using SPSS statistical package version 15.0 (SPSS, Chicago, IL) or GraphPad Prism version 5.0 (GraphPad, San Diego, CA), and in all comparisons a value of P<0.05 was considered significant.
Results
Table 1 shows the clinical and biochemical characteristics of the study subjects. Both the control and diabetes subjects were age and gender matched. The body mass index, systolic blood pressure, diastolic blood pressure, fasting plasma glucose, glycated hemoglobin, insulin resistance by homeostasis model of assessment, and high-sensitivity C-reactive protein levels were significantly higher in T2DM subjects compared with NGT subjects. All the diabetes subjects were receiving treatment. Eighty percent of the diabetes subjects were taking oral hypoglycemic drugs, whereas the remaining 20% were taking insulin and oral hypoglycemic drugs.
Data are mean±SD values, geometric mean (range) values, or geometric mean as indicated. P values were adjusted for age.
Subjects taking insulin were excluded for calculation of insulin resistance using the insulin resistance by homeostasis model of assessment (HOMA-IR) formula.
DC, dendritic cell; GM-CSF, granulocyte-macrophage colony-stimulating factor; IL, interleukin; mDC, myeloid dendritic cell; MFI, mean fluorescence intensity; NGT, normal glucose tolerance; OHA, oral hypoglycemic agents; pDC, plasmocytoid dendritic cell; T2DM, type 2 diabetes mellitus; TNF-α, tumor necrosis factor-α.
Next we estimated the levels of GM-CSF and other pro-inflammatory cytokines in NGT and T2DM subjects. The level of GM-CSF was significantly elevated in T2DM (geometric mean, 1.28 pg/mL) compared with NGT subjects (geometric mean, 0.69 pg/mL) (P=0.009) (Table 1). When the T2DM subjects were stratified based on glycemic control, GM-CSF levels were higher in those with poor control (glycated hemoglobin>7%) (P=0.03) compared with those with good glycemic control (glycated hemoglobin ≤7%). Apart from GM-CSF, IL-1β, IL-6, and TNF-α levels were also significantly elevated in T2DM subjects compared with the NGT group (Table 1). GM-CSF levels showed significant correlation with IL-1β (r=0.374, P<0.001), IL-6 (r=0.468, P<0.001), and TNF-α (r=0.639, P<0.001) levels.
Next the effect of drug regimen on serum GM-CSF levels was studied (Supplementary Fig. S1; Supplementary Data are available online at
We next enumerated both mDCs and pDCs in the peripheral blood of NGT and T2DM subjects. The non-DC population was excluded based on lineage-positive (CD3+, CD14+, CD16+, CD19+, CD20+, and CD56+) gating. The mDC subset was identified by gating on CD11c+ HLA− DR+ cells, whereas pDCs were identified as CD123+ HLA-DR+ cells (Fig. 1a and b and Supplementary Fig. 2). We found that CD11c+ mDC population constitutes the vast majority of the total DC population in all groups. In spite of T2DM subjects having significantly high levels of serum GM-CSF, no significant difference was noted in the percentage of mDCs and pDCs between the groups: for mDCs, NGT and T2DM geometric mean, 5.16% and 5.32%, respectively (P=0.80); for pDC, NGT and T2DM geometric mean, 1.22% and 1.54%, respectively (P=0.73) (Table 1). No major difference was seen between the insulin+OHA and OHA-alone treatment groups with respect to DC count.
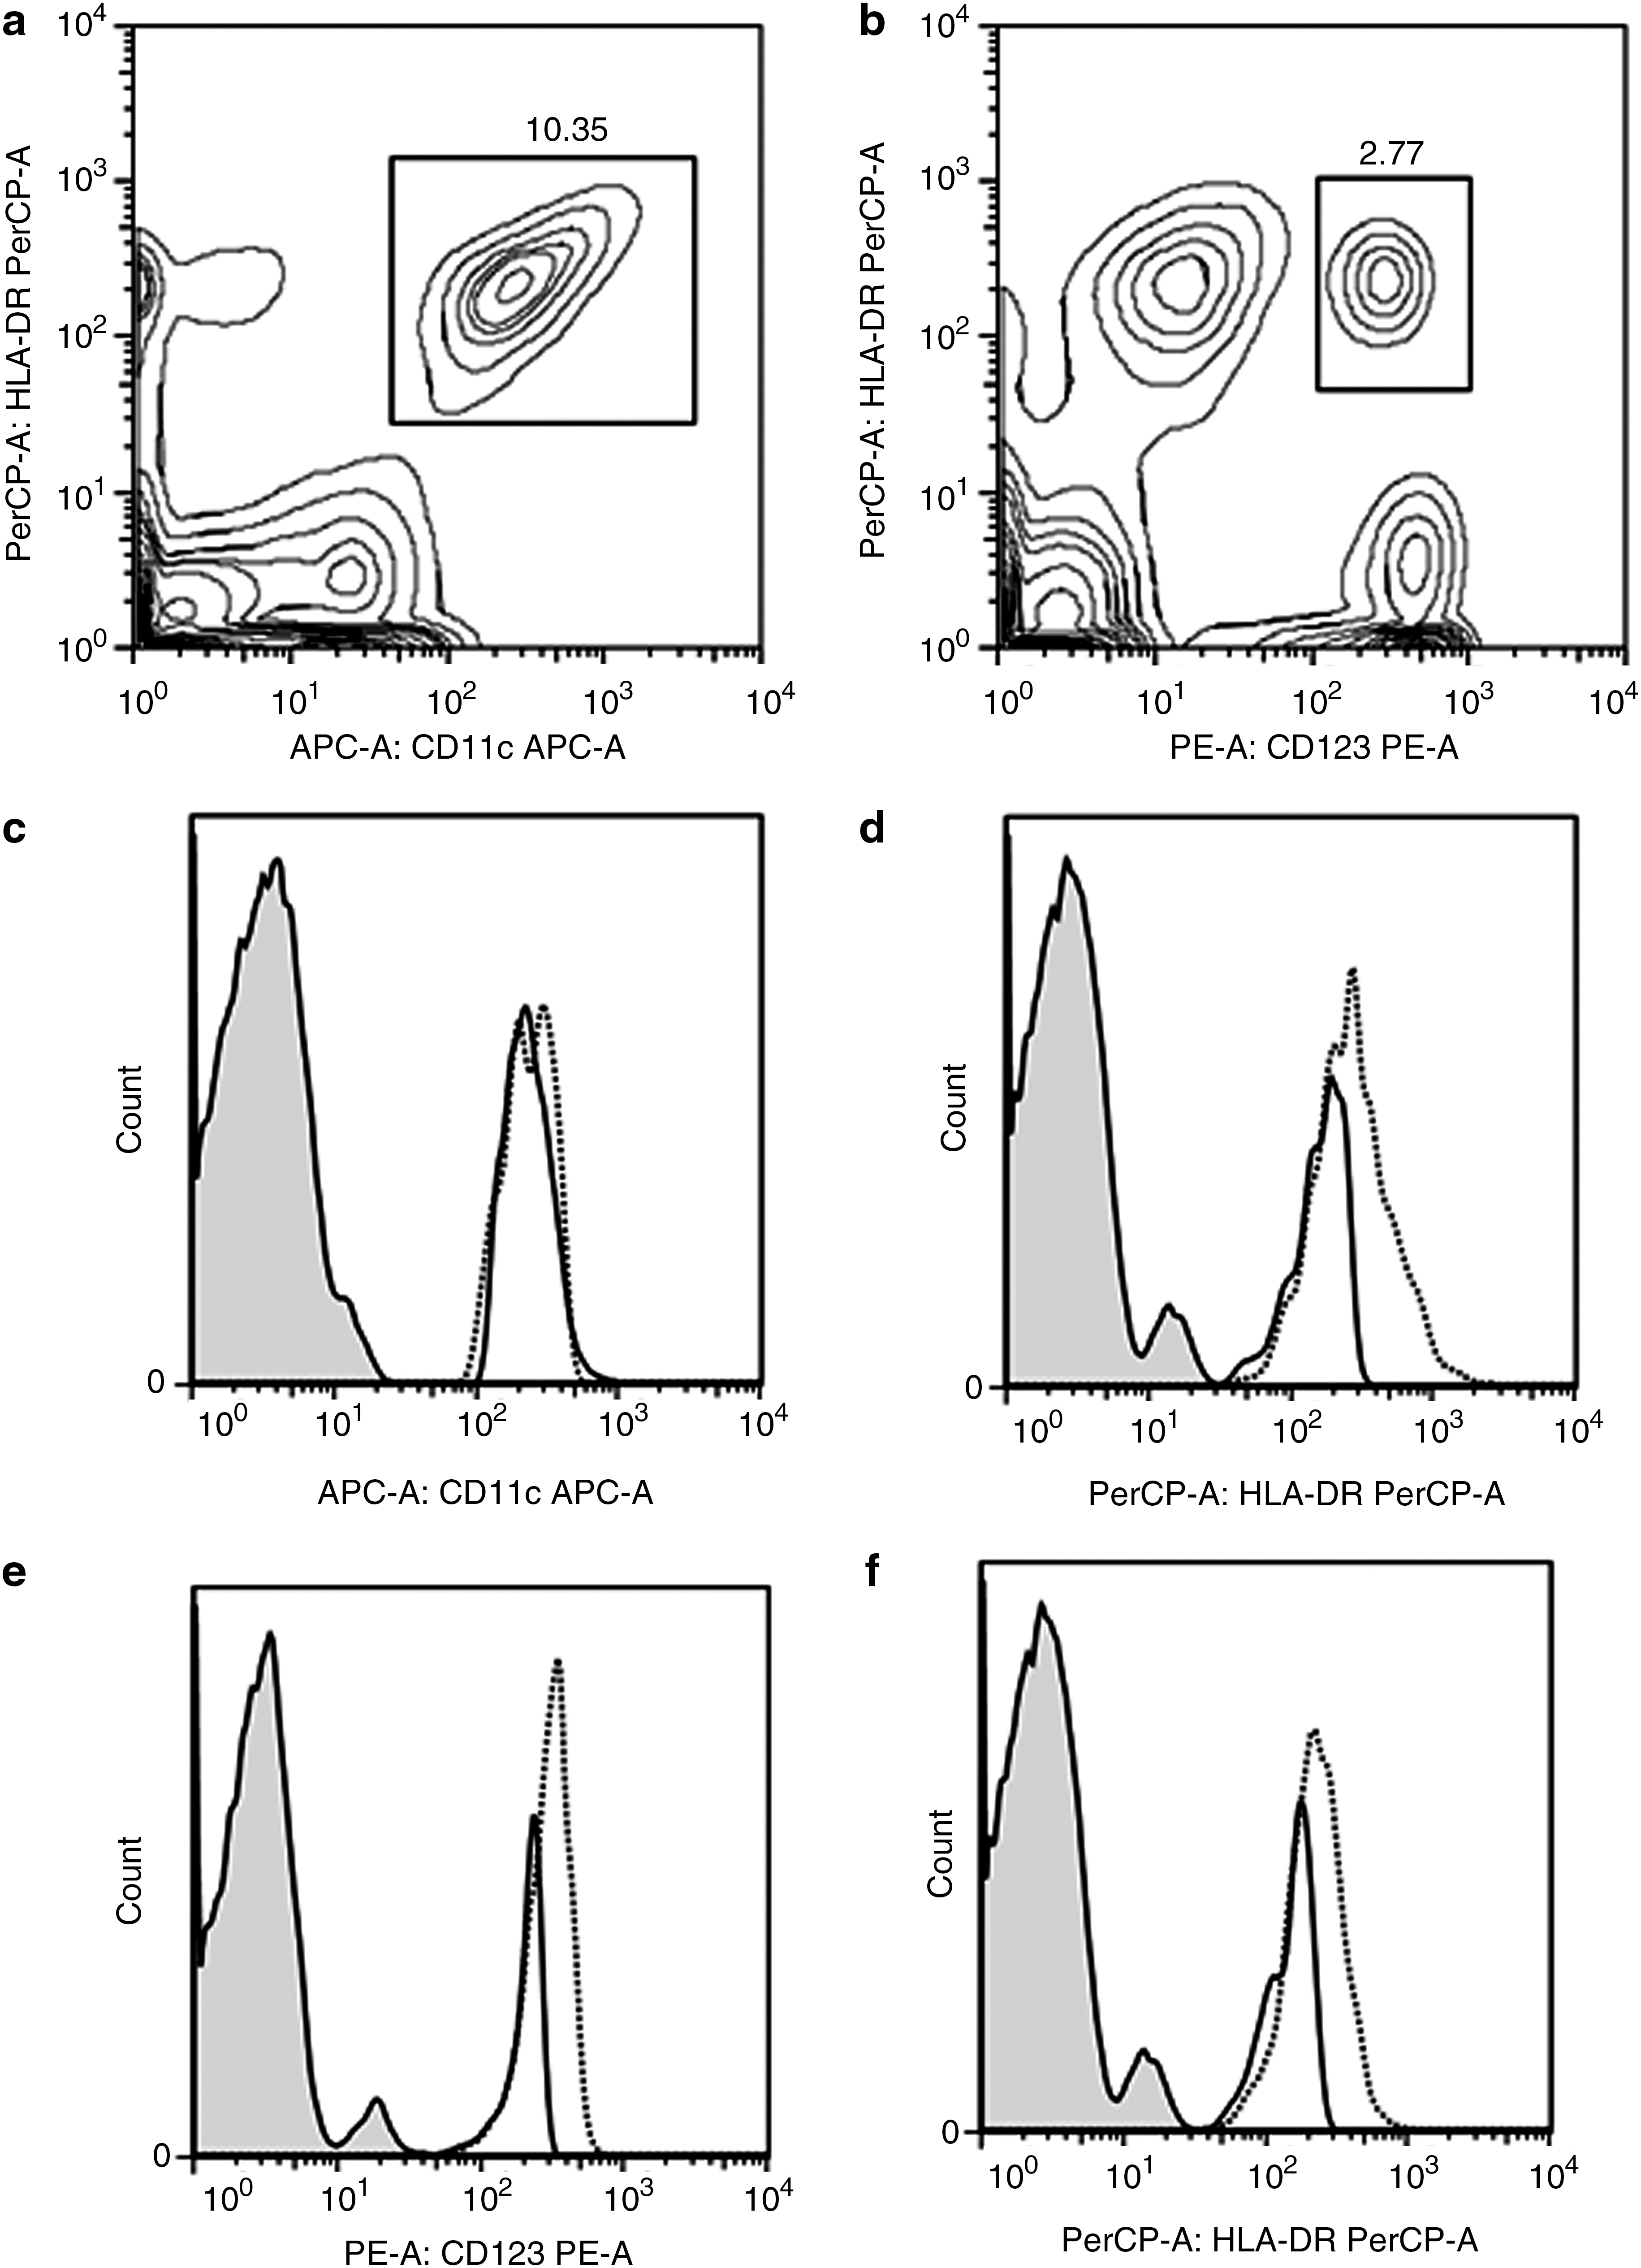
Representation of the gated analysis done to identify the myeloid and plasmocytoid dendritic cell populations in peripheral blood leukocytes from normal glucose tolerance (solid lines) and type 2 diabetes mellitus (dotted lines) subjects. Lin− (CD3−, CD14−, CD16−, CD19−, CD20−, and CD56−) cells were gated to identify the (
Next, the mean fluorescence intensity of the surface antigens on the two DC subsets was studied. Modest up-regulation of CD11c was observed in the mDCs of T2DM subjects, even though it did not attain statistical significance (Fig. 1c). Significant up-regulation of CD123 was noted on the pDCs of T2DM subjects compared with NGT subjects: NGT and T2DM mean fluorescence intensity, 112.6 and 197.1, respectively (P=0.002) (Fig. 1e). HLA-DR was significantly up-regulated in both mDCs (Fig. 1d) and pDCs (Fig. 1f) in T2DM subjects compared with NGT subjects: NGT and T2DM mDC-HLA-DR mean fluorescence intensity, 108.3 and 194.2, respectively (P=0.006); NGT and T2DM pDC-HLADR mean fluorescence intensity, 83.5 and 122.6, respectively (P=0.009) (Table 1). Again, no major difference was seen between the insulin+OHA and OHA-alone treatment groups with respect to expression of DC markers.
Discussion
Even though few previous reports have looked at peripheral DC count in T2DM, until now the role played by GM-CSF in T2DM and its association with peripheral DC count has not been addressed. 16 –19 The current study provides three novel findings: (1) T2DM subjects had significantly high levels of serum GM-CSF compared with NGT subjects, which correlated well with glycated hemoglobin. On attaining good glycemic control, the GM-CSF levels tend to decrease toward normal values. (2) In diabetes subjects, the level of GM-CSF was lower in those who were taking OHAs+insulin compared with those taking OHAs alone. (3) The increase in serum GM-CSF levels was associated with a parallel increase in the partial activation state of DCs. It is well known that insulin has anti-inflammatory properties, 20 and decreased levels of GM-CSF in the insulin+OHA treatment group compared with those taking OHAs alone is expected.
GM-CSF is well known for its ability to increase DC maturation and function. 8,9 In our study, the systemic increase in GM-CSF levels was associated with activation of both pDCs and mDCs as determined by the up-regulation of most of the lineage markers. In parallel with the increased serum GM-CSF levels, partial activation state of DCs was also observed. Our results are in agreement with those of Summers et al., 16 who reported near normal numbers of both mDCs and pDCs among diabetes subjects. In contrast, Corrales et al. 17 reported increased levels of both mDCs and pDCs, whereas others have reported reduced numbers under diabetes conditions. 18,19 However, no data are available on the high-risk Indian population. In general, all the studies have reported poor expression of cytokines in DCs following stimulation under diabetes conditions. Overall, our study and other studies report malfunctioning of DCs in T2DM subjects, which might be a potential contributing factor for reduced immunity toward infections in diabetes.
In our study, diabetes subjects have a wide range of cytokine values, which has already been reported by us and others. 21 There could be several reasons for these variations: (1) The diabetes population included both obese and lean diabetes subjects, and it is well known that the immune profiles in these two groups are different. (2) All the diabetes subjects were receiving treatment, and hence differences in the treatment modalities could also account for these wide variations. 22 (3) Finally, the duration of diabetes varied from 1 month to 32 years in the diabetes mellitus group, and it is well known that the duration of diabetes can in fact affect the cytokine profile. 23 Our study was a cross-sectional one, so it is not possible to discern cause and effect using this study design. The significance of the study is that for the first time, the role played by GM-CSF in T2DM was studied under ex vivo conditions and was correlated with DC maturation in a high-risk ethnic population for diabetes. The increased serum GM-CSF along with other pro-inflammatory cytokines (TNF-α, IL-1β, and IL-6) might account for the activated state of mDCs and pDCs seen among diabetes subjects.
Footnotes
Acknowledgments
We are grateful to the Chennai Willingdon Corporate Foundation, Chennai, India, for the financial support provided for the study. J.S. acknowledges the Lady Tata Memorial Trust for a junior research fellowship. We thank the epidemiology team members for conducting the CURES field studies. This is the 99th publication from CURES (CURES-99).
Author Disclosure Statement
No competing financial interests exist.
References
Supplementary Material
Please find the following supplemental material available below.
For Open Access articles published under a Creative Commons License, all supplemental material carries the same license as the article it is associated with.
For non-Open Access articles published, all supplemental material carries a non-exclusive license, and permission requests for re-use of supplemental material or any part of supplemental material shall be sent directly to the copyright owner as specified in the copyright notice associated with the article.
