




Abstract
Objective:
This study was designed to develop predictive formulas for precise insulin dosing in young children with type 1 diabetes (T1DM).
Research Design and Methods:
Consecutive 1-year data from a group of 14 young patients (eight girls, six boys) 3.9±0.8 years old with diabetes duration of 2.0±0.8 years, transitioned from multiple daily injections (MDI) to continuous subcutaneous insulin infusion (CSII), were analyzed to identify parameters governing optimal insulin dosing. Body mass index (BMI), total daily dose (TDD), total basal dose, insulin-to-carbohydrate ratio (ICR), correction factor (CF), and mean amplitude of glycemic excursion (MAGE) by continuous glucose monitoring and hemoglobin A1c (HbA1c) level were evaluated at baseline and every 3 months. The slopes of CF versus 1/TDD, bolus versus TDD, ICR versus 1/TDD, and CF versus ICR were determined.
Results:
Kids Insulin Dosing System (KIDS) slope constants at follow-up were associated with MAGE compared with baseline (P<0.0001) without significant changes in BMI (16.6±1.5 vs. 16.7±1.4 kg/m2) and HbA1c values (8.0±0.50% vs. 7.8±0.40%). The relationship between CF and TDD changed significantly during CSII compared with baseline MDI (P<0.0001), whereas the coefficients for ICR and TDD relationship remained relatively unchanged. The KIDS formulas estimated TDD=0.74×body weight, total basal dose=0.28×TDD, CF=2,800/TDD, and ICR=13.5×body weight/TDD.
Conclusions:
The interrelationships among ICR, CF, TBD, and TDD remained stable on CSII and were accompanied by decreased glycemic excursions. The KIDS formulas may yield consistent and easy estimates of insulin dosing factors in very young patients with T1DM.
Introduction
The formulas for estimating ICR and CF were derived from retrospective and prospective observations of adult type 1 diabetes mellitus (T1DM) patients treated with CSII. 1 –3 It has been shown that hemoglobin A1c (HbA1c) does not correspond to daily BG variability evaluated by continuous glucose monitoring (CGM). 4 –6 Indeed, BG excursions as measured by mean amplitude of glycemic excursion (MAGE) were found to correlate with bolus:basal insulin ratio and hypoglycemic events independent of age, mean BG, and glycemic control. 7,8
Although daily glucose trend analyses and treatment adjustment using CGM have been used to derive insulin dose estimation formulas in adults with T1DM, 9,10 there are currently no optimal dosing guidelines for young children with T1DM. Therefore, the aim of this study was to derive formulas for estimation of optimal basal insulin, ICR, and CF in young children with T1DM who had undergone CGM evaluation during CSII over a 1-year period. 11 We designated these formulas as Kids Insulin Dosing System (KIDS).
Subjects and Methods
Fourteen children (eight girls, six boys) 2.2–5.5 years old with a duration of diabetes of 1.0–3.3 years were recruited from the Children's Hospital of Wisconsin, Milwaukee, WI, for a 1-year prospective study as previously published. 11 Parents/guardians were required to provide constant supervision and monitor BG levels at least four times a day. Prior to initiation of CSII, all patients received insulin MDI consisting of mealtime aspart (Novolog®, Novo Nordisk Pharmaceuticals, Inc., Princeton, NJ) and bedtime glargine (Lantus®, Sanofi-Aventis Pharmaceuticals, Inc., Bridgewater, NJ) insulin and applied principles of mealtime carbohydrate adjustment using ICR and CF. Patients were evaluated every 3 months during visits to the Diabetes Clinic.
Baseline and 1-year prospective data were collected on CSII therapy using meter download logbooks and the CGM system. At each clinic visit, height, weight, body mass index (BMI), and HbA1c were obtained, and the number of moderate (BG<60 mg/dL [<3.3 mmol/L] with or without behavioral impairment) and severe (BG<50 mg/dL [<2.8 mmol/L] associated with unconsciousness with or without seizure) hypoglycemic episodes in the preceding 3 months and during the study was determined as previously reported. 11 This study was approved by the Children's Hospital of Wisconsin Institutional Review Board, and informed consent for participation in the study was obtained from parents/guardians of patients.
Insulin dosage calculations and HbA1c determination
All patients were started on a Medtronic/MiniMed (Northridge, CA) insulin pump, and parents/guardians received extensive training on the use of pump use and its risks, including catheter site infection, hyperglycemia, hypoglycemia, ketosis and diabetic ketoacidosis, and potential mechanical problems (i.e., kinked infusion sets, air bubbles, and dislodged tubing).
Aspart insulin was used in all pumps. Baseline TDD for CSII was calculated from the 1-week average of the previous TDD (aspart+glargine regimen). The insulin glargine dose was used for basal rates, and the remainder was used for bolus dosing. An initial insulin dosage algorithm was individualized in most patients during the year to accommodate variable insulin sensitivity. The premeal BG target was established at 80–150 mg/dL at 2 h postprandial with the target glucose (TG) of 180 mg/dL.
HbA1c was determined using the Bayer DCA 2000 instrument (Bayer Diagnostics Inc., Tarrytown, NY), with a range in those without diabetes of 4.5–5.7%.
CGM system
Baseline and quarterly CGM system (MiniMed CGMS® System Gold) tracings were obtained every 3 months for 1 year in each patient. Patients performed at least four self-monitoring of BG (SMBG) tests per day and entered these values into the CGMS monitor to obtain correlation coefficients between the SMBG and the CGMS values. All patients/guardians were blinded to the CGMS data. The CGMS tracings were deemed accurate if (1) the correlation coefficient between the paired sensor and meter readings was above the cutoff point of 0.79 and (2) the mean absolute difference of sensor and meter readings was below 28%.
In addition, detailed accounts of time and quantity of carbohydrate contents of food and insulin doses, as well as symptoms and duration of hypoglycemic events, were recorded by families. The CGMS tracings ranged from 5 to 6 days, and mean BG (MBG) and MAGE were used to assess BG variability in patients with T1DM as previously described. 12,13
Statistical analysis
Our primary outcome was an observed percentage change in HbA1c. With 13 T1DM children, we had 80% power to detect a difference of 0.3 (α=0.05) in HbA1c between baseline and 1.0-year follow-up. 14 The reported values represent the mean±SD. Baseline and 1.0-year follow-up characteristics were compared with paired t test and χ 2 analyses, and when differences were found, they were controlled for in further analyses. The HbA1c data were analyzed using a paired-samples t test. The number of MBG, MAGE, and frequency and duration of hypoglycemic events were analyzed using a repeated-measures analysis of variance with a test for trend over time.
The slopes of the CF versus 1/TDD, bolus versus TDD, ICR versus 1/TDD, and CF versus ICR were determined. Linear and nonlinear least squares were used to fit the models. The models for all five time points (baseline and 3, 6, 9, and 12 months) were assessed separately. However, the models at 6 months and at 12 months were not significantly different. Hence, a longitudinal error structure with an autoregressive model for the repeated measures at 6 months and 12 months was used to increase precision. This was used to combine data from the two time points (6 and 12 months). A linear model was created for drawing the nomogram. 15 No intercept models (autoregressive error structure) were created to determine the quick formulas for some important measures. Analysis of variance was used to test the difference of the slopes and other variables. Using an autoregressive model for repeated measures at 6 and 12 months, a linear model for drawing the nomogram was created. P<0.05 was considered significant.
Results
Clinical and biochemical characteristics of 14 children (eight girls, six boys) with T1DM at baseline, 6 months, and 1 year after initiation of CSII are shown in Table 1. BMI, MBG, HbA1c, and number and mean of hypoglycemic events were not significantly affected after 1 year of CSII, whereas HbA1c was marginally decreased. However, MAGE values were significantly lower at the 6- and 12-month follow-up visits compared with baseline values despite similar number of BG excursions (P<0.0001).
Data are mean±SD values.
P<0.003, b P<0.0001, baseline versus 6 and 12 months.
BG, blood glucose; BMI, body mass index; HbA1c, hemoglobin A1c; MAGE, mean amplitude of glycemic excursion; MBG, mean blood glucose; NS, not significant; NTG, non-target glucose; TG, target glucose.
Table 2 summarizes mean TDD, bolus and basal insulin between TDD, ICR, and CF at baseline, 6 months, and 1 year after initiation of CSII. Table 2 also displays the interrelationships of TDD and ICR with CF and bolus and basal insulin. The coefficients of the hyperbolic equations are shown; these were used to obtain the quick formulas, which essentially stabilized at 6 months. The observed and predicted CF values changed significantly at 6 and 12 months compared with baseline (P<0.001), as did the bolus insulin and TDD (P=0.03). The R 2 (e.g., 0.97 or 97% for CF vs. 1/TDD) shows how well the equation describes the data (the maximum possible is 100% for a perfect fit). CF was independent of body weight. On the other hand, the coefficients for the ICR and TDD and the CF and ICR relationships remained relatively unchanged at the three time points. In addition, the observed CF values showed individual variability independent of body weight (P=0.42).
Data are mean±SD values.
P<0.0001, b P<0.05, baseline versus 6 and 12 months.
BW, body weight; CF, correction factor; ICR, insulin-to-carbohydrate ratio; NS, not significant; NTG, non-target glucose; TDD, total daily dose; TG, target glucose.
Figure 1 is the nomogram that was developed from 6- and 12-month data. This three-line nomogram consists of CF/TDD, ICR, and body weight parallel lines from left to right, respectively. The dotted line is a sample patient with body weight=17.2 kg, TDD=11.5 units, ICR=1 unit/22 g, and CF=1 unit/250 mg/dL.
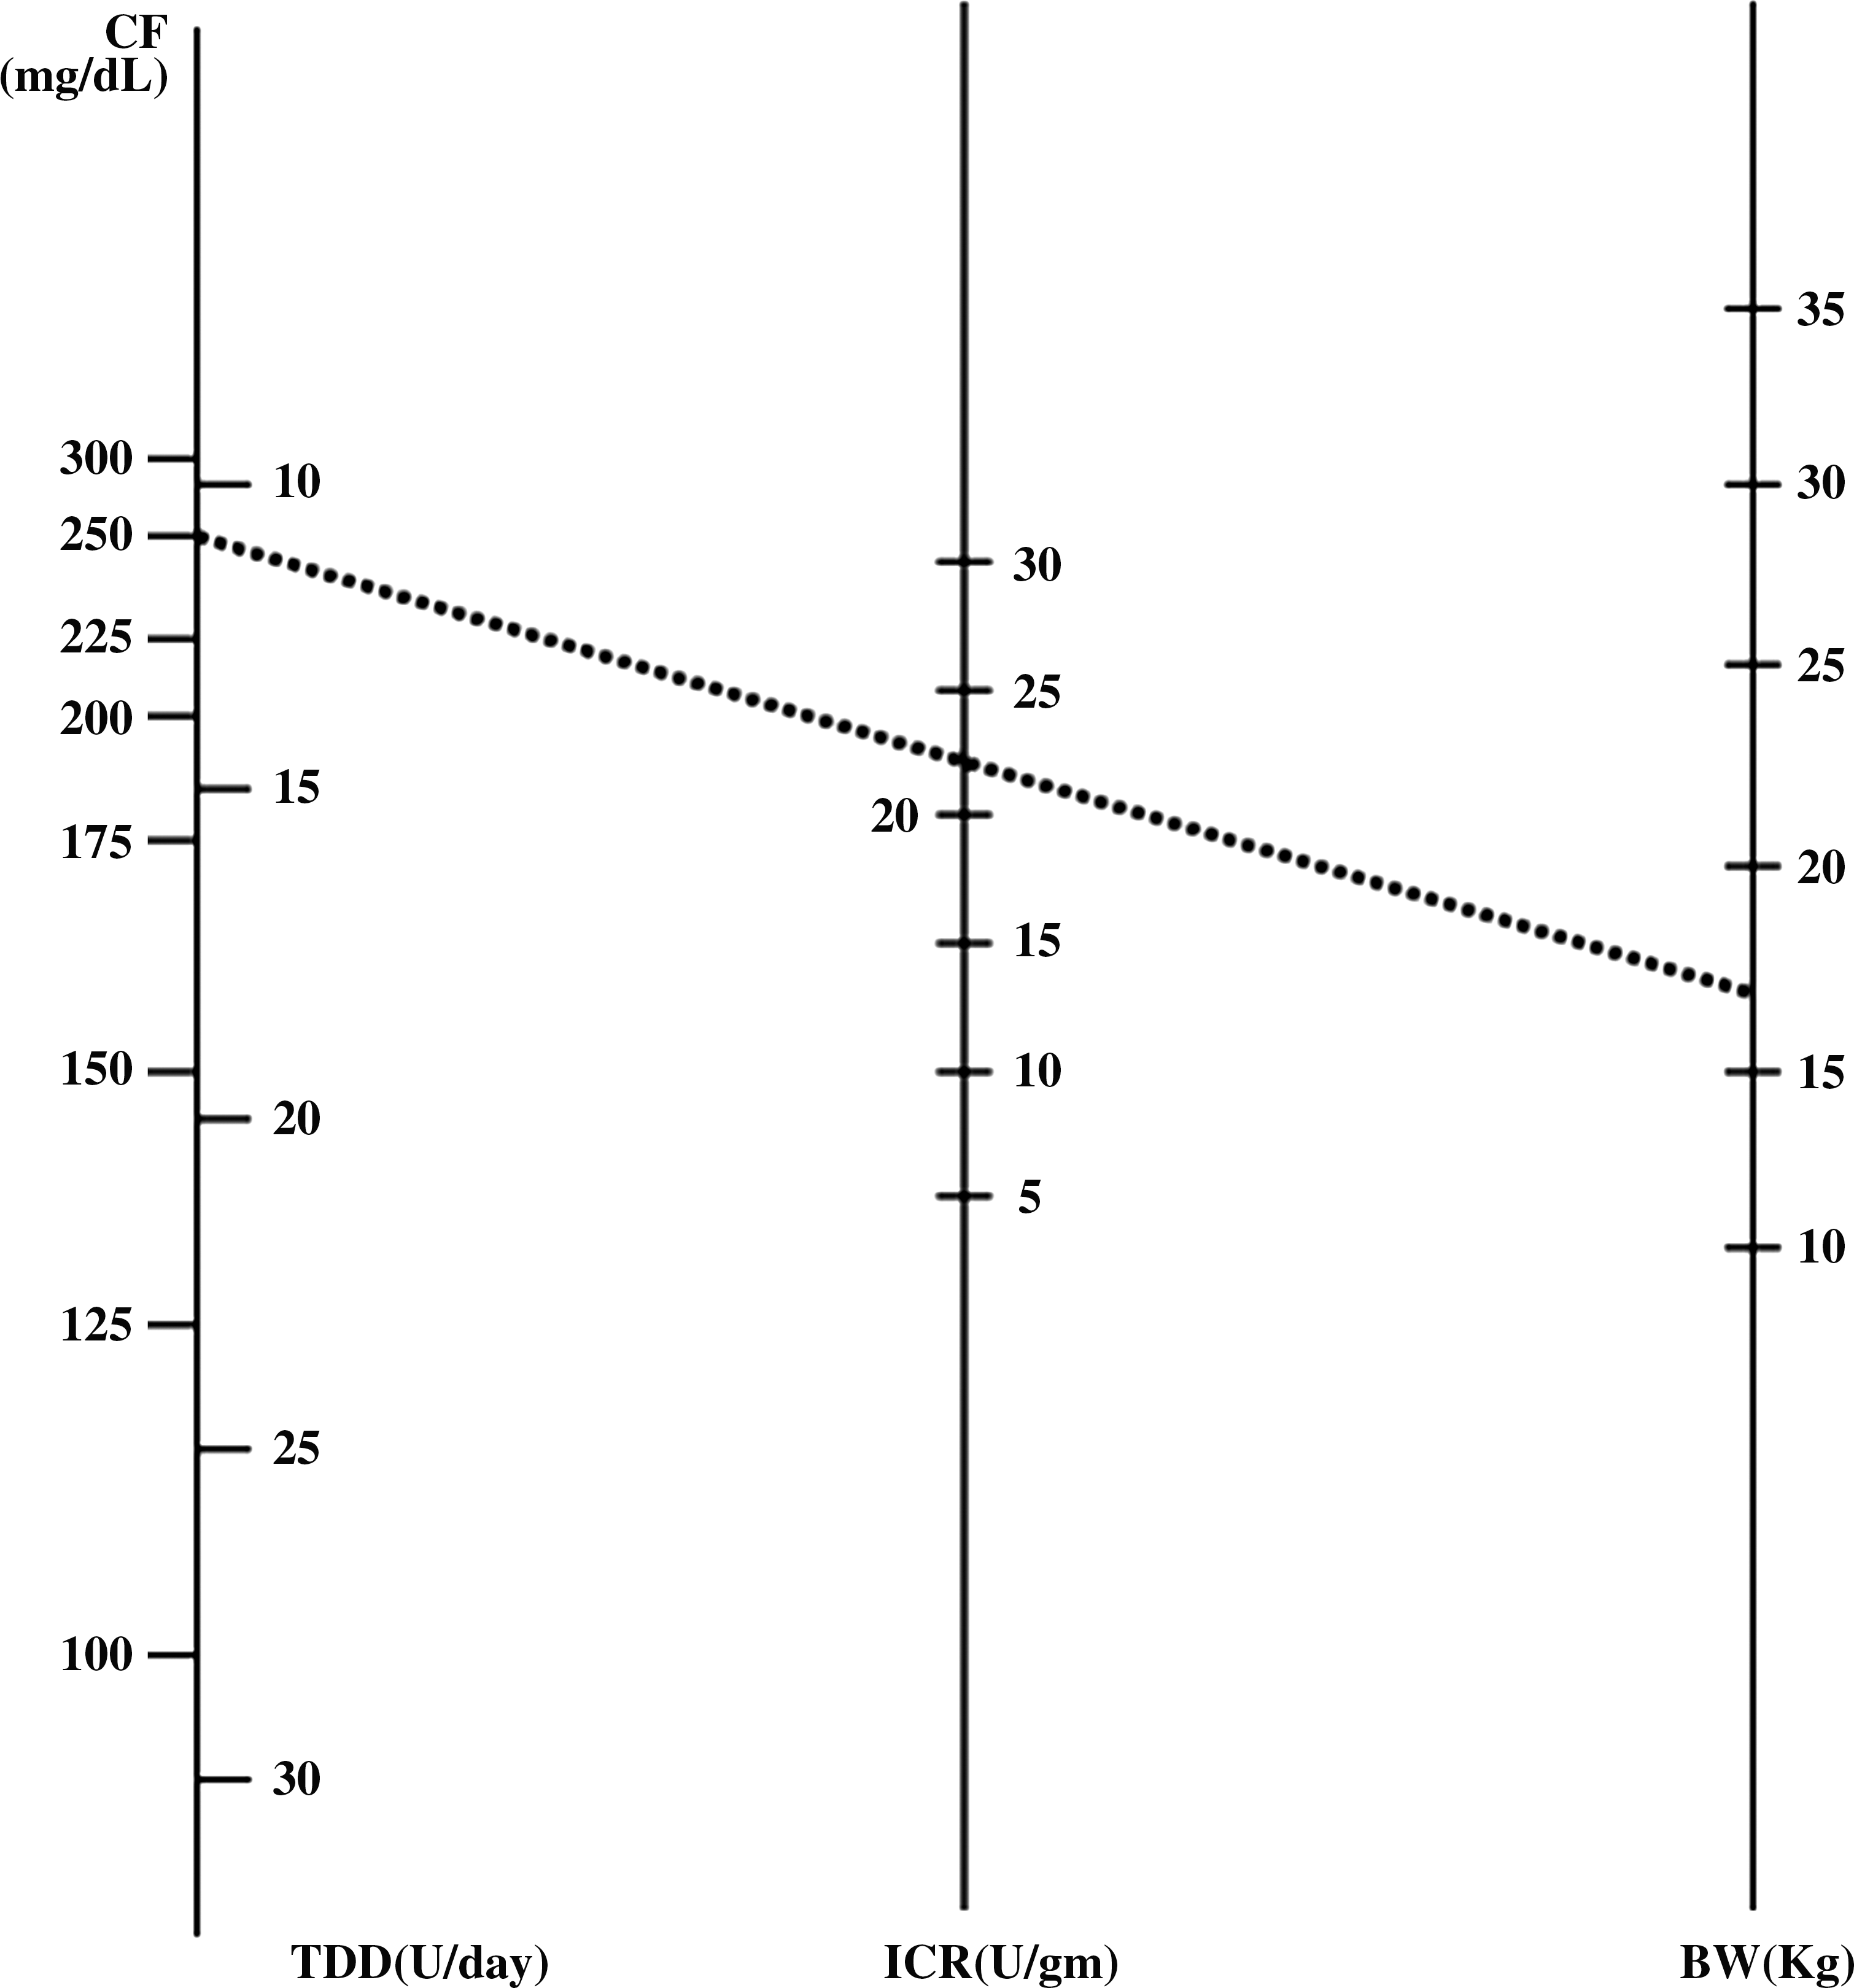
Nomogram plot. A sample patient is shown by the dotted line. BW, body weight; CF, correction factor; ICR, insulin-to-carbohydrate ratio; TDD, total daily dose.
The exact computations for the nomogram were developed based on the 6- and 12-month data and included the body weight using a log transform of the hyperbolic model, which was then transformed back to the original coordinates. Total daily insulin or TDD was estimated at 0.74 U×body weight with basal dose of 0.28 U×TDD. The ICR model was estimated as ICR=28.9+(0.43×body weight)−(1.24×TDD) with the ICR quick formula=13.5×body weight/TDD. The CF was estimated as CF=2,841.2/TDD with the quick CF formula=2,800/TDD.
Discussion
In our study, interrelationships among ICR, CF, basal insulin, and TDD remained stable on CSII and were accompanied by decreased BG excursions. This study included very young normal weight children with T1DM. These predicted formulas for estimation of insulin dosing parameters may be generalized to preschool-aged children.
In this study, insulin pump therapy decreased glycemic instability without further improving HbA1c or altering frequency and duration of hypoglycemic events in a group of young children with T1DM as previously published. 11 Lack of glycemic improvement and reduction in hypoglycemia in our patients may suggest significant diabetes management challenges in young patients as it relates to variable levels of physical activity, food intake, and changing insulin sensitivity in a growing child. 16 It may also suggest that families could not maintain the same level of interest despite frequent contacts with the diabetes team for education and support throughout the study. However, we observed significant reduction in glucose variability as expressed by MAGE as previously shown. 17
During insulin pump therapy, the basal and bolus dosing factors remained stable except for comparison with baseline. This suggests that improved BG stability resulted in improved estimation of insulin sensitivity. In our study, ICR and CF dosing formulas derived from patient data are markedly different from those reported previously in well-controlled T1DM adults treated with CSII. 1 –4 This is the first study attempting to estimate insulin dosing formulas in young children using CGM. Although the glycemic control as measured by HbA1c was not significantly improved, reduction in BG variability allowed for consistent estimation of ICR and CF formulas in this prospective study. However, we were not able to achieve consistently target postmeal BG levels, which may explain absence of improved glycemic control. There was no significant difference between ICR and CF between mealtimes as previously shown, 18 whereas some have suggested higher bolus insulin requirement especially in the morning due to the dawn phenomenon 19 or inadequate glucose control prior to the meal. 20
In our cohort, we found strong relationships among 1/TDD, basal dose, ICR, and CF. Therefore, any adjustment in any insulin dosing factor may require modification in other factors. Indeed, these findings were similar to that found in a study by King and Armstrong 2 that derived insulin dosing formulas from a 2-week prospective study in T1DM adults. The vast differences between KIDS formulas and those used in older patients are primarily due to lower BMI but also higher insulin sensitivity in children.
The limitations of the study included (1) the small sample of children, (2) exclusion of pubertal children, and (3) use of standard CGM instead of real-time CGM. However, we used insulin dose data from repeated visits and evaluated in-between meals SMBG data for postmeal glucose adjustments. In addition, development of insulin dosing formulas is a greatly needed tool due to the rising incidence of T1DM in very young children 21 and their unique insulin requirement in order to minimize BG instability and hypoglycemic events. Finally, the use of the KIDS nomogram can save time, increase accuracy, help patients/guardians understand relationships between various dosing factors, and help teach other clinicians.
In conclusion, our data support specific insulin dosing formulas for young children with T1DM. The KIDS formulas can yield consistent and easy estimates of insulin dosing factors in very young patients with T1DM. Nevertheless, insulin dosing requires clinical judgment and optimal BG monitoring because the formulas may vary widely from the observed findings.
Footnotes
Acknowledgments
The previous study cited by Alemzadeh et al. 11 was funded by NovoNordisk Pharmaceuticals, Inc. and Medtronic, Inc.
Author Disclosure Statement
R.A. researched data and wrote the manuscript, R.H. helped design and performed the study design biostatistical analyses and contributed to the manuscript, M.D. researched data and performed statistical analysis, and E.P. researched data and wrote and edited the manuscript. No competing financial interests exist.