
Abstract
Background:
Exercise is of great value for individuals with diabetes in helping to control their hemoglobin A1c levels and in increasing their insulin sensitivity. Delayed-onset muscle soreness (DOMS) is a common problem in healthy individuals and in people who have diabetes. People with diabetes are also faced with metabolic and endothelial impairments, which could make DOMS even worse. But because they usually have neuropathies, they may not feel this soreness appropriately, leading to premature return to exercise and causing further injuries.
Research Design:
One hundred eighteen subjects participated in this study and were divided into four groups. Two groups (healthy and diabetes) performed a series of abdominal exercises, and the other two groups (healthy and diabetes) performed a series of arm exercises to induce DOMS. Skin temperature above the muscle was assessed using a thermal infrared camera, and perceived soreness of the exercised muscle was assessed using a 100-mm visual analog scale. Serum myoglobin concentrations were also measured.
Results:
There was a significant increase in skin temperature 24 h post-exercise for all four exercise groups (P<0.05), where the combined average increase in skin temperature for all four groups was approximately 0.65°C from baseline. Also, 24 h post-exercise, all four groups were significantly sorer than they were at baseline (P<0.05). Serum myoglobin levels were also significantly higher on day 3 compared with day 1 (P<0.05).
Conclusion:
Infrared thermal imaging may be a valuable technique of seeing which muscles are sore hours or even days after the exercise is over. Thus, thermal imaging would be an efficient and painless way of looking at DOMS in both healthy individuals and individuals who have diabetes, even if they are facing neurological problems.
Introduction
Much is known about DOMS in young people, but little is known about DOMS in people with diabetes. However, there may be some comparisons that can be made from studies of DOMS and aging. 8 Studies have shown that there is reduced proteolytic activity and an elevated production in free radicals in older individuals. 8,9 This elevation prolongs healing time after excessive exercise. 8 With metabolic impairments, endothelial dysfunction, and higher levels of free radicals in people with diabetes, 10,11 DOMS could be more severe and recovery periods could be longer in this population.
DOMS generally presents itself as initial soreness that starts within 24 h of heavy exercise, where its associated symptoms can range from slight muscle tenderness to severe debilitating pain. 12 –14 The severity of the symptoms depends on several factors, including the fitness of the individual, their age, genetics, training, and the intensity of the activity. 15 The peak discomfort from muscle damage occurs between 24 to 72 h post-exercise, but the symptoms may continue as much as 7 days post-exercise until they begin to diminish. 7,16 For this reason, DOMS is one of the most common recurrent forms of sports injury that can affect an individual's performance and become intimidating for many. 5,17
For the last 3 decades, the DOMS phenomenon has gained a considerable amount of interest among researchers and specialists in exercise physiology, sports, and rehabilitation. 18 Various studies have been published investigating this painful occurrence in regard to its underlying mechanisms, treatment interventions, and preventive strategies. 5 –7,10,17,19 –24 However, it is evident from the literature that DOMS is not an easy pathology to quantify, as there is a wide amount of variability between the measurement tools and methods used to quantify this condition. 18 It is obvious that no agreement has been made on one best evaluation measure for DOMS, which makes it difficult to verify whether a specific intervention really helps in decreasing the symptoms associated with this type of soreness. Even though needle biopsies of the muscle and blood levels of myofiber proteins or myoglobin might be considered a gold standard to some, 18 large variations in some of these blood proteins have been documented. 18,25 Thus, it can be seen that muscle soreness is somewhat ambiguous because many studies depend on measuring soreness using a visual analog scale (VAS). 22,26 –29 However, people who have diabetes often have neuropathies, and in this case they might not be able to feel the muscle pain as well as normal individuals, therefore giving false VAS readings.
Muscle soreness has various underlying mechanisms, but a main mechanism of soreness is related to blood flow and inflammation in the muscle. 5,6 Thus, when there is damage to the muscle, the blood flow should increase because of the inflammatory process, which should result in the increase of the skin temperature above it. There is ample evidence for this phenomenon. For example, a common technique for detecting some types of tumors is by using thermography. 30 –33 In many cases the tumor has higher blood flows than the rest of the examined area, which warms up a spot under the skin and shows up on a thermal image. 30 –33 Consequently, a muscle that is sore should also show up on a thermal image because of this same phenomenon. The advantage of using thermal imaging is that, unlike subjective pain measurements, which can be altered by the individual's sensation of pain and the associated neuropathies from diabetes, thermal imaging would actually provide very useful information relative to the damage in the muscle.
However, individuals with diabetes may have altered feeling of DOMS or may not feel this type of muscle soreness due to their neuropathies. Therefore, a noninvasive technique that could detect DOMS in its early stages would be very beneficial for this population, as it could prevent them from premature return to exercise. This may increase training and decrease their risks of injuries. It is surprising then that little has been done on DOMS and changes in skin temperatures in this population. Therefore, in the current study we investigated changes in muscle soreness by looking at increases in skin temperatures using thermal imaging at two areas of the body: the first area was closer to the core of the body, and the second area was more peripheral, to see if we can detect a difference between the two regions. For the core area, the abdominal muscles were studied, as core muscles are usually warmer, and for the peripheral region, we examined the biceps muscle because muscle and skin temperature in the peripheries are several degrees cooler than the core. Yet there have been no published studies looking at changes in skin temperature in individuals on days after they have done heavy exercise, to see if muscle soreness can be predicted by an increase in skin temperature.
Subjects and Methods
There were 118 subjects who participated in this study. Subjects were divided into two basic groups: one group of 80 subjects who participated in an abdominal exercise and another group of 38 subjects who participated in biceps exercise. These two groups were also subdivided into healthy subjects (no diabetes) and subjects with diabetes. All the subjects were physically inactive for at least 3 weeks. Subjects were excluded if they were pregnant, had hepatic diseases, were diagnosed with rhabdomyolysis, were diagnosed with an impaired circulatory disease (such as Raynaud's disease), had any recent upper limb or abdominal injuries, had severe neuropathies in their upper limbs, were hypertensive (blood pressure over 145/90 mm Hg) or hypotensive (blood pressure lower than 90/50 mm Hg), or were on high doses of α- or β-agonist/antagonists, nonsteroidal anti-inflammatory agents, cyclooxygenase 2 inhibitors, calcium channel blockers, pregabalins, or pain reducers. Some diabetes subjects had minimal cardiovascular disease but were within the blood pressure ranges stated above and had no major complications. The average ages, heights, weights, and demographics of the subjects are shown in Table 1. All subjects were informed of all experimental procedures and protocols and signed a statement of informed consent as approved by either the institutional review board at Azusa Pacific University (Azusa, CA) or Loma Linda University (Loma Linda, CA).
BMI, body mass index; HbA1c, hemoglobin A1c.
The exercise
The group doing the arm exercise used a dumbbell to exercise one arm. The resistance used was different for each subject and was determined by testing each participant for his or her resistance maximum (RM). To do this, we used a strength-measuring device with four strain gauges arranged as a Wheatstone bridge. This was interfaced with a computer through a bioelectric amplifier module (model DAC-100, BioPac Systems, Goleta, CA). The module was connected to a BioPac model MP-100 analog-to-digital converter sampling at a frequency of 1,000 Hz/s and at a resolution of 24 bits. The device was fixed to a bench at a 45° angle, so that the subject would not recruit any muscle other than the biceps. After determining the RM for the biceps muscle of each participant in that group, we made them sustain the intended session of exercise with 35% of their RM calculated from the average of the three strength recordings done on the strain gauge device prior to the exercise.
The abdominal group accomplished several exercises as shown in the P90X video series, which is designed for both men and women (Beachbody LLC, Los Angeles, CA). The video includes several different exercise routines with various individuals doing each exercise differently, so the user could select low- or high-intensity variations of the exercise depending on their capability. For the purpose of this study, two workout videos were selected to emphasize the abdominal region: the first video, Core Synergistics, lasted 44 min, followed by the Ab Ripper X video, which lasted 16 min, giving a 60-min total workout.
Skin temperature
Skin temperature was measured using a FLIR (Stockholm, Sweden) TC660 thermal camera. The thermal images taken of the arm or abdominal regions were from approximately 1 m away and perpendicular to the skin (Fig. 1). From a series of tests done at our labs using the FLIR TC660 infrared camera, this distance and angle were found to have the best correlation (r=0.93) with thermocouple readings compared with different distances from the skin (2 and 5 m) and at different angles (15°, 30°, 45°, and 60°). The images were taken in a temperature-controlled room, which was maintained at approximately 23°C (±0.5°C). The temperatures from the acquired image were measured at four locations on the skin above the biceps or abdominal muscle using ThermoVision® ExaminIR™ software (FLIR) version 1.10.2 (Fig. 2). These four readings were analyzed individually and then averaged to give a full perspective of the temperature above the exercised muscle.
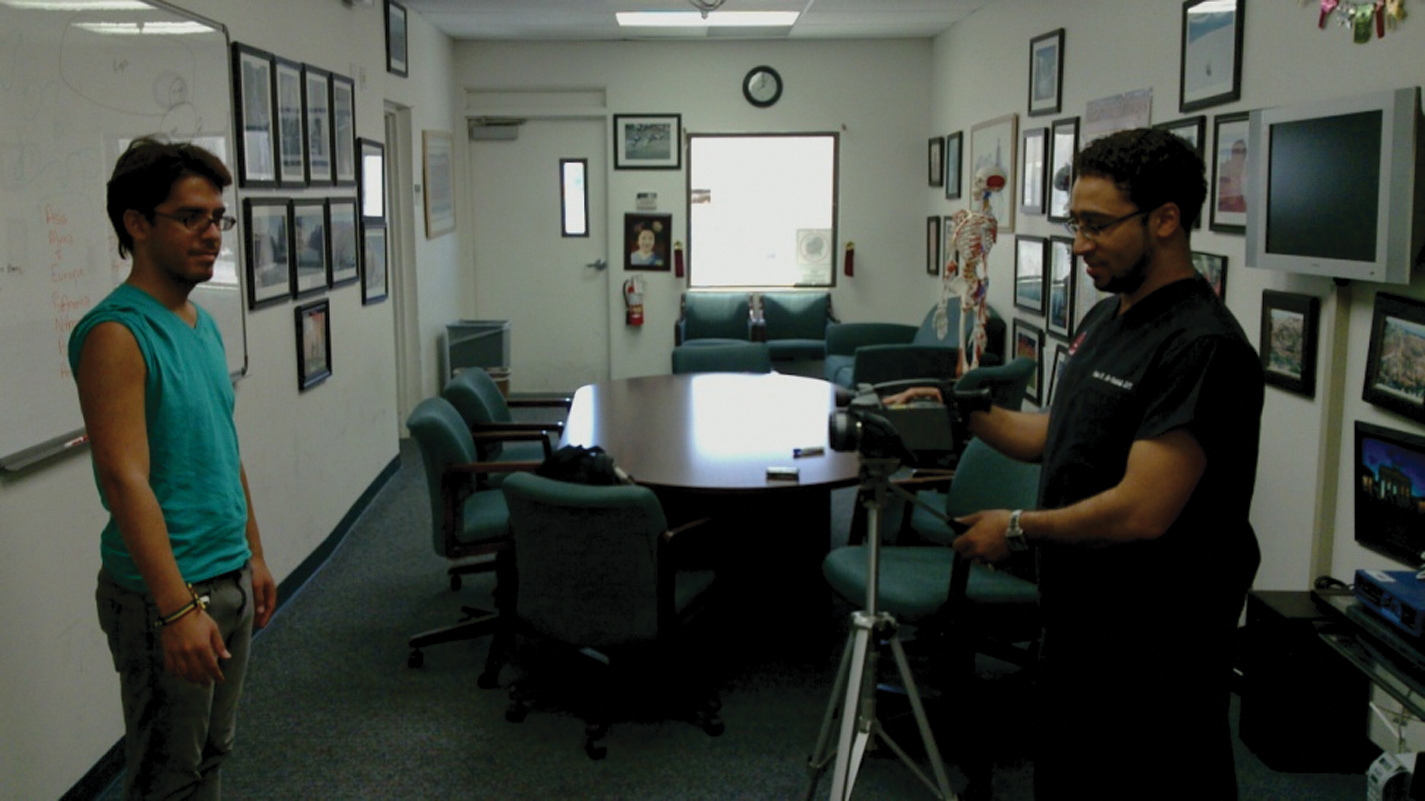
Setup of the infrared camera 1 m away from the skin and perpendicular to the area being examined. Color images available online at
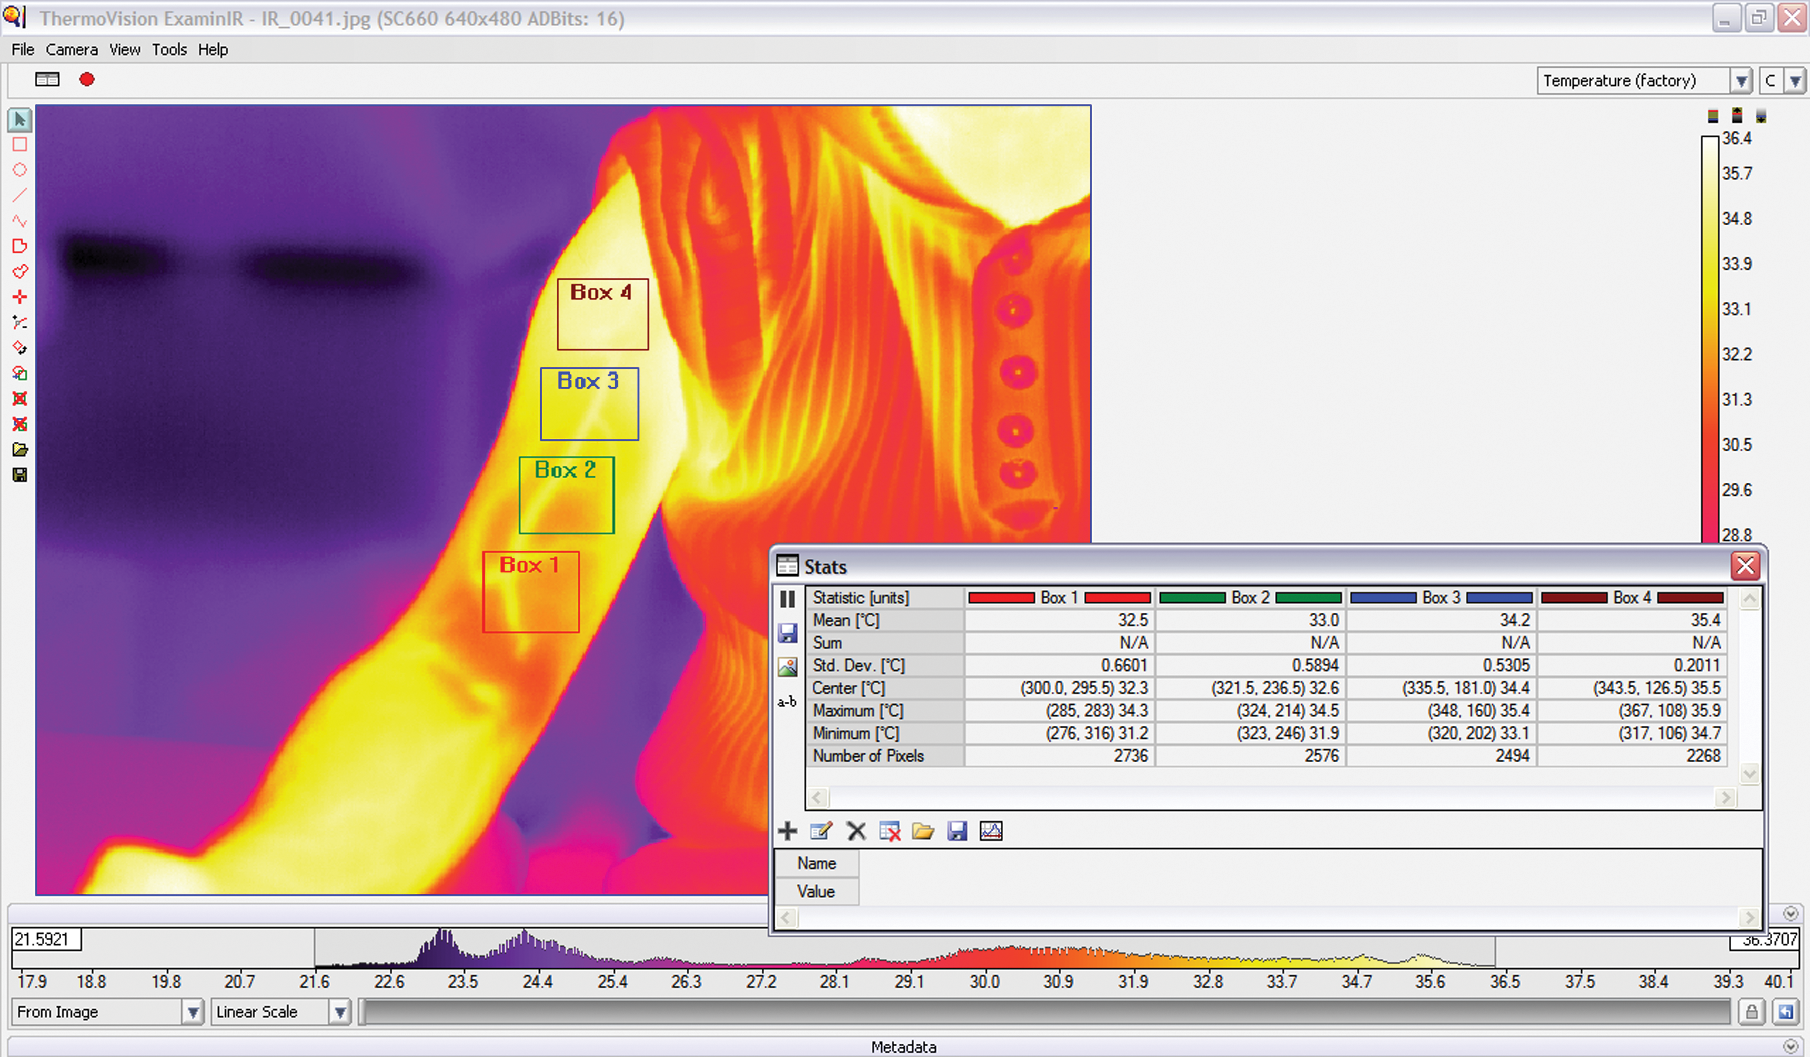
Software interface for the ThermoVision ExaminIR showing the four boxes of interest on an infrared image of an exercised arm. Also shown are the statistical interpretations for each box from the software itself. N/A, not applicable. Color images available online at
Soreness/pain VAS
A VAS was used to assess subjective soreness of the arm or abdominal muscles before doing the exercise and after the exercise was completed. The scale had a 10-cm (100-mm) long line marked “no pain” at one end, and “extremely sore” at the opposite end. Each participant was directed to make a vertical mark along the 10 cm line to indicate his or her response to soreness.
Blood sampling and measurement of myoglobin concentrations
Approximately 4 mL of peripheral blood was collected from an antecubital vein. Peripheral venous blood was drawn before (pre-exercise), immediately after (post-exercise), and 48 h (2 days) after the exercise bout. The blood was spun down in a centrifuge at 2,683 g for 10 min to separate the serum from the cells. The samples were stored at −80°C until the analyses of myoglobin was done.
Myoglobin was measured using a TOSOH AIA®-360 automated enzyme immunoassay analyzer (TOSOH Corp., Tokyo, Japan). The myoglobin assay kits (Myo 025297, ST AIA-PACK myoglobin) were used according to TOSOH's instructions. Controls were assayed before and after each analysis session, to verify that the measurements were accurate and within the manufacturer's specified quality control ranges. The normal reference range for myoglobin using this method was 31.4–971 ng/mL. The intra-assay and inter-assay coefficients of variation were 2.76% and 4.45%, respectively.
Procedure
In this investigation, we started off with the biceps study and monitored the soreness and heat variations for the subjects over a period of more than 3 days. It was realized that the biggest change in temperatures was at 24 h. We then did the abdominal study for only 3 days, to see if the core muscles have the same heating response as the peripheral muscles. Blood samples for the myoglobin readings were only assessed for the arm group. Myoglobin measurements were not carried out on the abdominal group due to costs.
After subjects attended the fitness lab, baseline data, including a thermal image of the abdominal or arm muscles, and a soreness VAS reading were collected. Blood samples for the myoglobin analyses were also collected at this time, but only for the arm group. The targeted muscles for the subjects in the arm group were the elbow flexors. To provoke DOMS in these muscles, the subjects in this group carried out four sets of 25 repetitions of biceps concentration curls while seated on a chair and with the elbows supported on their thighs. Subjects were advised to lower the weight and lift it at a steady state (approximately 3 s going down and 3 s coming back up), to insure that both the eccentric and concentric components of the contraction were properly done. There was a 90-s resting period between each set and the other, and subjects either did the full set of 25 repetitions or were instructed to stop the set if they failed to steadily control the descent of the weight and return their arm back to full flexion. As indicated previously, the resistance used was different for each subject and was determined by testing each participant for his or her RM.
For the abdominal exercise group, after the baseline readings, the subjects participated in the 60-min workout video mentioned above, to induce DOMS in their abdominal muscles. All subjects were asked to attempt the most difficult variation of each exercise as they were able. Subjects were given four 3-min breaks throughout the video to rest. Subjects were told that they are allowed to stop the exercise at any time if it became too strenuous.
Twenty-four hours post-exercise, thermal images of the arm or abdomen muscles were measured, and VAS readings were also taken at this time. Both these measures were also repeated at 48 h post-exercise. Blood samples for the second myoglobin reading were taken 30 min post-exercise, and the third reading was taken 48 h post-exercise.
Data analysis
Data analysis involved mean and SD values. Measurements of all three variables (skin temperature, VAS, and myoglobin) were compared within each group using repeated-measures analysis of variance. Spearman's correlation was also used to identify any relationships between the variables. Statistical analysis was performed using PASW Statistics version 18.0.0 (2009) (SPSS, Inc., Chicago, IL) (
Results
Skin temperature
The results of the skin temperature measurements for the four groups are shown in Figure 3. As seen in Figure 3, all the four groups had increased skin temperatures 24 h post-exercise. For the healthy group who performed the P90X abdominal exercise, their average skin temperature for the measured area increased by 0.83°C, from 32.50±0.37°C to 33.33±0.39°C. This increase in skin temperature was significant (P<0.05). The increase in skin temperatures from baseline to 24 h post-exercise for the diabetes group who performed the P90X abdominal exercise was also significant (P<0.05), in which it increased by 0.61°C, from 33.02±0.16°C to 33.63±0.61°C.
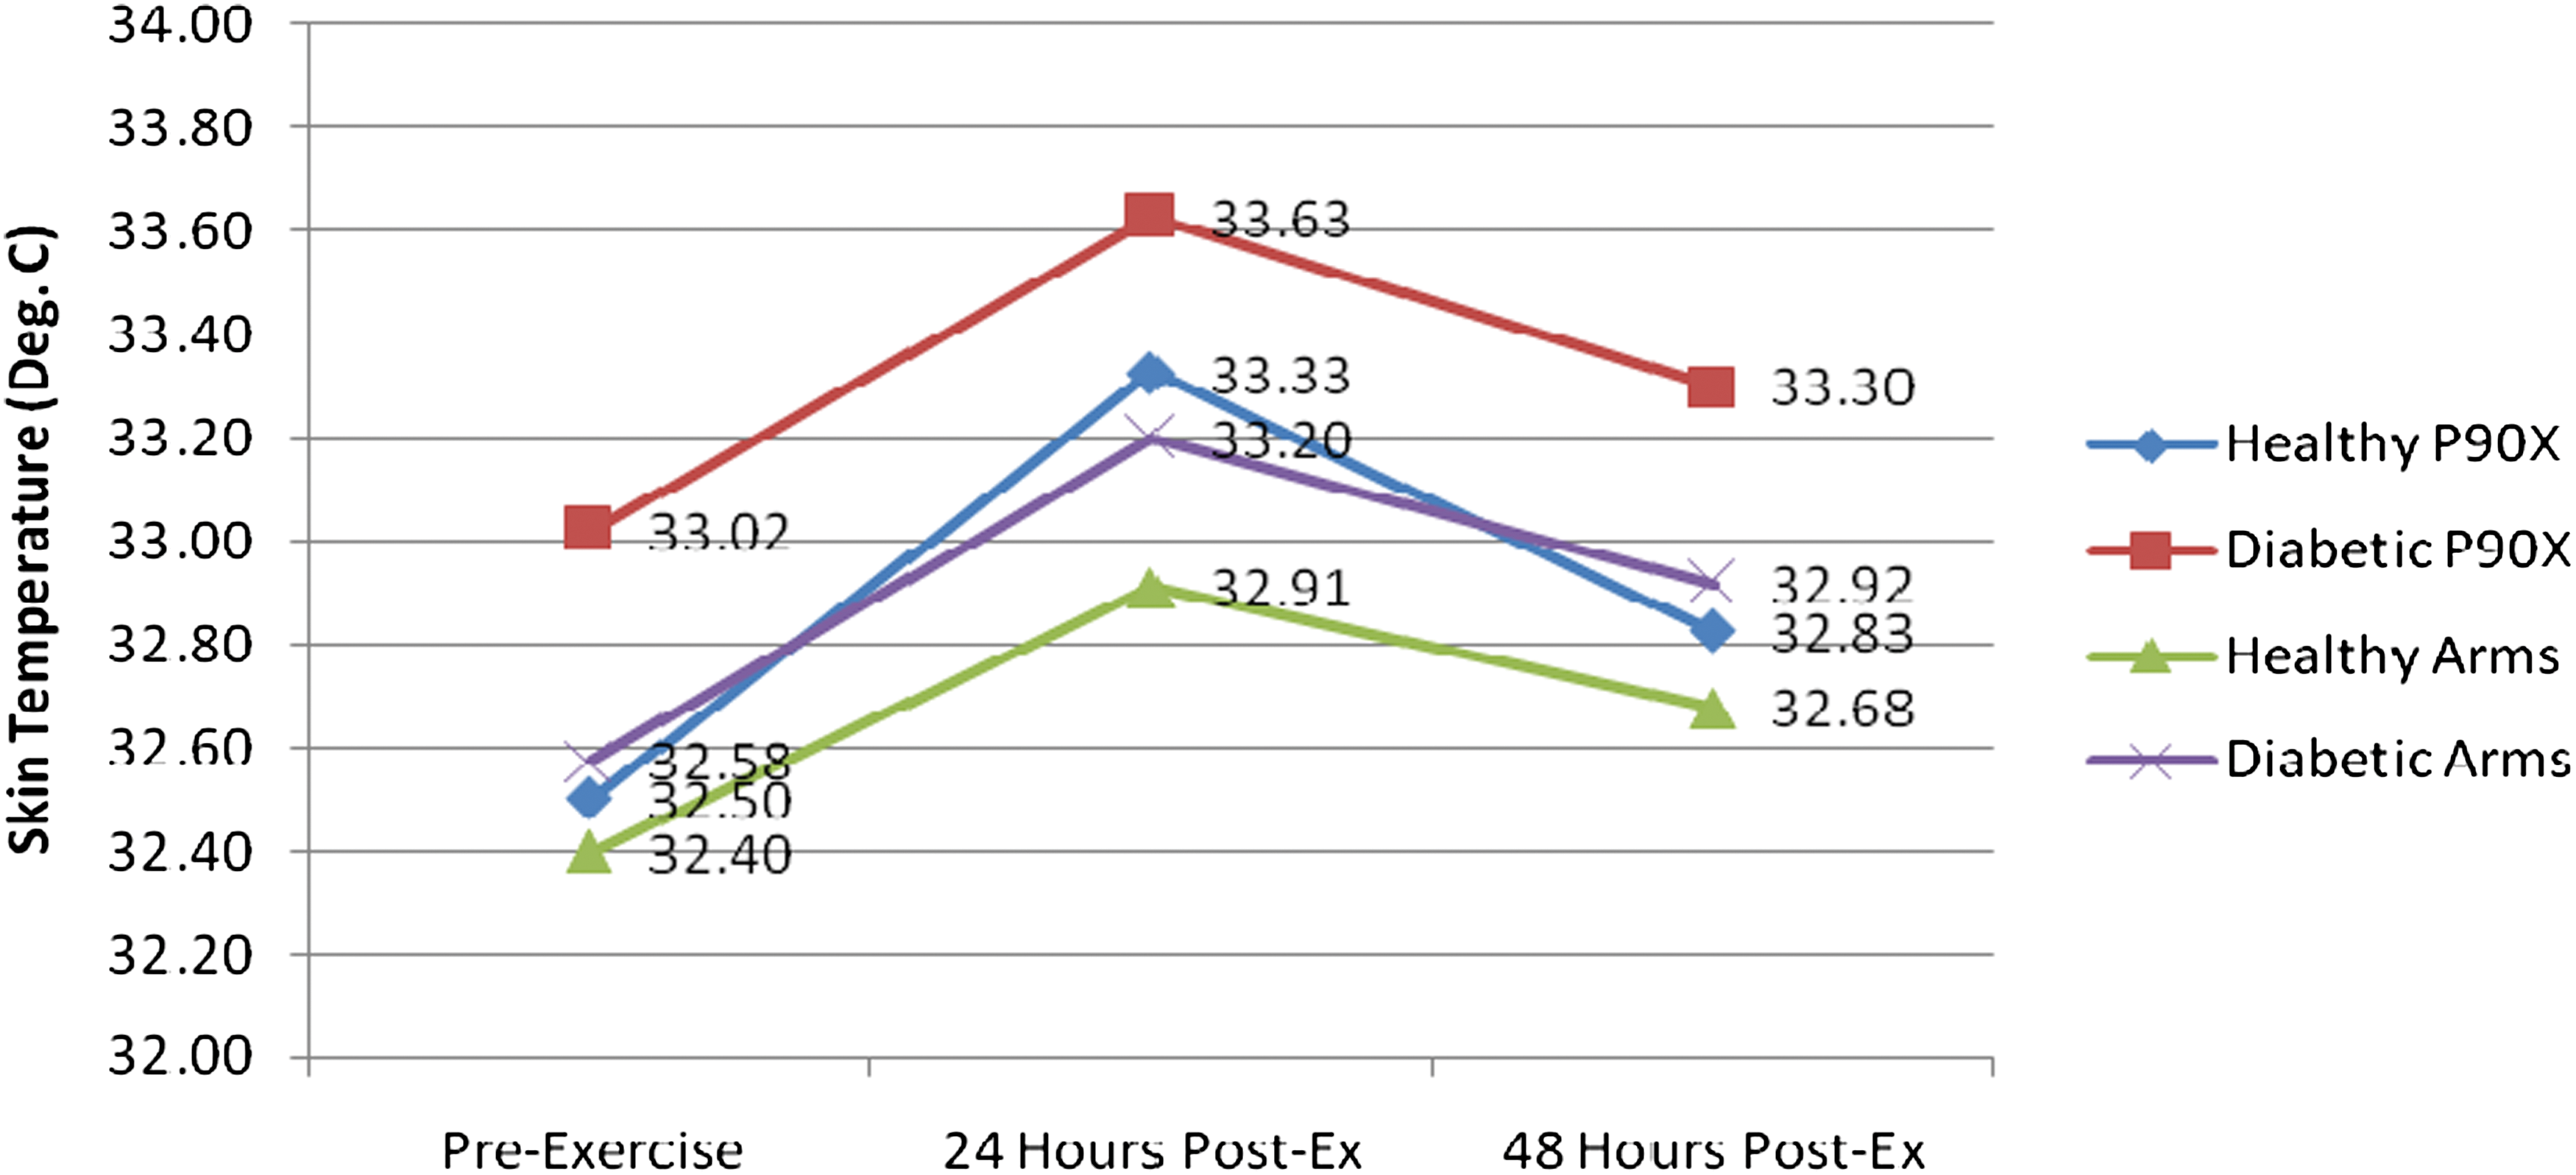
A representative graph of the differences in skin temperatures measured with the thermal camera in the healthy group who performed the P90X abdominal exercise (diamonds), the diabetes group who performed the P90X abdominal exercise (squares), the healthy group who performed the arm exercise (triangles), and the diabetes group who performed the arm exercise (X), over the 3-day time period. Post-ex, post-exercise. Color images available online at
For the groups that exercised their arm muscles, the healthy group had a 0.51°C increase in skin temperature between the first 2 days, from 32.4±0.87°C to 32.91±0.96°C. This increase was significant (P<0.05). Also, the diabetes group who exercised their arms had a significant increase in skin temperature (P<0.05) from day 1 to day 2, where the increase was 0.62°C, from 32.58±0.85°C to 33.20±0.74°C (Fig. 4).

(
By day 3 (48 h post-exercise), skin temperatures were almost back to normal, where there was no significant difference between day 1 (pre-exercise) and day 3 for all the groups (P>0.05).
Perceived soreness (VAS)
The results of the perceived muscle soreness are shown in Figure 5. All four groups had a dramatic increase in muscle soreness 24 h post-exercise. The healthy group members who performed the P90X abdominal exercise had an increase of approximately 41.5 mm on the pain scale, from 0 pain to 41.5±6.1 mm. This increase was highly significant (P<0.05). The diabetes group patients who performed the same abdominal exercise had an even higher increase in muscle soreness than the healthy subjects: their baseline muscle soreness was 7.3±1.7 mm, which had increased to 73.8±8.8 mm, 24 h post-exercise. That was a 66.5 mm increase, which was also very significant (P<0.05).
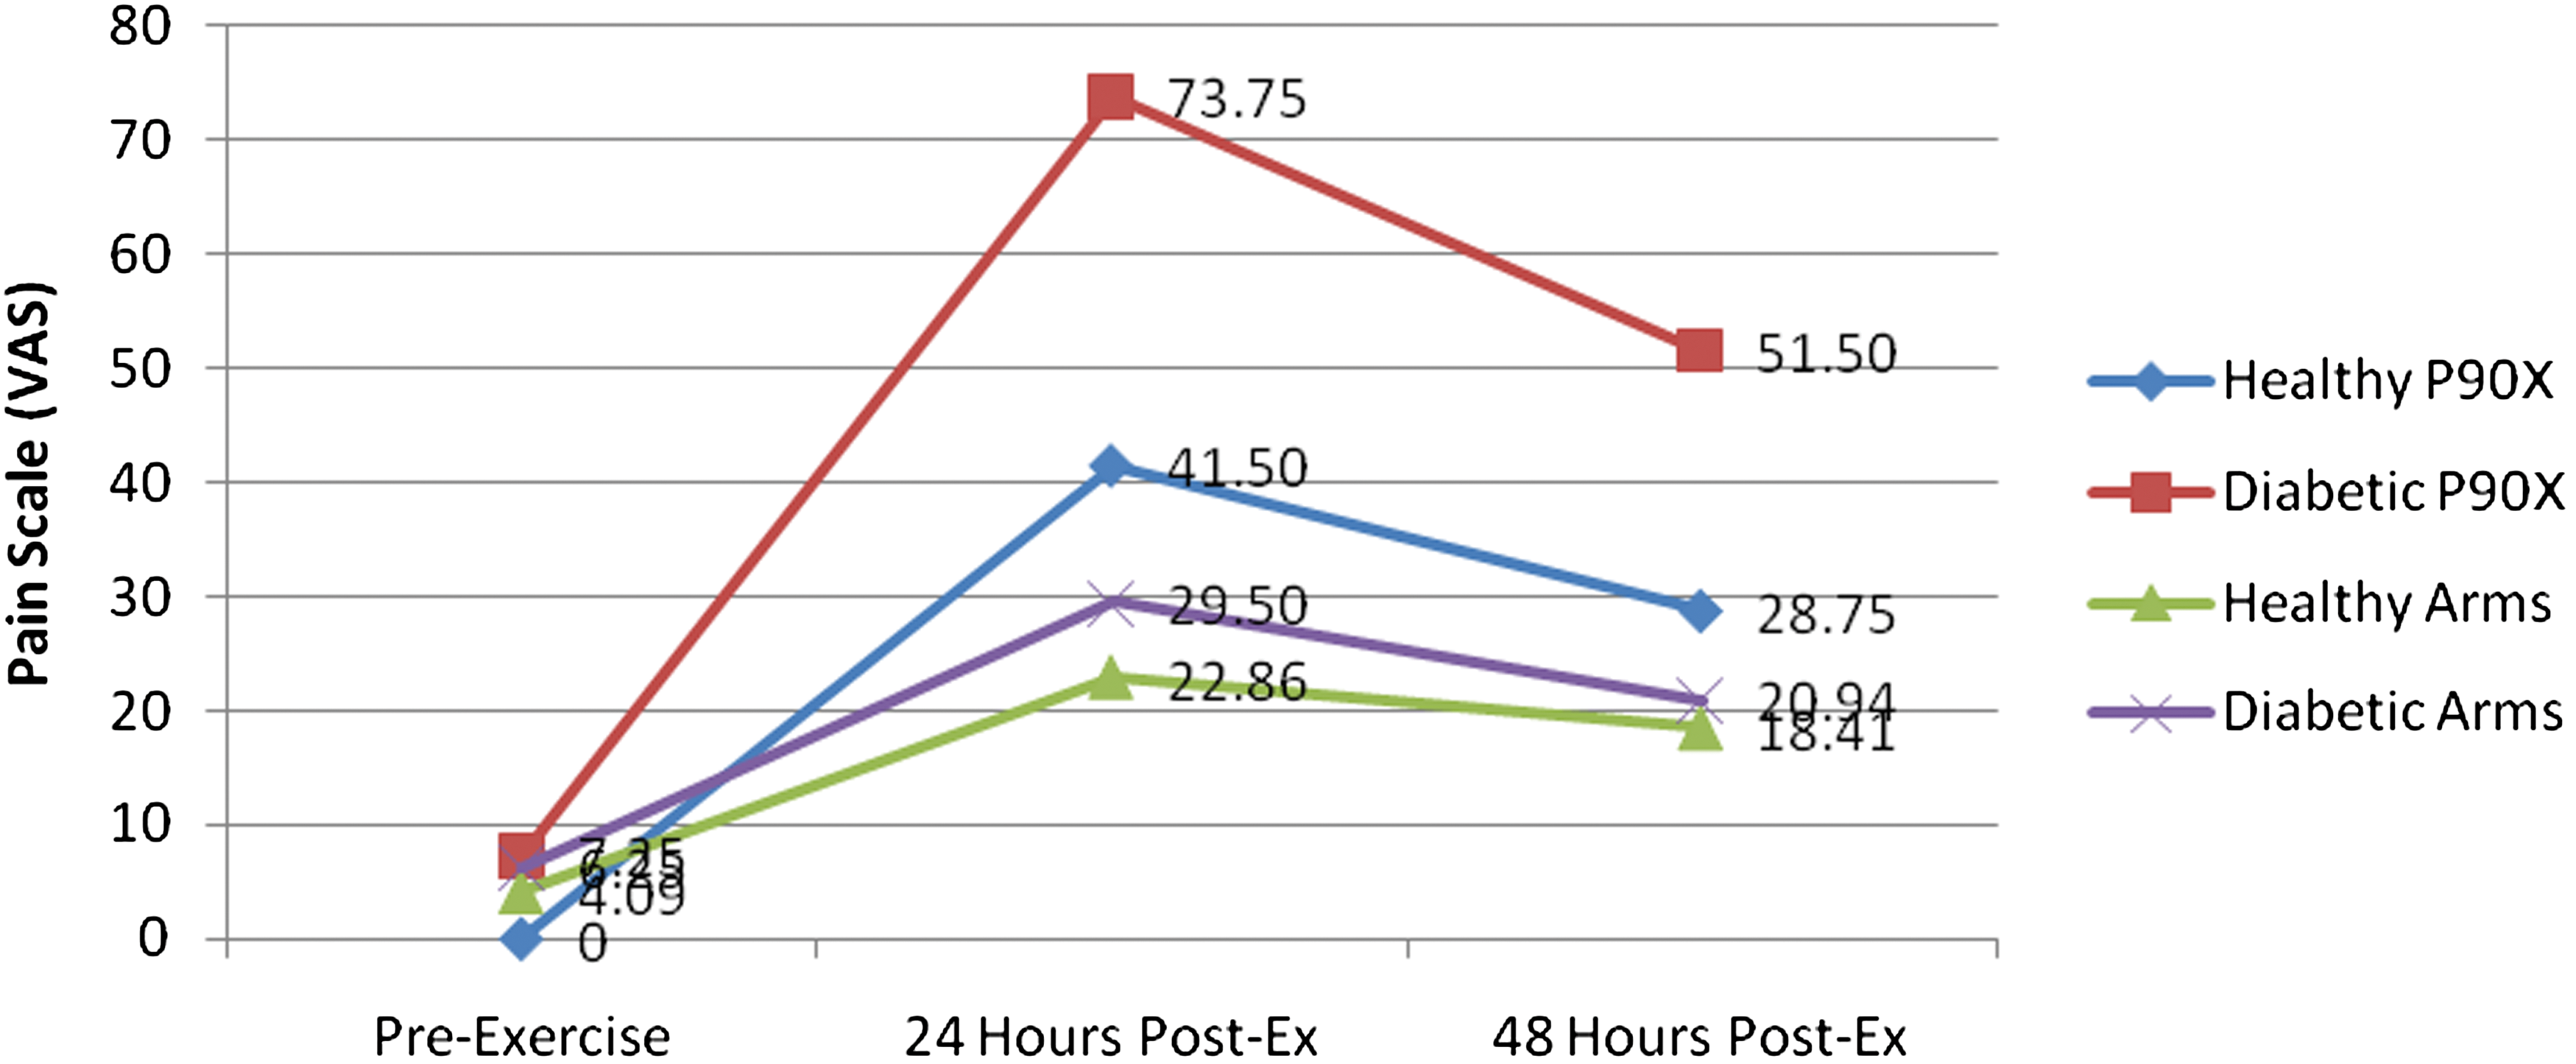
A representative graph of the differences in perceived muscle soreness measured with the visual analog scale (VAS) in the healthy group who performed the P90X abdominal exercise (diamonds), the diabetes group who performed the P90X abdominal exercise (squares), the healthy group who performed the arm exercise (triangles), and the diabetes group who performed the arm exercise (X), over the 3-day time period. Post-ex, post-exercise. Color images available online at
The biceps exercise group also had large increases in soreness levels from pre-exercise to 24 h post-exercise: the healthy subjects had an 18.8 mm increase in muscle soreness (from 4.1±6.9 mm to 22.9±15.1 mm), and the diabetes group had a 23.3 mm increase in muscle soreness (from 6.3±7.4 mm to 29.5±11.6 mm). Both these increases were also significant (P<0.05). It is also clear from Figure 5 that the soreness levels for all the four groups were beginning to decrease, but they did not reach near baseline levels as was the case for skin temperature measurements.
Myoglobin concentrations
The results of the myoglobin readings for the two arm exercise groups are shown in Figure 6. Both groups had substantial increases in myoglobin concentrations 48 h post-exercise. However, there was hardly any difference between the two measurements (pre- and post-exercise) on day 1, for both the groups (P>0.1). The healthy group had an increase of approximately 146 ng/mL of blood on day 3, compared with day 1 (from 31.03±8.25 to 177±222 ng/mL). This increase was highly significant (P<0.05). The diabetes group patients who performed the same arm exercise had an even larger increase in myoglobin concentrations compared with the healthy individuals. This group had an increase of almost 337 ng/mL of blood at 48 h compared with baseline (from 50.9±19.2 to 388.35±411.9 ng/mL). This increase in the myoglobin level was also very significant (P<0.05).
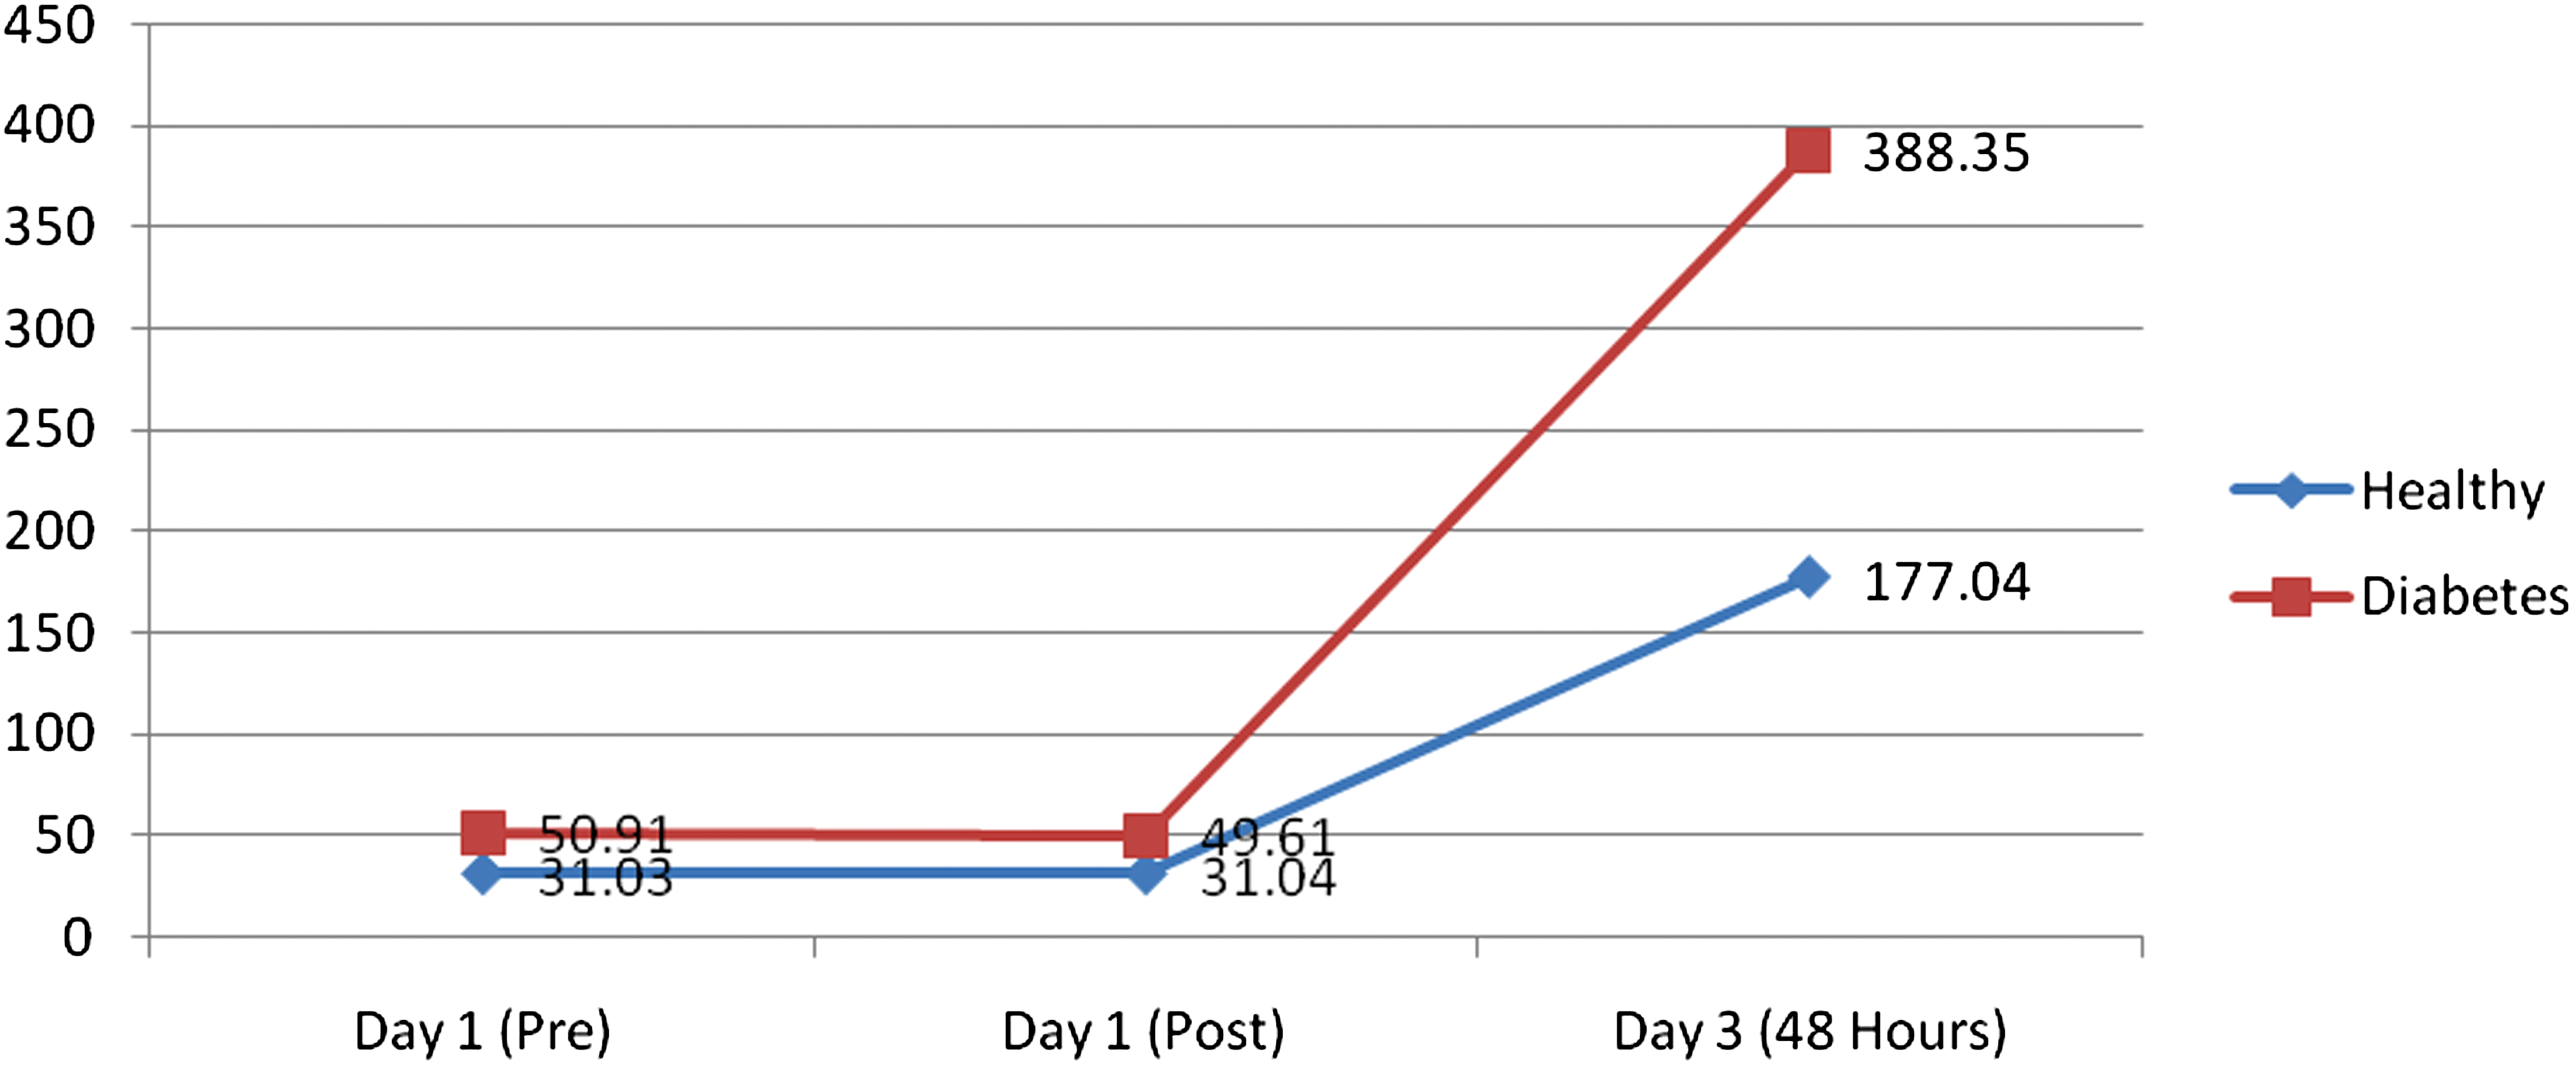
A representative graph of the differences in myoglobin levels between the healthy group who performed the arm exercise (diamonds) and the diabetes group who performed the arm exercise (squares) at three different time periods: Day 1 pre-exercise (Pre) and post-exercise (Post) and Day 3. Color images available online at
A correlation analysis was done between the myoglobin measurements and the other two variables (skin temperature and VAS). It was found that there was a strong correlation between the peak skin temperature measurements (day 2) and the peak myoglobin readings (day 3). This correlation was highly significant (r=0.41, P<0.05). There was also a relevant correlation between the myoglobin readings on day 3 and the VAS measurements on day 3. This correlation was also very significant (r=0.47, P<0.05).
Discussion
In the present investigation, subjects participated in an intense exercise program involving a single bout of exercise to identify the usability of thermal infrared imaging for detecting DOMS. From this investigation, it was found that infrared imaging could be a valid technique for determining DOMS within the first day of exercising.
Diabetes causes a chronic increase in whole body inflammation. 34 Because of this, and of the metabolic and endothelial impairments associated with diabetes, exercise performance and training may become impaired in this population. 35,36 Even though in our investigation both the diabetes groups did not exercise as hard as the other two healthy groups, they had more muscle soreness than the healthier groups. However, exercise is still the best means of increasing glycemic control in individuals with diabetes because it enhances the body's insulin sensitivity. 1 Exercise has also been associated with a mean reduction in hemoglobin A1c of approximately 0.80%, especially muscle building exercises, as an increased overall muscle mass has been associated with better insulin sensitivity. 4,37 This obviously gives the individual with diabetes a better chance of coping with the disease and of preventing its symptoms from getting worse. 2,38
An interesting finding in this study was that the two groups of subjects who performed the abdominal exercise had higher skin temperatures and increased soreness levels compared with the groups who did the arm exercise. This could be due to the fact that the abdominal exercise was slightly longer in duration than the arm exercise, or because the abdominal muscles are larger in size than the biceps muscle. Another justification could be that the abdominal muscles are closer to the core and are slightly warmer to begin with compared with the peripheral arm muscles.
Pennes 39 provided a very detailed model of heat flow from muscle to skin in limbs. This model predicts that heat in deeper tissues such as muscles can be dissipated into blood and into the skin through conductive heat exchange. When muscles exercise, heat is developed in the muscle because of frictional forces of the muscle fibers and from the increased metabolism. 40 Increased blood flows to the muscle would also contribute to the increased heat in the muscle after exercising.
Skin is a shell tissue, and its temperature is usually about 6°C less than that of the core. 41 –43 The skin must be kept cooler than the core so that heat can move from the core to the skin and be removed by radiation, conduction, and evaporation. 42,44 –46 Heat both moves from the muscle into the blood, perfusing muscle, and is dissipated throughout the body and also flows to the cooler skin area. 39 –41 This allows core temperature to be maintained at a regulated level. 35,39,47 Muscle is also a shell tissue, where its temperature is usually 32–33°C, which is slightly warmer than that of skin. However, when blood flow is increased to the exercised muscle it approaches the temperature of the core tissues, which is approximately 37°C. 33,39 Blood flow in skeletal muscle is very dynamic. However, when tissue is damaged during exercise, blood flow can increase dramatically. Thus, warm blood entering muscle when tissue repair is being accomplished as part of the inflammatory response can deliver a great deal of heat into the tissue. 6,48 The increased blood flow should go back to normal within an hour or two of the exercise termination, but when temperatures are still elevated at 24 h post-exercise, this shows that damage has happened to the exercised muscle and causes a hot spot under the skin.
Thus, the elevated skin temperatures found 24 h post-exercise in all subjects are possibly the result of higher blood flows in muscle due to inflammation and tissue damage repair. 6 Therefore, if muscle blood flow remained elevated post-exercise, the warmer core blood would keep the muscle warm, and hence the overlying skin would stay warm. This occurrence has been seen with thermal imaging for breast tumors in women, where tumors under the skin have this same effect, and therefore form the basis for breast thermal imaging to detect tumors. 31,49 In fact, infrared imaging has been used to detect and diagnose several other diseases, 30,32,33,50 –52 as changes in the human body's temperature has always been an indicator of some sort of dysfunction. 51 Increased circulation associated with DOMS could also be seen as increased tissue temperature resulting from a muscular dysfunction.
The elevated myoglobin concentrations on day 3 also verify this muscle soreness response after exercise. Myoglobin is a monomer protein, which has several functions regarding oxygen storage and transport in the muscles. After strenuous exercise, myoglobin can be released in the bloodstream because of the breakdown of cell membranes in the exercised muscles. 53,54 Levels of muscle damage biomarkers, such as myoglobin, may increase 30 min after exercising and peak at 24–72 h post-exercise. 53 For that reason, we measured venous myoglobin at 48 h post-exercise, to identify the peak myoglobin response. Fortunately, as was seen in the correlation analyses, there was a strong relationship between the myoglobin concentrations on day 3 and the skin temperature measurements on the day before. This finding validates the usability of thermal imaging to detect DOMS in its initial stages. Even though skin temperatures and soreness levels were returning back to normal at 48 h post-exercise, the myoglobin concentrations were dramatically high. This exaggerated release of myoglobin from muscle could be due to the muscles response to the low-grade inflammation and damage after the exercise. 53,55
There were a couple of limitations in this study. First, the sample sizes were not equal between the groups that did the abdominal exercises and the arm exercise groups. A main reason for this could be due to the fact that the arm exercise session, which was done prior to the abdominal exercise session, needed more commitment from the subjects, as it was extended to more than 3 days. Second, myoglobin was only measured for the arm exercise group. This was because of cost. Third, the exercise routines between the two groups were different. However, this was necessary because the abdominal muscles are larger than the arm muscles, and an exercise that challenges the abdominal muscles, without causing back pain, was needed for the purpose of this study.
Despite the limitations of this study, we have provided evidence to suggest that thermal imaging could be of great value in identifying which muscles have been exercised and are sore, hours or even days after the exercise is over. Thermal imaging would then be a painless and noninvasive way of detecting DOMS in its early stages, which could minimize further injuries from overexercising both in healthy individuals and in people who have diabetes. This could be more beneficial for the individuals with diabetes as they do not always realize that they are sore, because of the neuropathies and impairments they have.
Footnotes
Acknowledgments
We wish to acknowledge a contract (WS1763368) from Pfizer Pharmaceuticals for support in this work. We would also like to thank the Saudi Arabian Ministry of Higher Education for their support.
Author Disclosure Statement
No conflicts of interests are declared.