
Abstract
Objective:
This study assessed the association of inflammatory markers, high-sensitivity C-reactive protein (hsCRP), and total leukocyte count with nonalcoholic fatty liver disease (NAFLD) in urban South Indians.
Subjects and Methods:
We randomly selected subjects with and without NAFLD (n=100 each) from the Chennai Urban Rural Epidemiology Study conducted in Chennai in south India. NAFLD was diagnosed by ultrasonography. hsCRP was measured by nephelometry, and leukocyte count was measured by flow cytometry. Insulin resistance was analyzed by homeostasis assessment model using the following expression: fasting insulin (μIU/mL)×fasting glucose (mmol/L)/22.5.
Results:
Mean hsCRP values were significantly higher in subjects with NAFLD compared with those without (4.2±1.2 mg/L vs. 2.2±0.4 mg/L; P<0.001). Leukocyte count was also higher in subjects with NAFLD compared with those without (7.8±1.4×10³/μL vs 6.9±0.9×10³/μL, P<0.001). Both hsCRP (P<0.001) and leukocyte count (P<0.001) increased with increasing severity of NAFLD. Multiple logistic regression analysis was done using NAFLD as the dependent variable and hsCRP and leukocyte count as independent variables. Both hsCRP (odds ratio 1.293, 95% confidence interval 1.13–1.470, P<0.001) and leukocyte count (odds ratio 1.293, 95% confidence interval 1.069–1.564, P=0.008) had a significant association with NAFLD even after adjusting for waist circumference, insulin resistance, serum triglycerides, and presence of type 2 diabetes.
Conclusions:
hsCRP and leukocyte count are associated with NAFLD after adjusting for conventional cardiometabolic risk factors.
Introduction
Increased levels of high-sensitivity C-reactive protein (hsCRP) have been shown to be correlated with incidence of type 2 diabetes. 5 hsCRP has also been reported to play an important role in atherosclerosis. 6 We earlier reported that hsCRP is associated with type 2 diabetes, carotid intimal medial thickness, and metabolic syndrome. 7 There are reports that hsCRP levels are significantly correlated with liver histology in NAFLD patients, suggesting that NAFLD may be associated with low-grade inflammation in the liver. 8 In a Japanese study, serum hsCRP was proposed as part of a scoring system to predict disease progression in NAFLD. 9 We are unaware of any studies on hsCRP and NAFLD in Asian Indians. The prevalence of NAFLD in Asian Indians was found to be high and to increase with increasing severity of glucose intolerance. 10 Asian Indians are also known to have very high rates of premature coronary artery disease and diabetes. Hence it would be worthwhile to look at the association between hsCRP and total leukocyte count with NAFLD in Asian Indians.
Study Design and Methods
Study subjects were recruited from the Chennai Urban Rural Epidemiology Study (CURES), the detailed study design of which is described elsewhere. 11 In brief, this is a representative study of Chennai city in southern India and composed of several phases (i.e., Phases 1–5), each dealing with specific epidemiologic questions. In Phase 5 of CURES, the prevalence of NAFLD was investigated in a subset of 541 subjects maintaining the representativeness of original sample. For the present study, we randomly selected (using computer-generated random numbers) 100 subjects with and 100 subjects without NAFLD from Phase 5 of CURES. Subjects with known liver or biliary disease or any infectious or inflammatory disease and those on statins or aspirin were excluded from the study. The study was approved by the institutional ethics committee, and informed consent was obtained from all study subjects.
All study subjects underwent an oral glucose tolerance test (OGTT) using 75-g glucose load, except subjects with self-reported diabetes, for whom fasting venous plasma glucose (PG) was measured. Diagnosis of diabetes was based on the WHO Consulting Group criteria (i.e., 2-h post-load PG [2-h PG]≥11.1 mmol/L [200 mg/dL]) or subjects with self-reported diabetes receiving treatment with oral hypoglycemic agents by a physician. 12
Anthropometric measurements
Height, weight, and blood pressure were measured using standardized methods. 11 Body mass index was calculated as weight (in kg)/height (in m2). Waist was measured using a nonstretchable fiber measuring tape. Waist girth was measured as the smallest horizontal girth between the costal margins and the iliac crests at minimal respiration. Blood pressure was recorded from the right arm in a sitting position to the nearest 2 mm Hg with a mercury sphygmomanometer (Deluxe BP apparatus, Diamond, Pune, India). Two readings were taken 5 min apart, and the mean of the two was taken as the blood pressure.
Biochemical parameters
Biochemical analyses were done on a Hitachi-912 autoanalyzer (Roche Diagnostics, Basel, Switzerland). Levels of fasting PG (glucose oxidase–peroxidase method), serum cholesterol (cholesterol oxidase–phenol-aminophenazone method), serum triglycerides (glycerol-3-phosphate oxidase–phenol-aminophenazone method), and high-density lipoprotein cholesterol (direct method; polyethylene glycol–pretreated enzymes) were measured. Low-density lipoprotein cholesterol was calculated using the Friedewald formula. Glycated hemoglobin was estimated by high-pressure liquid chromatography using a Variant™ (Bio-Rad, Hercules, CA) machine. Aspartate aminotransferase, alanine aminotransferase, alkaline phosphatase, and γ-glutamyltransferase were estimated using a Hitachi-912 autoanalyzer with kits supplied by Roche Diagnostics GmbH (Mannheim, Germany) using International Federation of Clinical Chemistry standardized methods.
Serum insulin was estimated using enzyme-linked immunosorbent assay (Dako, Glostrup, Denmark). The intra-assay and the inter-assay coefficients of variation for insulin assay were 5.7% and 8.9%, respectively, and the lower detection limit was 0.5 μIU/mL. Insulin resistance was calculated using the homeostasis assessment model (HOMA-IR) using the following expression: fasting insulin (μIU/mL)×fasting glucose (mmol/L)/22.5.
Measurement of hsCRP and leukocyte count
The plasma concentrations of hsCRP were measured by a high-sensitivity nephelometric assay using a monoclonal antibody to C-reactive protein coated on polystyrene beads (Dade Behring, Deerfield, IL). The intra-assay and the inter-assay coefficients of variation for hsCRP were 4.2% and 6.8%, respectively, and the lower detection limit was 0.17 mg/L. Leukocyte count was assessed using flow cytometry (model SF-3000, Sysmex, Kobe, Japan). The intra and inter-assay co-efficients of variation of leukocyte count were <10%.
Assessment of NAFLD
Ultrasonographic examination of liver was performed by a radiologist, using a high-resolution B-mode ultrasonography system (Logic 400, GE, Milwaukee, WI) having an electric linear transducer midfrequency of 3–5 MHz. The radiologist was masked to all clinical and biochemical characteristics of the study subjects. The scan was done for an average of 20 min, and the images obtained were recorded and photographed. Fatty liver was defined as the presence of an ultrasonographic pattern consistent with “bright liver,” with evidence of increased ultrasonographic contrast between hepatic and renal parenchyma, vessel blurring, and narrowing of the lumen of the hepatic veins in the absence of findings suggestive of chronic liver disease. 13 NAFLD was defined as any degree of fatty liver in the absence of any alcohol intake.
NAFLD, if present, was classified based on the severity of fatty liver based on standard criteria 13 : Grade 1 (mild steatosis) was defined as slightly increased liver echogenicity with normal vessels and absent posterior attenuation; Grade 2 (moderate steatosis) was defined as moderately increased liver echogenicity with partial dimming of vessels and early posterior attenuation; and Grade 3 (severe steatosis) was defined as diffusely increased liver echogenicity with absence of visible vessels and heavy posterior attenuation.
Repeated measurements performed in a random subgroup of 20 subjects showed the intra- observer coefficient of variation to be <5%.
Statistical analysis
Data for all biochemical parameters are presented as mean±SD values. Student's t test or one-way analysis of variance (with Tukey's Highly Significant Difference) as appropriate was used to compare groups for continuous variables, and χ2 test or Fisher's Exact test as appropriate was used to compare proportions. Univariate regression analysis was carried out to determine the association of NAFLD with cardiovascular metabolic risk factors. Multiple logistic regression analysis was then carried out using disease state (NAFLD) as the dependent variable and hsCRP and leukocyte count as the independent variables. Various factors found to be significant on univariate analysis were introduced, one by one, to see which factors remained significant. All analysis were done using a Windows-based SPSS statistical package (version 12.0, SPSS, Inc., Chicago, IL).
Results
Table 1 shows the clinical and biochemical characteristics of the study subjects. Body mass index (P<0.001), waist circumference (P=0.041), insulin resistance (P<0.001), fasting PG (P=0.006), glycated hemoglobin (P<0.001), total cholesterol (P=0.004), serum triglycerides (P=0.007), low-density lipoprotein cholesterol (P<0.01), liver alanine aminotransferase (P=0.002), and alkaline phosphatase (P=0.002) were elevated in subjects with NAFLD compared with those without. Mean hsCRP values were significantly higher in subjects with NAFLD compared with those without (4.2±1.2 mg/L vs. 2.2±0.4 mg/L, P<0.001). Mean leukocyte count was also higher in subjects with NAFLD compared with those without (7.8±1.4×10³/μL vs. 6.9±0.9×10³/μL, P<0.001).
Data are mean±SD values.
Geometric mean.
BMI, body mass index; HDL, high-density lipoprotein; HOMA-IR, insulin resistance calculated by the homeostasis model of assessment; hsCRP, high-sensitivity C-reactive protein; NAFLD, nonalcoholic fatty liver disease.
Figure 1 shows that subjects with moderate to severe steatosis had significantly higher hsCRP levels (4.7±1.2 mg/L) compared with subjects with mild steatosis (3.8±0.9 mg/L; P<0.001) and those without NAFLD (2.2±0.4 mg/L; P<0.001). Leukocyte count was also higher in subjects with moderate to severe steatosis (7.9±1.4×10³/μL) compared with subjects with mild steatosis (7.6±1.2×10³/μL; P<0.05) and those without NAFLD (6.9±0.9×10³/μL; P<0.001) (Fig. 2).
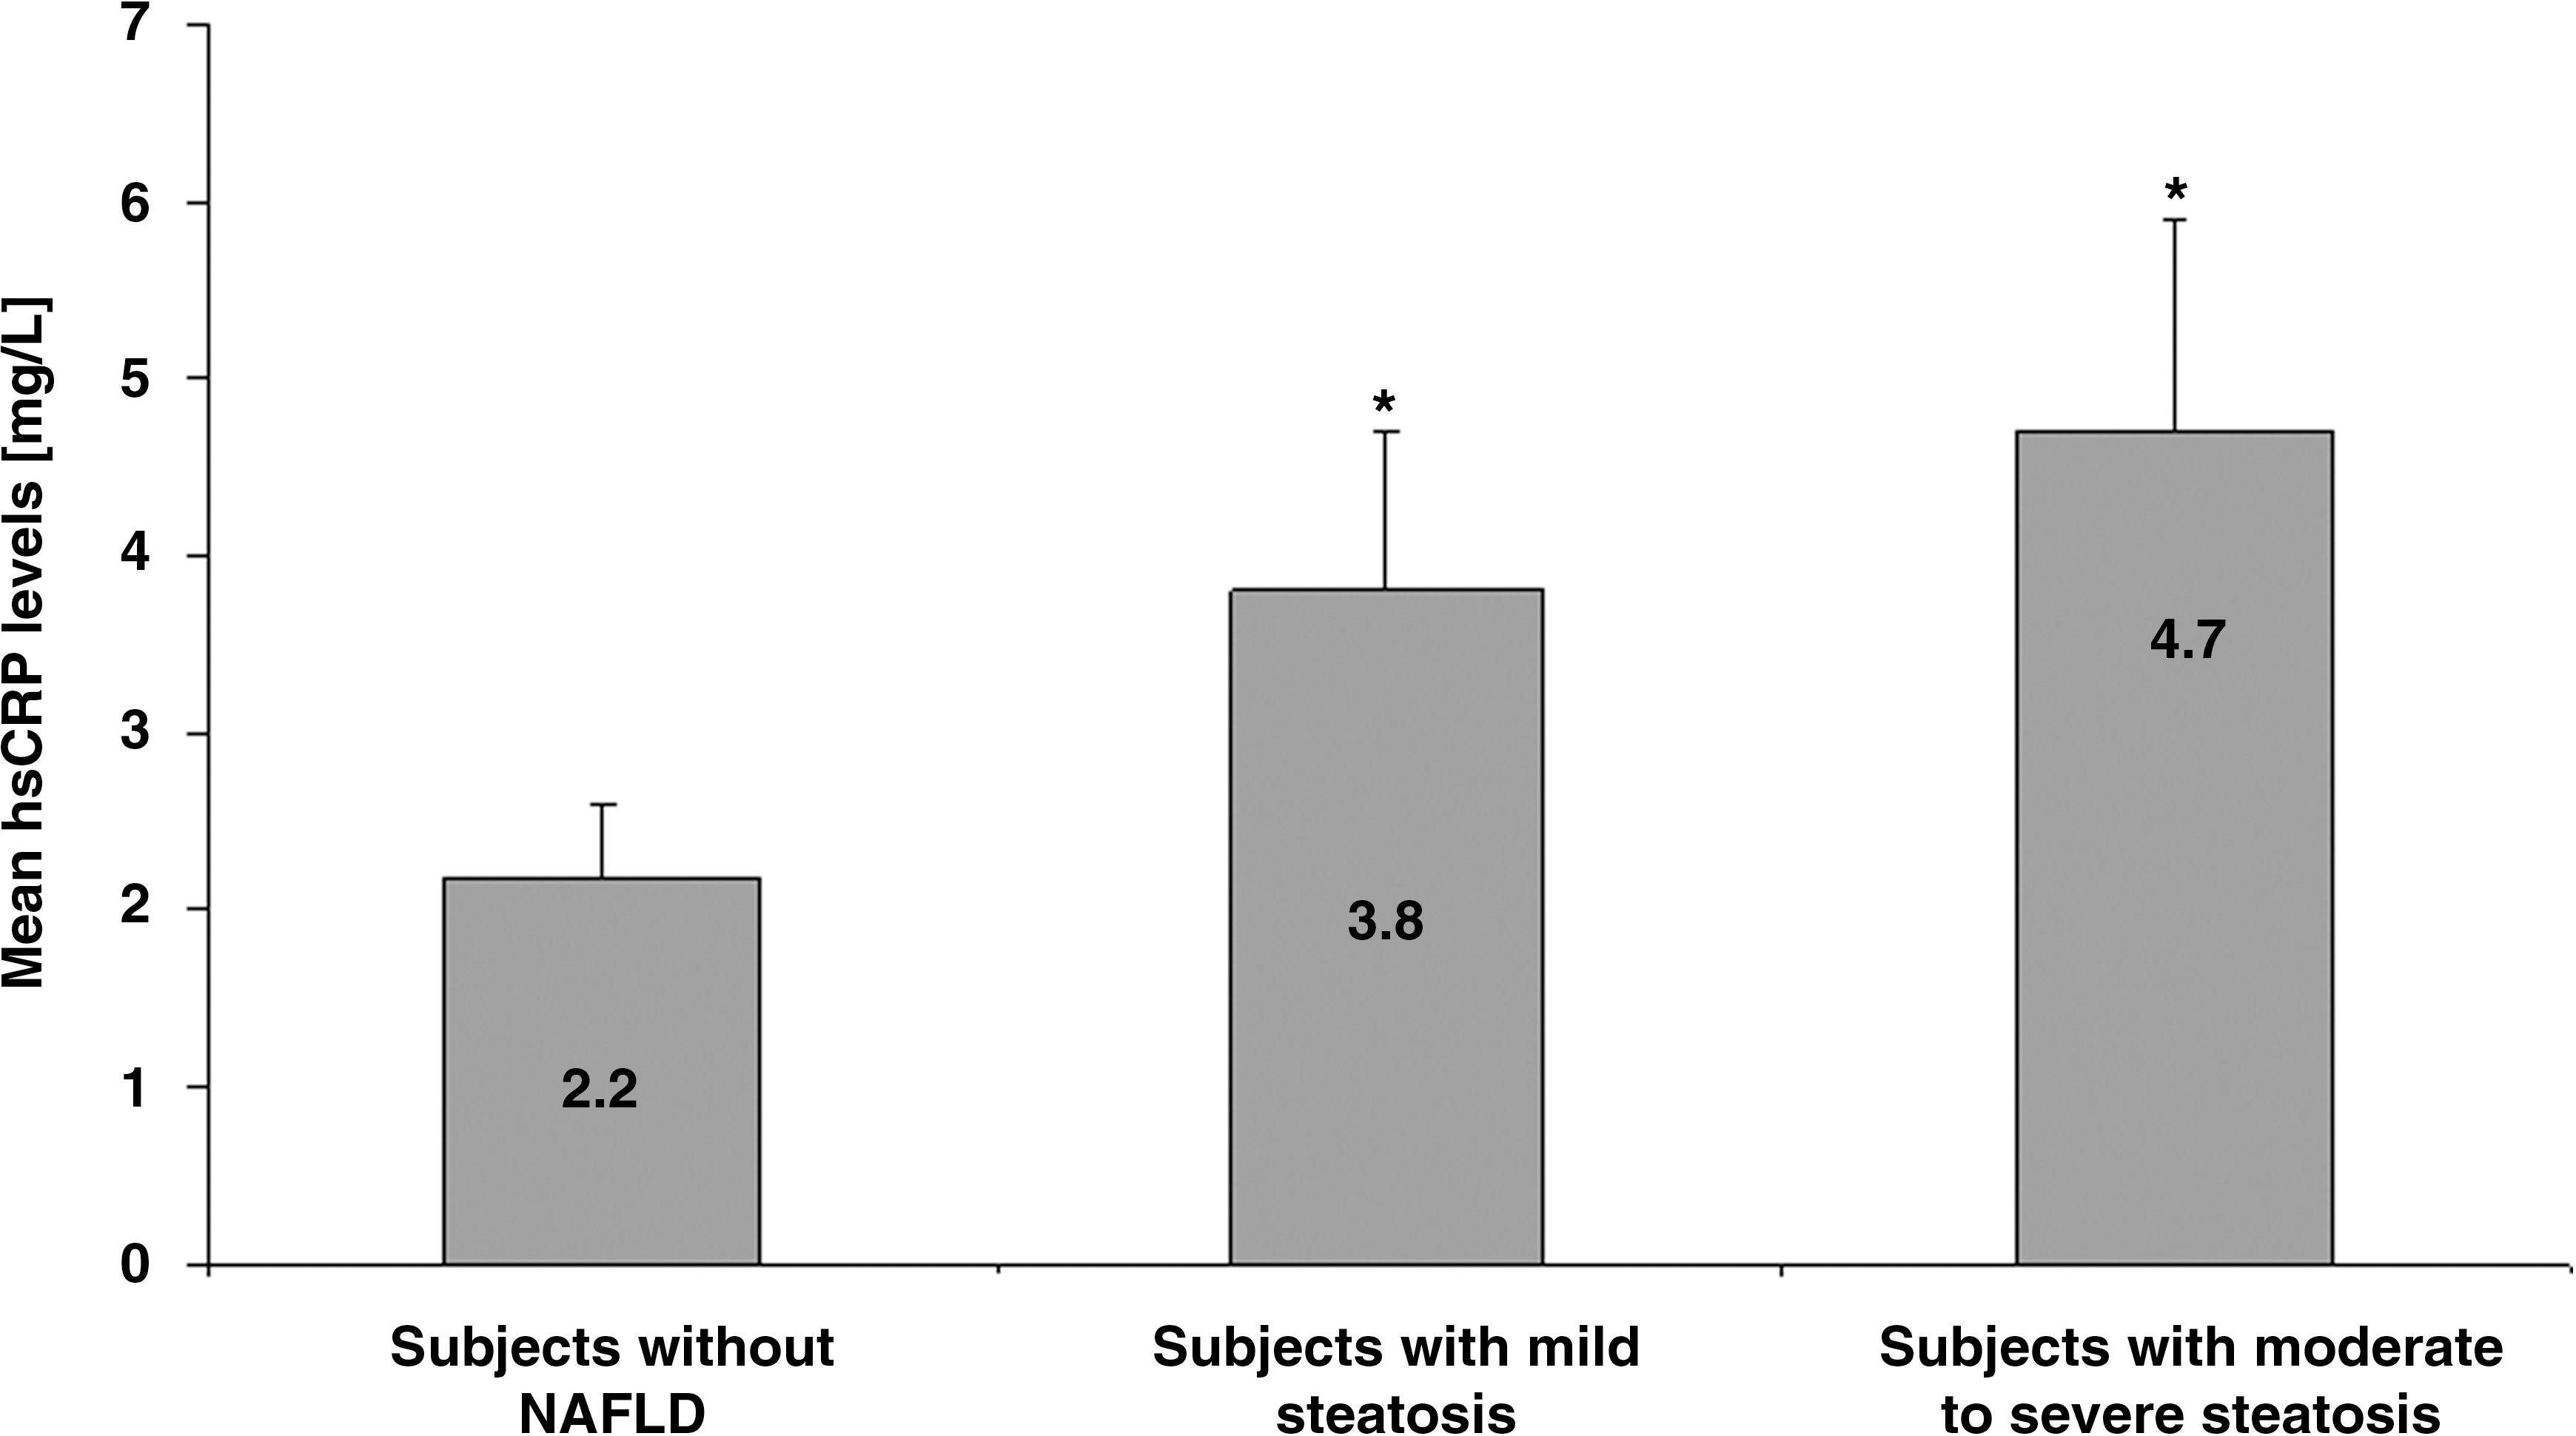
Mean high-sensitivity C-reactive protein (hsCRP) levels in relation to severity of nonalcoholic fatty liver disease (NAFLD). Data are mean±SD values. *P<0.001 compared with subjects without NAFLD.

Mean leukocyte count in relation to severity of nonalcoholic fatty liver disease (NAFLD). Data are mean±SD values. *P<0.05, **P<0.001 compared with subjects without NAFLD.
Table 2 presents the results of the univariate analysis of NAFLD with various metabolic risk variables. Waist circumference (P=0.04), HOMA-IR (P<0.001), type 2 diabetes (P<0.001), triglycerides (P=0.016), hsCRP (P<0.001), and leukocyte count (P<0.001) showed a significant association with NAFLD.
HDL, high-density lipoprotein; HOMA-IR, insulin resistance calculated by the homeostasis model of assessment; hsCRP, high-sensitivity C-reactive protein; NAFLD, nonalcoholic fatty liver disease.
Multiple logistic regression analyses were then conducted to identify independent risk factors of NAFLD. All the variables that had statistically significant differences on univariate analysis were introduced into the model using a forward stepwise regression. Table 3 presents the results of multiple logistic regression analyses. hsCRP had a significant association with NAFLD even after adjusting for waist circumference, insulin resistance, serum triglycerides, and presence of type 2 diabetes (odds ratio 1.293, 95% confidence interval 1.138–1.470, P<0.001). Leukocyte count also showed a significant association with NAFLD even after adjusting for waist circumference, insulin resistance, serum triglycerides, and presence of type 2 diabetes (odds ratio 1.293, 95% confidence interval 1.069–1.564, P=0.008).
The variables entered into the model were those that remained significantly associated with nonalcoholic fatty liver disease: waist circumference, insulin resistance, presence of type 2 diabetes, and triglycerides.
hsCRP, high-sensitivity C-reactive protein.
Discussion
The main findings of this study are (1) levels of inflammatory markers, hsCRP, and leukocyte count were significantly higher in subjects with NAFLD compared with subjects without NAFLD, (2) both hsCRP and leukocyte count increased with increasing severity of NAFLD, and (3) the association of hsCRP and leukocyte count with NAFLD remained statistically significant even after adjusting for waist circumference, insulin resistance, serum triglycerides, and presence of type 2 diabetes.
Subclinical inflammation has been reported in NAFLD subjects in different ethnic groups. 9,14 In our study, levels of inflammatory markers, hsCRP, and leukocyte count were increased in subjects with NAFLD. The importance of inflammation in NAFLD was highlighted by Yoneda et al., 15 who correlated the levels of hsCRP with severity of necroinflammation and fibrosis. Some studies have suggested that serum hsCRP could be used to distinguish patients with nonalcoholic steatohepatitis from those with simple steatosis. 15 The reasons for the higher serum hsCRP levels observed in NAFLD patients are still not clear, and this point needs further examination.
Previous reports have shown inconsistent results regarding the association of hsCRP with NAFLD. 16,17 Some studies failed to show an association of hsCRP with the histological severity of NAFLD. 18 In contrast, there are some studies that clearly suggest an association between elevated serum levels of hsCRP and the presence of NAFLD. 9,15 Other studies have reported increased serum levels of hsCRP in cases of histologically confirmed nonalcoholic steatohepatitis compared with simple nonprogressive steatosis. 15 Our study reinforces this by providing data on overall increased levels of hsCRP in subjects with NAFLD and also further increased levels in those with greater degree of steatosis. Unfortunately, we could not perform liver biopsy to confirm these findings because of logistic and ethical constraints.
An increased leukocyte count has been linked to chronic low-grade inflammation and insulin resistance. 19 Increased levels of leukocyte count, even within the normal range, have been associated with cardiovascular disease (coronary artery disease), type 2 diabetes, and metabolic syndrome. 20,21 A recent study has reported that total leukocyte count was elevated in Korean patients with NAFLD, suggesting the role of inflammatory processes in the development of NAFLD. 22 In the present study, leukocyte count was significantly increased in subjects with NAFLD. The results of the current study are in agreement with those of previous studies and suggest that hepatic steatosis may not be a simple fat deposition in the liver but may reflect a systemic inflammation, although to prove this, we would need mechanistic studies as well as long-term prospective studies.
The mechanism linking leukocyte count and NAFLD remains unclear, although several explanations could be offered. Oxidative stress and insulin resistance are major contributors in the pathogenesis of NAFLD. 23 NAFLD is, in fact, considered a hepatic manifestation of insulin resistance resulting in hepatic lipid accumulation, which is an important step in the development of NAFLD. It also provides a source of oxidative stress triggering the inflammatory process. Many experimental models 24 and human studies 25 have found a strong association between severity of nonalcoholic steatohepatitis and degree of oxidative stress. In our earlier study, we showed that increased oxidative stress is independently associated with NAFLD. NAFLD was also shown to be associated with hypoglutathionemia and hypoadiponectinemia. 26 NAFLD and other insulin-resistant states are associated with activation of the innate immune system, resulting in chronic subclinical inflammation. 27 Some studies have documented a significant association between leukocyte count and the metabolic syndrome. 2 Both leukocyte count and hsCRP were shown to be significantly correlated with insulin resistance among Asian Indians. 2 Thus the proposed mechanism connecting increased leukocyte count and hsCRP with NAFLD could be insulin resistance, oxidative stress, and chronic low-grade inflammation, although these are purely speculative
The close associations among hepatic steatosis, obesity, and cardiometabolic risk factors have led to the suggestion that hepatic steatosis may be an additional component of the metabolic syndrome. In individuals with high hsCRP and leukocyte count, there is a high risk of cardiovascular disease, 3,28 but it is unknown whether this risk extends to subjects with NAFLD. Brea et al. 29 showed that subjects with NAFLD had higher hsCRP concentrations and increased risk of atherosclerosis. In the present study, the odds ratios of hsCRP and leukocyte count for NAFLD were 1.293 and 1.293, respectively, after adjusting for all other factors that were significant on univariate analysis. As elevated hsCRP and leukocyte count are independent factors involved in cardiovascular disease and metabolic syndrome, 5,30 we speculate that subjects with NAFLD might be prone to develop cardiovascular complications, particularly considering the bivariate model proposed by Ridker. 31
One of our limitations is that this is a cross-sectional study. and hence no cause–effect relationship can be offered, as this would require a longitudinal follow-up study. However, the strengths of the study are that the subjects were recruited from a population-based study, careful inclusion/exclusion criteria were used, and careful characterization of the study subjects was done. The criterion used for diagnosis of NAFLD in our study is another limitation as it was based on ultrasonography and was not confirmed by liver biopsy. However, doing liver biopsy is neither feasible nor ethical in epidemiological studies as there is a small risk of bleeding associated with the procedure. However, ultrasonography remains the most common method of diagnosing NAFLD in large-scale screening studies. It has been reported that the presence of >33% fat on liver biopsy is optimal for ultrasound detection of steatosis. 32
In conclusion, we report that in Asian Indians, hsCRP and leukocyte count are associated with NAFLD after adjusting for conventional cardiometabolic risk factors.
Footnotes
Acknowledgments
We are grateful to the Chennai Willingdon Corporate Foundation, Chennai, India, for the financial support. This is the 122nd publication of CURES (CURES-122).
Author Disclosure Statement
No competing financial interests exist.