
Abstract
Aim/Introduction:
Subsample analysis was performed to examine whether dose optimization of insulin glargine (Lantus®; sanofi-aventis K.K., Tokyo, Japan) contributed to achieving a target glycosylated hemoglobin (HbA1c) (<7.0%) by using the data from the Add-on Lantus to Oral Hypoglycemic Agents (ALOHA) study, a 24-week observational study of Japanese type 2 diabetes patients. We investigated the conditions of optimal dose titration by identifying patient background of dose-achiever and non-achiever subgroups.
Subjects and Methods:
The insulin-naive patients (n=3,180) were categorized into four groups depending on their HbA1c and insulin glargine dose at 24 weeks: patients with HbA1c <7.0% and dose <8.5 U/day (Group 1), HbA1c <7.0% and dose ≥8.5 U/day (Group 2), HbA1c ≥7.0% and dose <8.5 U/day (Group 3), and HbA1c ≥7.0% and dose ≥8.5 U/day (Group 4).
Results:
The greatest reduction in HbA1c was observed in Group 2 (–2.7%, P<0.001 vs. Group 3 or 4). Fasting plasma glucose (FPG) in Group 2 at 24 weeks (113.3 mg/dL) was significantly lower than in either Group 3 or 4 (135.4 mg/dL and 150.0 mg/dL, respectively; P<0.001 for both). The starting dose and the change of insulin glargine dose were significantly greater in Group 2 than in Group 3 (0.142 vs. 0.086 U/kg/day [P<0.001] and +5.0 vs. +1.1 U/day [P<0.001], respectively), whereas the baseline HbA1c levels and body mass index were comparable (9.3% vs. 9.4% and 23.5 kg/m2 vs. 23.3 kg/m2, respectively).
Conclusions:
Our results suggest that appropriate starting dosage and subsequent dose adjustment are essential to achieve target HbA1c (<7%) and that the FPG level should be decreased to be 110 mg/dL or below for this achievement.
Introduction
The non-adherence may arise from insufficient evidence on optimal insulin dosage to achieve better glycemic control in Japanese type 2 diabetes patients. Many studies have reported that Western patients treated with timely titrated insulin glargine doses based on FPG-monitored algorithm showed a greater achievement rate of HbA1c compared with patients treated with inappropriately titrated dosages. 2 However, evidence for optimal titration is not well established in Japanese populations; they have a different anthropometry of the body and capability of insulin secretion, namely, the insulin-insufficient type, unlike the insulin-resistant type common in Western populations. 8
To demonstrate the roles of dose optimization in achieving the optimal HbA1c target (<7.0%), we retrospectively explored the conditions of optimal dose titration by identifying patient background of dose-achiever and non-achiever subgroups, stratified by the target HbA1c achievement and the final average dose of insulin glargine (here Lantus® [sanofi-aventis K.K., Tokyo, Japan] was used) in achiever groups, using a subsample of the Add-on Lantus to Oral Hypoglycemic Agents (ALOHA) study, which is a 24-week, prospective, open-label, multicenter, observational study to assess the safety and effectiveness of basal supported oral therapy (BOT) using insulin glargine in Japanese patients with type 2 diabetes. 9
Materials and Methods
Study design and patients
The ALOHA study was conducted as postmarketing surveillance between 2007 and 2009 in 987 hospitals and clinics. The study results have been reported previously. 9 Japanese patients with type 2 diabetes who were to start BOT with insulin glargine were eligible to be documented in the ALOHA study, and all the eligible patients satisfied the following criteria in the 4-week screening period: (1) Subjects had been previously treated with oral antidiabetes drug(s) [OAD(s)] for 12 weeks. (2) HbA1c was ≥7.9% and <12.4% (these values were originally set as JDS values of ≥7.5% and <12.0%, respectively). HbA1c was collected as the JDS value and was converted to the National Glycohemoglobin Standardization Program (NGSP) equivalent value by the following conversion formula: HbA1c (NGSP)=HbA1c (JDS)+0.4%. 10 The NGSP equivalent value is used in this report. (3) The body mass index (BMI) (weight in kilograms divided by the square of height in meters) was ≤30 kg/m2.
This study was conducted in conformity with the ethical principles of the Declaration of Helsinki, the Good Postmarketing Study Practice, and Good Vigilance Practice in Japan.
Treatment, follow-up, and assessment
The starting and adjusting doses and the timing of insulin glargine administration were at the discretion of attending physicians. In other words, the method of treatment was not defined. Concomitant OAD(s) were also selected by the physicians as part of routine clinical care. Safety and effectiveness data were collected during 24 weeks. With regard to safety, all adverse events reported during the observational period were documented. A causal relationship between adverse events and insulin glargine was assessed by attending physicians. Effectiveness parameters included HbA1c, FPG, PPG, and weight. Overall effectiveness of the BOT for each patient was assessed by each patient's physician at the end of follow-up in three categories: “effective,” “partly effective,” and “ineffective.”
Summary results of the ALOHA study
A brief description of the summary results of the ALOHA study follows. In total, 5,223 patients were enrolled, and safety and effectiveness data were available for 4,219 and 3,954 patients, respectively. The age of patients in the safety assessment population (mean±SD) was 62.8±12.1 years, and 2,485 patients (58.9%) were male. As to safety, 44 patients experienced hypoglycemic episodes (43 with symptomatic, including two with severe and two with loss of consciousness [a total of four with severe hypoglycemia (0.1%)], and one with asymptomatic hypoglycemia detected by the attending physician). With regard to effectiveness, the reductions of the mean HbA1c, FPG, and PPG from baseline were 1.43±1.23%, 59.7±65.9 mg/dL, and 60.7±92.4 mg/dL, respectively (P<0.0001 for all by paired t test). The increase of the mean weight from baseline was 0.83±2.52 kg (P<0.0001 by paired t test). Of 3,954 patients in the effectiveness set, 588 (14.9%) achieved HbA1c<7.0%, 2,984 (75.5%) failed, and 382 (9.7%) were missed in the last observation. Owing to missing data on nine patients, the mean daily doses for 3,943 patients were 7.1±5.7 U/day at baseline and 10.4±6.8 U/day at end point. Altogether, 3,690 patients (93.3%) received the once-daily injection at the same time each day: 1,570 (42.5%) in the morning, 1,559 (42.2%) at bedtime, 498 (13.5%) in the evening, and 63 (1.7%) in the afternoon.
Statistical analysis
The insulin-naive patient subgroup whose insulin glargine dose and HbA1c data at 24 weeks or the patient's last observation (the final visit) were available (n=3,180) was used for this subanalysis (Fig. 1). The last-observation-carried-forward method was used to impute the missing data from patients who dropped out or discontinued treatment. Patients who achieved HbA1c <7.0% at the final visit were categorized as “achievers,” and the others were categorized as “non-achievers.” Patients are also categorized by the mean dose of insulin glargine at the final visit. The cutoff point was set at 8.5 U/day, the average daily dose at the final visit in the achiever group. Four groups are compared in this analysis: achievers with a dose of <8.5 U/day (labeled Group 1), achievers with a dose of ≥8.5 U/day (Group 2), non-achievers with a dose of <8.5 (Group 3), and non-achievers with a dose of ≥8.5 (Group 4).
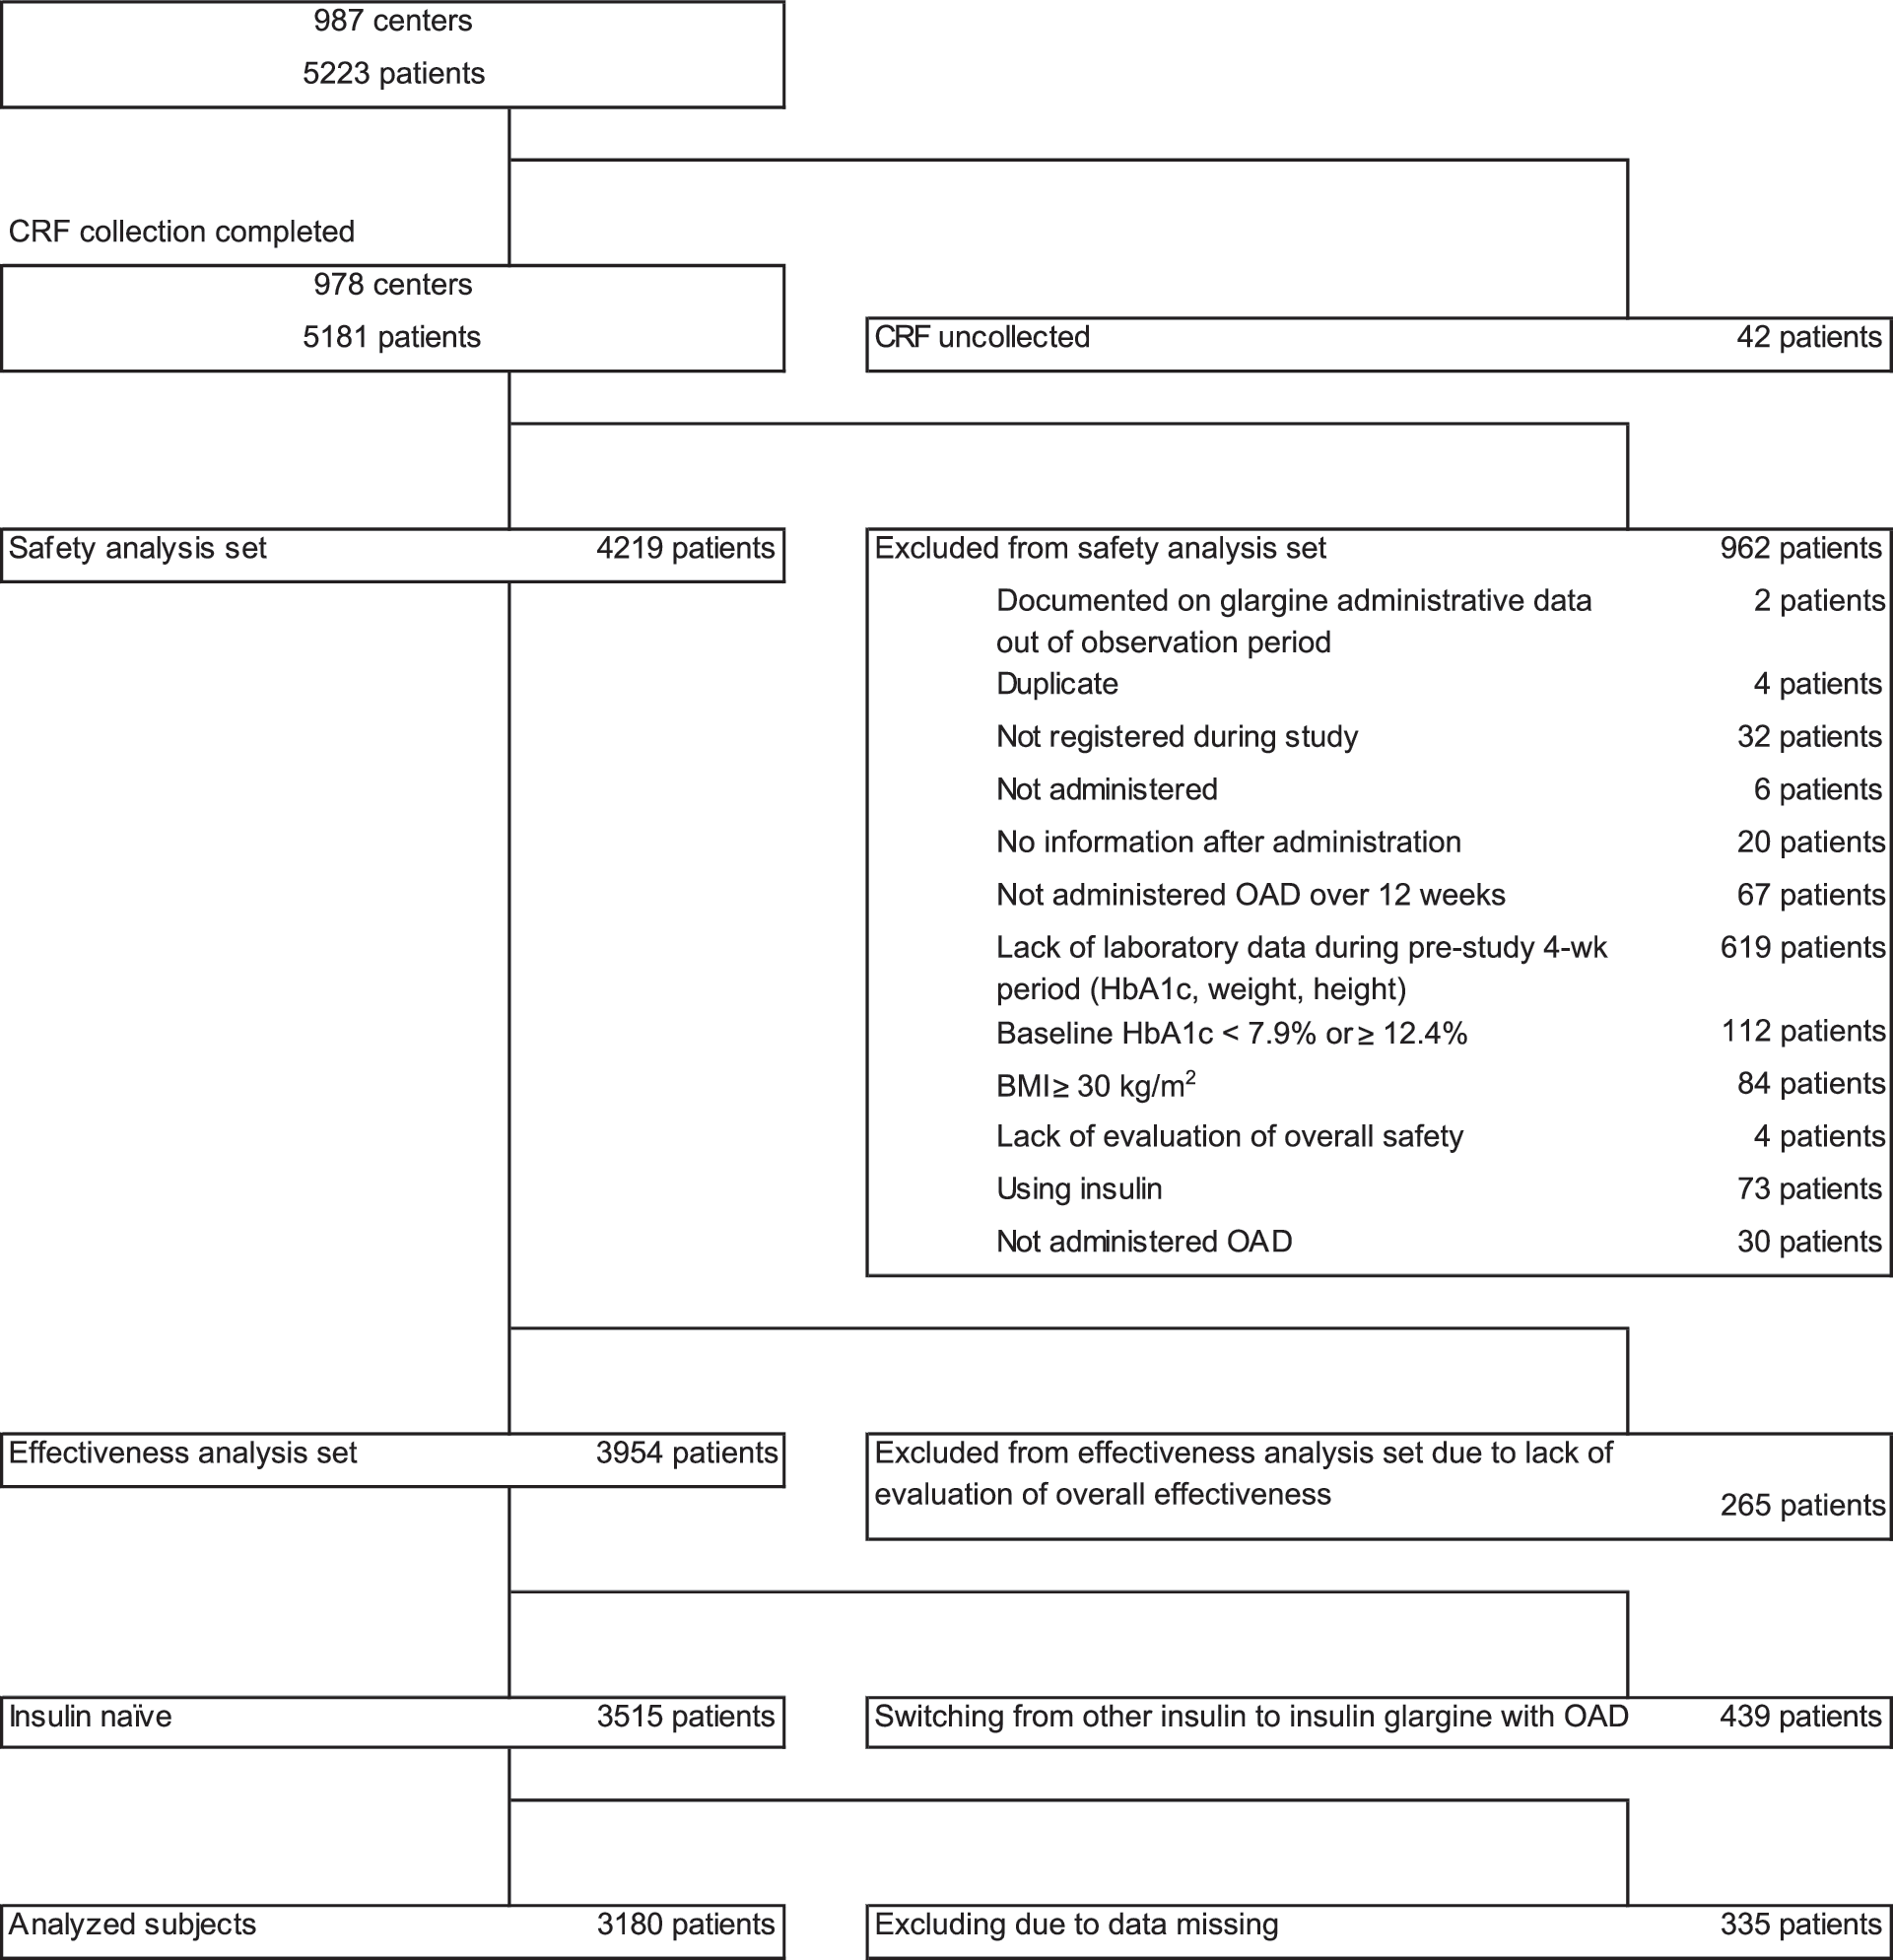
Disposition of patients in the Add-on Lantus to Oral Hypoglycemic Agents (ALOHA) study. BMI, body mass index; CRF, case report form; HbA1c, glycosylated hemoglobin; OAD, oral antidiabetes drug.
Demographic and clinical data were summarized with descriptive statistics. Intergroup comparison between two groups with optimal insulin glargine dose (Groups 2 and 4) or another two groups with similar baseline HbA1c levels but different insulin glargine dosing (Groups 2 and 3) was performed for the exploration of differences in clinical variables. P values were adjusted using the method of Hochberg 11 for multiple comparisons. Insulin glargine dose titration and glycemic control over time of Group 2 was shown in a line graph in order to illustrate a “nearly ideal and recommended” trend curve.
All statistical tests were two-tailed, and P<0.05 was considered to indicate statistical significance. The statistical calculations were conducted using SAS System software (version 9.1.3, SAS Institute, Cary, NC) and R 2.13.1. 12
Results
Baseline characteristics
The baseline characteristics of 3,180 insulin-naive patients whose HbA1c and dose were documented at both baseline and final visit are summarized by group in Table 1. Of these patients, 545 patients (17.1%) achieved an HbA1c level of 7.0% at final visit (achievers), whereas 2,635 patients (82.9%) did not achieve the target level (non-achievers). Achievers with a last-observed dose of less than 8.5 U/day consisted of 363 patients (Group 1), and achievers with a last-observed dose of 8.5 U/day or more consisted of 182 patients (Group 2). Non-achievers with a last-observed dose of less than 8.5 U/day consisted of 1,353 patients (Group 3), and non-achievers with a last-observed dose of 8.5 U/day or more consisted of 1,282 patients (Group 4). Group 2 showed significantly shorter diabetes duration (P<0.05), fewer pre-study OADs (P<0.05), and lower prevalence rate of retinopathy (P<0.05) compared with Group 3. Group 2 also showed significantly older age (P<0.05) and lower BMI (P<0.001) compared with Group 4.
Data are n (%) unless indicated otherwise.
P values were adjusted by using Hochberg's multiple comparison adjustment.
By χ2 test.
By unpaired t test.
By Fisher's exact test.
BMI, body mass index; HbA1c, glycosylated hemoglobin; NS, not significant; OAD, oral antidiabetes drug.
Starting and last-observed dose of insulin glargine, compliance with diet and exercise therapy, and hypoglycemic episodes
As shown in Table 2, the last-observed insulin glargine dose (mean±SD) was 8.5±5.4 U/day in achievers and 9.8±5.4 U/day in non-achievers (9.6±5.4 U/day overall). The starting dose of insulin glargine in Group 2 (0.142 U/kg/day) was the highest among the groups and statistically higher than in either Group 3 or 4 (both P<0.001). The proportion of patients who complied well with both diet and exercise therapy was higher in achievers. The proportion of patients with good compliance in Group 2 (43.4%) was significantly higher than in Group 3 and 4 (29.1% and 22.9%, respectively; both P<0.001). The number of cases who experienced hypoglycemic episodes did not increase despite the starting or last-observed dose of glargine.
Data are n (%) unless indicated otherwise.
P values were adjusted by using Hochberg's multiple comparison adjustment.
By unpaired t test.
By χ2 test.
By Fisher's exact test.
Others included Fair, Poor, and No instruction.
HbA1c, glycosylated hemoglobin; NS, not significant; OAD, oral antidiabetes drug.
Baseline/last-observed value and change in insulin glargine dose, glycemic levels, and weight
Table 3 shows the baseline/last-observed value and the change in insulin glargine dose, glycemic levels, and weight by group. The glargine dose significantly increased in all the groups (all P<0.001). The lowest change was observed in Group 1 and the greatest in Group 4. With regard to HbA1c, the baseline value was lowest in Group 1 (9.0%) and the highest in Group 4 (9.8%). The baseline HbA1c in Group 2 was significantly lower than that in Group 4 (P<0.001) but did not differ from that in Group 3. The greatest reduction was observed in Group 2 (−2.7%; P<0.001).
Data are mean±SD values (n).
P values were adjusted by using Hochberg's multiple comparison adjustment.
FPG, fasting plasma glucose; HbA1c, glycosylated hemoglobin; NS, not significant; PPG, postprandial plasma glucose.
The FPG level significantly decreased in all the groups (all P<0.001). The baseline FPG was lowest in Group 3 (184.9 mg/dL) and highest in Group 4 (212.5 mg/dL). The baseline FPG in Group 2 was significantly higher than in Group 3 (211.4 mg/dL vs. 184.9 mg/dL; P<0.05) and was not significantly different from that in Group 4 (211.4 mg/dL vs. 212.5 mg/dL). The last-observed FPG was lowest in Group 2 (113.3 mg/dL) and significantly lower than in either Group 3 or 4 (135.4 mg/dL and 150.0 mg/dL, respectively; both P<0.001). Similarly, the baseline values of the PPG were not significantly different between Group 2 and 4 (285.8 mg/dL vs. 286.1 mg/dL); however, the value at the final visit was significantly lower in Group 2 (175.3 mg/dL vs. 217.8 mg/dL; P<0.001). With regard to weight, a significant increase in the course of treatment was observed except in Group 1. The change in Group 2 was not significantly different from that in Groups 3 and 4.
Insulin glargine dose, HbA1c, and FPG in Group 2 through the observational period
As shown in Figure 2, the mean dose in Group 2 started from 8.6 U/day and reached 13.7 U/day at 24 weeks (no last-observation-carried-forward imputation). The slope of dose adjustment until 8 weeks was higher than that in the rest of the period (increase of around 4 U/day during 8 weeks). The mean HbA1c started from 9.3% at baseline and decreased to 6.6% at 24 weeks. The mean FPG started from 211.4 mg/dL at baseline and was suppressed to 113.1 mg/dL at 24 weeks. The greatest reduction was observed in 4 weeks.

Trend of glargine dose, glycosylated hemoglobin (HbA1c), and fasting plasma glucose (FPG) in Group 2.
Discussion
This subsample analysis was performed to examine whether dose optimization of insulin glargine contributed to achievement of a target HbA1c level of <7.0% by using real-life data. The subsample consisted of 3,180 insulin-naive patients with type 2 diabetes who were previously suboptimally controlled on OAD(s) and started BOT with insulin glargine. The results from this analysis suggest that both an appropriate starting dose and titration were major factors in achieving good glycemic control. Also, the importance of achieving good control targeting around 110 mg/dL of FPG has been demonstrated. Provided that these treatment indicators are satisfied, good glycemic control (HbA1c <7.0%) can be accomplished even if from a relatively high baseline HbA1c level around 9.5% in real-life.
Patients with an appropriate starting dose are more likely to achieve a glycemic target. A substantial starting dose of insulin glargine of approximately 10 U/day was used in many “Treat-to-Target” interventional trials conducted on Western and Asian populations. 1,13 –18 In addition, a 9-month observational study on glargine BOT in Germany demonstrated that the mean starting dose was also substantial (13.8 U/day), and the mean dose at 9 months was 19.4 U/day. 19 In the present study, however, the mean starting dose ranged from 4.9 to 8.6 U/day (from 0.086 to 0.142 U/kg/day). The dose given to the highest dose group (8.6 U/day, 0.142 U/kg/day) was still lower than the dose given in the studies mentioned above, the dose recommended by a prior review article (0.15 U/kg/day), 20 and the American Diabetes Association–European Association for the Study of Diabetes consensus starting dose (i.e., 0.2 U/kg/day). 3 Among all the groups, Group 2 started with the highest dose of insulin glargine (8.6 U/day, 0.142 U/kg/day) and showed the lowest last-observed FPG (around 110 mg/dL). These results suggest the importance of a relatively higher starting dose (approximately 0.15 U/kg/day) for better glycemic control using insulin glargine. One possible explanation is that β-cell function recovers and that protracted glycemic remission is achieved by minimizing hyperglycemic duration through provision of initially intensive glycemic control with insulin therapy. 21 Furthermore, one clinical study suggested that increasing the dose from a modest starting level can result in non-target achievers. 22
In addition, appropriate titration is another key to success in better glycemic control. For appropriate titration, FPG should be frequently monitored to determine whether its level reaches around 110 mg/dL. 3 In non-achievers (83.8% of analyzed subjects) in this study, however, the last-observed FPG was around 135–150 mg/dL. This may indicate the lack of achievement of proper target FPG level, namely, approximately 110 mg/dL.
On the other hand, it should be noted that not only dose titration achieved a good glycemic control when considering that the mean last-observed dose of achievers (8.5 U/day) was lower than that of non-achievers (9.8 U/day). Achiever subgroups included several patients with a good compliance of diet and exercise, without increase of weight, and with a low baseline BMI and HbA1c, especially in Group 1. In brief, the effectiveness of insulin therapy will be supported by weight control with diet and exercise therapy 23 and insulinization at an early stage of diabetes. 24
We compared the results of Group 2 with those of Group 3, both of which have a similar HbA1c levels and BMI at baseline. As a result, we found that other baseline factors and compliance of diet and exercise therapy may be related to the reluctance of physicians to titrate insulin glargine sufficiently. For instance, a longer duration after diagnosis, higher prevalence rate of nephropathy and retinopathy at baseline, and worse compliance of diet and exercise in Group 3 might be related to the lower insulin dose and higher glycemic levels at the last observation compared with those of Group 2. It is important that the ACCORD subanalysis suggested that longer duration of diabetes and history of macro- and microvascular complications were associated with an increased risk of all-cause mortality. 25 Furthermore, effectiveness in glycemic control reduced in patients with microvascular complications compared with those without. 26 These observations suggest that existence of diabetes complications, especially with longer diabetes history, may lead physicians to choose less intensive titration of insulin.
Then, we compared the results of Group 2 (achievers) with those of Group 4 (non-achievers), both of which have similar levels of last-observed dose. However, the glycemic control was poorer in Group 4. As for patient backgrounds, Group 4 had greater BMI and higher baseline HbA1c levels than Group 2. As for dosage, Group 4 had a lower starting dose than Group 2. From the viewpoint of dose optimization, a much higher dose of insulin glargine seemed necessary in Group 4 because their last-observed FPG levels are high (150 mg/dL). In contrast, previous studies demonstrate that a forced insulin titration based on FPG-monitored algorithm provides achievement of the FPG of 110 mg/dL at the final evaluation and successful HbA1c reduction. 1,13,15,16,18,27
We did not focus on the comparison between Group 1 and the other groups because this study engaged in identifying the achiever group with optimal insulin glargine titration. As shown in Table 2, Group 1 was a group with a high compliance other than insulin (i.e., diet and exercise). Additionally, baseline HbA1c was the lowest among the four groups, which was another different point. Therefore, because this group was not comparable with other groups, we did not conduct any statistical analysis.
In Asian type 2 diabetes, evidence should be accumulated to confirm the importance of a forced titration algorithm with FPG monitoring. 18 Asian populations have a different body anthropometry and capability of insulin secretion. Thus, they may have a different type of diabetes, namely, the insulin-insufficient type, which is unlike the insulin-resistant type common in Western type 2 diabetes populations, where obese patients with a BMI of over 30 kg/m2 are dominant. 8,13 –16,27 Therefore, the difference in titration algorithms between Asian and Western populations needs to be further clarified. The ongoing Asian Treat to Target Lantus Study (ATLAS), which compares the effectiveness of patient- versus physician-led initiation and titration of insulin glargine, addresses this issue and will reveal the effectiveness of an FPG-based titration algorithm in the management of Japanese type 2 diabetes patients. 28
Finally, we mention several limitations to be acknowledged and addressed in this study. First, this analysis was not intended to demonstrate a causal relationship between dose titration and subsequent improvement of glycemic control but to explore their association in a real-life clinical setting. In fact, the 17.1% achievement rate of HbA1c <7.0% was lower than other trials revealing the efficacy of treat-to-target with insulin glargine (around 30–60%). 1,13 –15,17 In Japan, this number was comparable with other studies. For example, a retrospective database study using real-life clinical data with insulin glargine treatment reported average HbA1c decreased to 8.21±1.10% 4 months (this level continued to 12 months) after starting insulin glargine injection, where the mean and SD can estimate 13.6% of a worse achievement rate of <7.0% than our study results. 7 Additionally, an insulin aspart 30-mix insulin real-life study named IMPROVE, consistent with our study subjects from the viewpoint of being a real-life postmarketing surveillance, found HbA1c improvement from 9.9±1.8% to 8.0±1.4% during 26 weeks, where a comparable low (23.8%) achievement rate of <7.0% can be estimated. 29 Second, the optimal dosage for Japanese type 2 diabetes patients remains unproven in this study: the ATLAS study 28 will warrant this in future. Third, the generalizability of findings is limited because of the effect of sample selection. The patient populations in this study exhibited relatively less obesity (mean BMI of 23.8 kg/m2) compared with many studies on Western populations. 27 Therefore, the findings from this study may be limited to use for Asian populations with lean body composition.
In conclusion, our result suggests that appropriate starting dosage and subsequent dose adjustment are essential to achieve target HbA1c (<7.0%), and the last-observed FPG level should be decreased to be 110 mg/dL or below for this achievement.
Footnotes
Acknowledgments
We wish to thank all the physicians at the 987 hospitals and clinics who participated in the ALOHA study. This study was sponsored by sanofi-aventis K.K.
Author Disclosure Statement
Both M.O. and T.K. received advisory board fees as publication committee members and work for the institutes that participated in this research and also received research fees from sanofi-aventis K.K. T.O. works for sanofi-aventis K.K.