
Abstract
Objective:
According to recent reports, the development of type 2 diabetes in China has soared at an alarming rate. However, most of the investigations were based on Han people, who account for the majority of people in China. Little is known about the prevalence of diabetes its chronic complications in the She people, who have their own traditional lifestyle and hereditable background, different from other Asian population. The present study investigated the prevalence of type 2 diabetes and associated risk factors in the adult population of She nationals.
Subjects and Methods:
A total of 5,385 participants entered into the analysis eventually, including 2,308 men and 3,077 women. An oral glucose tolerance test was performed in subjects without diagnosed diabetes. Liver function, cardiovascular risk (brachial–ankle pulse wave velocity, estimated glomerular filtration rate, and abnormal Minnesota codes findings), uric acid, and neuropathy were tested to assess the profiles of associated risks.
Results:
In general, the self-reported diabetes rate was 9.5%. After age and sex standardization, the prevalence of diabetes was 6.1% (6.7% for men and 5.7% for women) in She Chinese people. In logistic regression models, age, family history of diabetes, alcohol use, total cholesterol, and triglycerides were all significantly associated with the risk of diabetes in this cross-sectional study (all P<0.05). In all, 47.4% had cardiovascular risks, 19.4% had liver dysfunction, and 6.2% had hyperuricemia. For women, compared with the first quartile, log-transformed homeostasis model assessment for insulin resistance of the fourth quartile was significantly higher (P<0.05), and log-transformed homeostasis model assessment for β cells was also higher in the second, third, and fourth quartiles (all P<0.05). The prevalences of polyneuropathy in impaired fasting glucose (IFG), impaired glucose tolerance (IGT), IFG/IGT, and diabetes mellitus (DM) were 16.1%, 13.1%, 18.6%, and 28.4% separately, which was higher than that in normal glucose tolerance. The prevalences of polyneuropathy in IFG/IGT and DM were higher than that in IGT.
Conclusions:
The present study revealed that a total of 6.1% She people suffered from type 2 diabetes, which was lower than the average level of China, but the standardized prevalence of prediabetes was higher, 20.6%. Early peripheral neuropathy screening should be performed in the prediabetes population. The Toronto Clinical Neuropathy Scoring System is convenient to assess diabetic polyneuropathy in clinical practice and should be tested regularly for people in prediabetes. Liver dysfunction, headache, and insomnia, appearing before type 2 diabetes, should be assessed regularly to avoid deterioration.
Introduction
However, until now, the prevalence of diabetes in the She ethnic minority group of China is unknown. The She ethnic minority, accounting for nearly 5.4% of the population in China, has its own traditional lifestyle and hereditable background, different from those of other Asian population. In China, most She Chinese live around mountains, with simple lifestyles, and most of them do farming work, accompanied with much physical work. They cluster in Southeast China, such as in Fujian, Zhejiang, and Guangdong Provinces, and nearly half of them reside in Fujian Ningde city.
From April to September 2009, a cross-sectional investigation was conducted to investigate the prevalence of type 2 diabetes and associated risk factors in the She population.
Research Design and Methods
Study population
A multistage, stratified, cluster random sampling method was used to select an ethnically representative sample of individuals 20 years of age or older in the She nationality population. According to the distribution of She nationality, we selected samples mostly in the Ningde area (subjects were selected from the city, townships, and rural villages). We excluded those who identified themselves other than She Chinese people, those who had missing data, and pregnant women. Among the 5,385 remaining, 2,308 men and 3,077 women entered into the analysis. All investigators and staff members were clinicians from Ningde Municipal Teaching Hospital and had successfully completed a training program that oriented them both to the aims of the study and to the specific tools and methodologies used.
The institutional review board or ethics committees at participating institutions approved this study protocol. Written informed consent was obtained from all participants before data collection.
Study design
Subjects were requested to fast from food for 8–12 h and attend the investigation at the local clinic between 8:00 a.m. and 9:00 a.m. Data collection was conducted in examination centers at local health stations or community clinics in the participants' residential area. All participants were asked to complete standard questionnaires, which refer to demographic characteristics, personal and family medical history, and lifestyle risk factors. The interview questions included the diagnosis and treatment of diabetes, hypertension, and cardiovascular diseases and the presence of headache, insomnia, and epilepsy. Height, weight, and waist circumference were measured with subjects lightly clothed. Body mass index was calculated by dividing weight by height squared (kg/m2). Blood pressure was measured twice by investigators, using a manual sphygmomanometer in the right arm with the subject in the sitting position, and the mean of the two readings was used for analysis.
A fasting venous blood specimen for measurement of plasma glucose was collected using a vacuum tube containing sodium fluoride. The specimens were stored at −20°C until laboratory assays could be carried out, and then laboratory tests were done in the Ningde Municipal Teaching Hospital. All subjects except those previously diagnosed with type 2 diabetes were administered to a 75-g oral glucose tolerance test, and 5 mL of blood was collected at 120 min for measurement of plasma glucose.
After subjects had rested in a supine position for more than 5 min, brachial–ankle pulse wave velocity (baPWV) was measured using an automatic waveform analyzer (model VP-2000, Colin Co., Komaki, Japan). This device can record pulse wave by sensors in the cuffs and store data on the start point of each pulse wave in the right arm and both legs in memory. The baPWV was calculated by the average of left and right pulse wave velocities. A standard 12-lead electrocardiogram (ECG) was recorded for all subjects by two professional clinicians, at a paper speed of 25 mm/s, and was coded with the Minnesota code criteria 3 by two professional clinicians. In the case of differences in each assessment, a third clinician was involved.
According to the Pooling Project 4 classification, major changed Minnesota ECG codes, such as obvious Minnesota code Q-wave (1-1, 1-2), ST-segment depression (4-1, 4-2), T-wave inversion code (5-1, 5-2), II atrioventricular block (6-1, 6-2), bundle branch block code (7-1, 7-2, 7-4), and arrhythmia (8-1, 8-3) were listed as major abnormal ECG; others were considered non-major abnormal.
The Toronto Clinical Neuropathy Scoring System (TCSS) is shown in Table 1. Each patient was questioned as to the presence or absence of those characteristics. Six points are derived from symptoms, eight from lower limb reflexes, and five from sensory examination distally at the toes. The total score is a continuous variable ranging from a minimum of 0 (no neuropathy) to a maximum of 19 points.
Total scores range from normal=0 to a maximum of 19.
Assays
Serum lipids (triglycerides, total cholesterol, and high-density lipoprotein cholesterol) were determined by an automatic colorimetric method (Hitachi, Boehringer Mannheim, Mannheim, Germany). Low-density lipoprotein cholesterol was calculated by difference (the Friedewald formula). Specific insulin was measured using the Elecsys 1010 immunoassay analyzer (Roche Diagnostics, Basel, Switzerland) and electrochemiluminescence immunoassay. Blood glucose levels were determined by the glucose oxidase method (Sclavo, Siena, Italy). Serum uric acid was determined by an autoanalyzer using the phosphotungstate method (normal range <360 mol/L for women and <420 mol/L for men). Measurements of γ-glutamyltranferase (GGT), alanine aminotransferase (ALT), and aspartate aminotransferase (AST) used a rate assay (Roche Modular p800, Roche Diagnostics, Tokyo, Japan) (normal range: GGT, 11–50 IU/L; ALT, 0–40 IU/L; AST, 0–40 IU/L). Homeostasis model assessment for insulin resistance (HOMA-IR) was used to estimate insulin resistance according to the calculation (fasting plasma insulin [in μU/mL]×fasting plasma glucose [in mmol/L])/22.5. Homeostasis model assessment for β cells (HOMA-β) was calculated as follows: (20×fasting insulin [in μU/mL])/(fasting glucose [in mmol/L] −3.5). 5 Fasting plasma glucose values of <3.5 mmol/L were excluded to avoid negative results. Because of abnormal distribution, log-transformed values of HOMA-β and HOMA-IR were calculated.
Inclusion criteria
Total diabetes included both previously diagnosed diabetes and previously undiagnosed diabetes. Type 2 diabetes was diagnosed according to the World Health Organization criteria
6
: 1. Diabetes mellitus (DM): fasting plasma glucose ≥7 mmol/L (126 mg/dL) and/or 2-h plasma glucose after an oral glucose tolerance test result of ≥11.1 mmol/L (200 mg/dL) and those who had previously diagnosed diabetes. 2. Isolated impaired fasting glucose (IFG): 6.1 mmol/L (110 mg/dL) ≤fasting plasma glucose <7 mmol/L (126 mg/dL) and 2-h plasma glucose <7.8 mmol/L (140 mg/dL). 3. Isolated impaired glucose tolerance (IGT): 7.8 mmol/L (140 mg/dL) ≤2-h plasma glucose <11.1 mmol/L (200 mg/dL) and fasting plasma glucose <7 mmol/L (126 mg/dL). 4. Combined IFG/IGT: 6.1 mmol/L (110 mg/dL)≤fasting plasma glucose <7 mmol/L and 7.8 mmol/L (140 mg/dL) ≤2-h plasma glucose <11.1 mmol/L (200 mg/dL). 5. Impaired glucose regulation (IGR): criteria 2, 3, and 4. 6. Normal glucose tolerance (NGT): fasting plasma glucose <5.5 mmol/L (100 mg/dL) and 2-h plasma glucose <7.8 mmol/L (140 mg/dL).
Diagnosis of hypertension was based on the Seventh Joint National Commission recommendation of systolic blood pressure ≥140 mm Hg and/or diastolic blood pressure ≥90 mm Hg or having been diagnosed with hypertension or taking antihypertension treatment.
The TCSS contains system scores (foot pain, numbness, tingling, weakness, ataxia, and upper limb systems, graded as present=1 and absent=0), reflex scores (knee reflexes and ankle reflexes, graded as absent=2, reduced=1, and normal=0), and sensory test scores (pinprick, temperature, light touch, vibration, and position, graded as abnormal=1 and normal=0). Total scores ranged from normal=0 to a maximum of 19.
The estimated glomerular filtration rate (eGFR) was calculated by the formula of Cockcroft and Gault
7
:
where k was 0.85 for women. The eGFR was adjusted for body surface area (BSA), and BSA was calculated using the formula of DuBois and DuBois
8
:
We defined an abnormal glomerular filtration rate as eGFR<60 mL/min/1.73 m2. 9,10
Statistical analysis
EpiData software (The EpiData Association, Odense, Denmark) was used to establish the database, and the statistical program SPSS version 17.0 (SPSS, Inc., Chicago, IL) was used for statistical analysis. Results are presented as mean±SD values for normal distribution and as median (95% confidence interval) for plasma glucose, insulin, and triacylglycerol, because of their non-normal distribution. Student's t test and nonparametric tests were used to compare groups for continuous variables. The χ 2 test was used to compare the prevalence of diabetes between She and Han Chinese peoples. One-way analysis of variance was used to compare mean values among categories.
Age- and sex-standardized estimates of prevalence of DM and IGR were calculated by the direct method using data from the China Population Census for the year 2000. Multiple logistic regression analysis was performed to examine the association of diabetes and prediabetes with plasma glucose and with demographic, lifestyle, and metabolic factors. With the use of stepwise regression, only variables with P<0.05 entered into the final model. An odds ratio above 1 is regarded as a risk factor, whereas a value below 1 was a protective factor. Based on our investigation, presence of major Minnesota codes findings, baPWV above 1,800 cm/s, 11 and eGFR below 60 mL/min/1.73 m2 were regarded as cardiovascular risks. All P values of <0.05 (two-tailed) were considered to be significant.
Results
Baseline characteristics
The demographic and biological characteristics of the participants are presented in Table 2. As shown, more young women entered into the study, but more men were smokers, alcohol users, and more educated (P<0.001), and men were more likely to have a family history of DM (P<0.05). Men also had higher waist circumference and body mass index and were more likely to have hypertension and hyperlipidemia (P<0.001). Women had higher levels of plasma glucose (P<0.05) and plasma insulin (P<0.001).
Numerical variables are presented as mean±SD values for normal distribution and median (95% confidence inerval) for non-normal distribution.
The body mass index (BMI) is the weight in kilograms divided by the square of the height in meters.
Smokers are those who are having or had at least five cigarettes per day.
Alcohol use is regarded as the average consumption of at least 35 g of alcohol/day.
Physical activity was self-reported, defined as doing physical exercise (such as walking, dancing, jogging, baskeball, football, volleyball, skating, riding, and swimming) at least once per week.
Family history of diabetes was considered to exist if there was at least one first-degree relative with diabetes.
2-h PG, 2-h plasma glucose; DBP, diastolic blood pressure; FINS, 0 min insulin; FPG, fasting plasma glucose; HDL-C, high-density lipoprotein cholesterol; LDL-C, low-density lipoprotein cholesterol; NS, not significant; PINS, 2-h insulin; SBP, systolic blood pressure; TC, total cholesterol; TG, triglycerides; WC, waist circumference.
Prevalence and risk factors
In this investigation, approximately 90.5% of subjects with diabetes were undiagnosed in the She population. The age- and sex-standardized prevalence of diabetes was 6.1% (6.7% for men and 5.7% for women) in She Chinese people, much lower than that among Han Chinese people (P<0.001). The prevalence increased with increase in age for both men and women but decreased after 65 years of age for men (Fig. 1). The age-standardized prevalence of diabetes was higher in men than in women (6.7% vs. 5.7%, P<0.05). The category of 60–70 years of age had the highest prevalence of diabetes (20.6%) for men, whereas 70–80 years was highest for women (16.9%). The age-standardized prevalence of prediabetes was 20.6% in She nationals. More women suffered from prediabetes than men (22.7% vs. 17.7%, P<0.05). The prevalence increased slightly after the age of 55 years for both men and women. The category of 70–80 years had the highest prevalence of diabetes for men, whereas 60–70 years had the highest prevalence for women.

Crude prevalence among the She people of diabetes and prediabetes, for men and for women separately. DM, diabetes mellitus; IFG, impaired fasting glucose; IGT, impaired glucose tolerance.
Figure 2 shows the crude prevalence of diabetes and prediabetes, for men and for women separately.
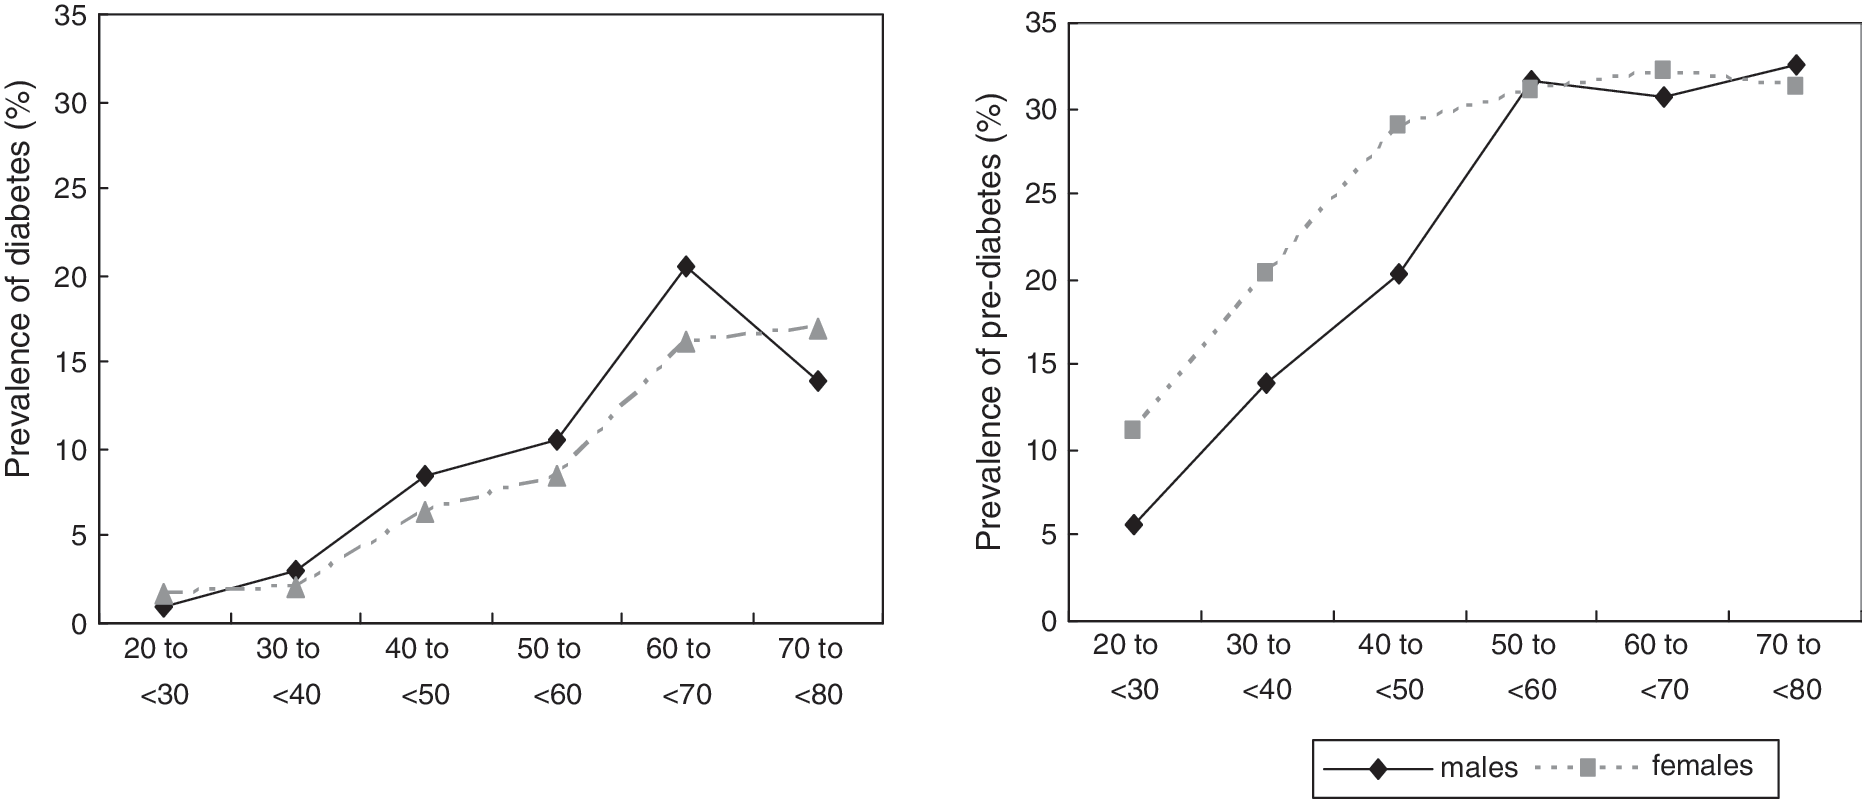
Crude prevalence of total diabetes and prediabetes in the She people.
By logistic regression models, age, family history of diabetes, alcohol use, triglycerides, and total cholesterol were all significantly independent risk factors of diabetes (all P<0.05) (Table 3). Among them, family history of diabetes was the strongest risk factor (odds ratio 2.923, P<0.05), followed by alcohol use (odds ratio 1.746, P<0.001). In addition, age, sex, uric acid level, and education were significantly independent risk factors of prediabetes (P<0.001), among which the significant risk factor was sex (odds ratio 1.610, P<0.001).
Odds ratios were calculated with the use of multiple logistic regressions. Adjusted covariables included age, body mass index, sex, family history of diabetes, alcohol use, smoking, physical exercise, levels of education, serum uric acid, total cholesterol (TC), triglycerides (TG), high-density lipoprotein, and low-density lipoprotein. Categorical variables included smoking (0=nonsmoker, 1=current or previous smoker), family history of diabetes (0=no, 1=yes), alcohol user (0=no, 1=yes), physical exercise (1=yes, 0=no), and educational levels (0=less than high school, 1=high school, 2=college or above), and others were continuous variables.
Metabolic characteristics and complication assessment
In total, the prevalences of vascular risks, liver dysfunction, abnormal TCSS scores, and hyperuricemia were 47.4%, 19.4%, 12.6%, and 6.2%, respectively. Table 4 showed the metabolic characteristics of glucose tolerance. A total of 5,385 participants entered into the study, of whom 62.2% were in absolute NGT. With the decline of glucose tolerance levels, ages increased significantly (P<0.05). Compared with the NGT group, those with IFG had higher baPWV, TCSS scores, and major abnormal Minnesota codes findings (all P<0.05). Those with IGT had higher baPWV and major abnormal Minnesota codes findings and lower AST and eGFR levels, and more subjects had headache and insomnia (all P<0.05). The group with the largest proportion of major abnormal Minnesota codes findings was also distinguished from the NGT group based on baPWV and TCSS scores. In the DM group, more significant differences were found in higher uric acid, GGT, ALT, and AST levels, as well as higher cardiovascular risk, baPWV, and eGFR level and major abnormal Minnesota codes findings. However, no difference was found for epilepsy among the groups.
P<0.05.
baPVW, brachial–ankle pulse wave velocity; DM, diabetes mellitus; eGFR, enhanced glomerular filtration rate; FINS, 0 min insulin; FPG, fasting plasma glucose; HDL-C, high-density lipoprotein cholesterol; HOMA-β, homeostasis model assessment for β-cell function; HOMA-IR, homeostasis model assessment for insulin resistance; IFG, impaired fasting glucose; IGT, impaired glucose tolerance; LDL-C, low-density lipoprotein cholesterol; NGT, normal glucose tolerance; NS, not significant; PINS, 2-h insulin; TC, total cholesterol; TCSS, Toronto Clinical Neuropathy Scoring System; TG, triglycerides; WC, waist circumference.
The correlation coefficient for the relationship between uric acid and HOMA-IR was −0.031 (P=0.045). As shown in Figure 3, for women, compared with the first quartile, log-transformed HOMA-IR of the fourth quartile was significant higher (P<0.05), and log-transformed HOMA-β was also higher in the second, third, and fourth quartiles (all P<0.05). However, no such trend was found for men. Cardiovascular risks such as baPWV, eGFR level, and major abnormal Minnesota codes findings increased gradually among the groups. The DM group had the highest level of baPWV and eGFR, whereas the combined IFG and IGT group possessed larger proportions of abnormal Minnesota codes findings.
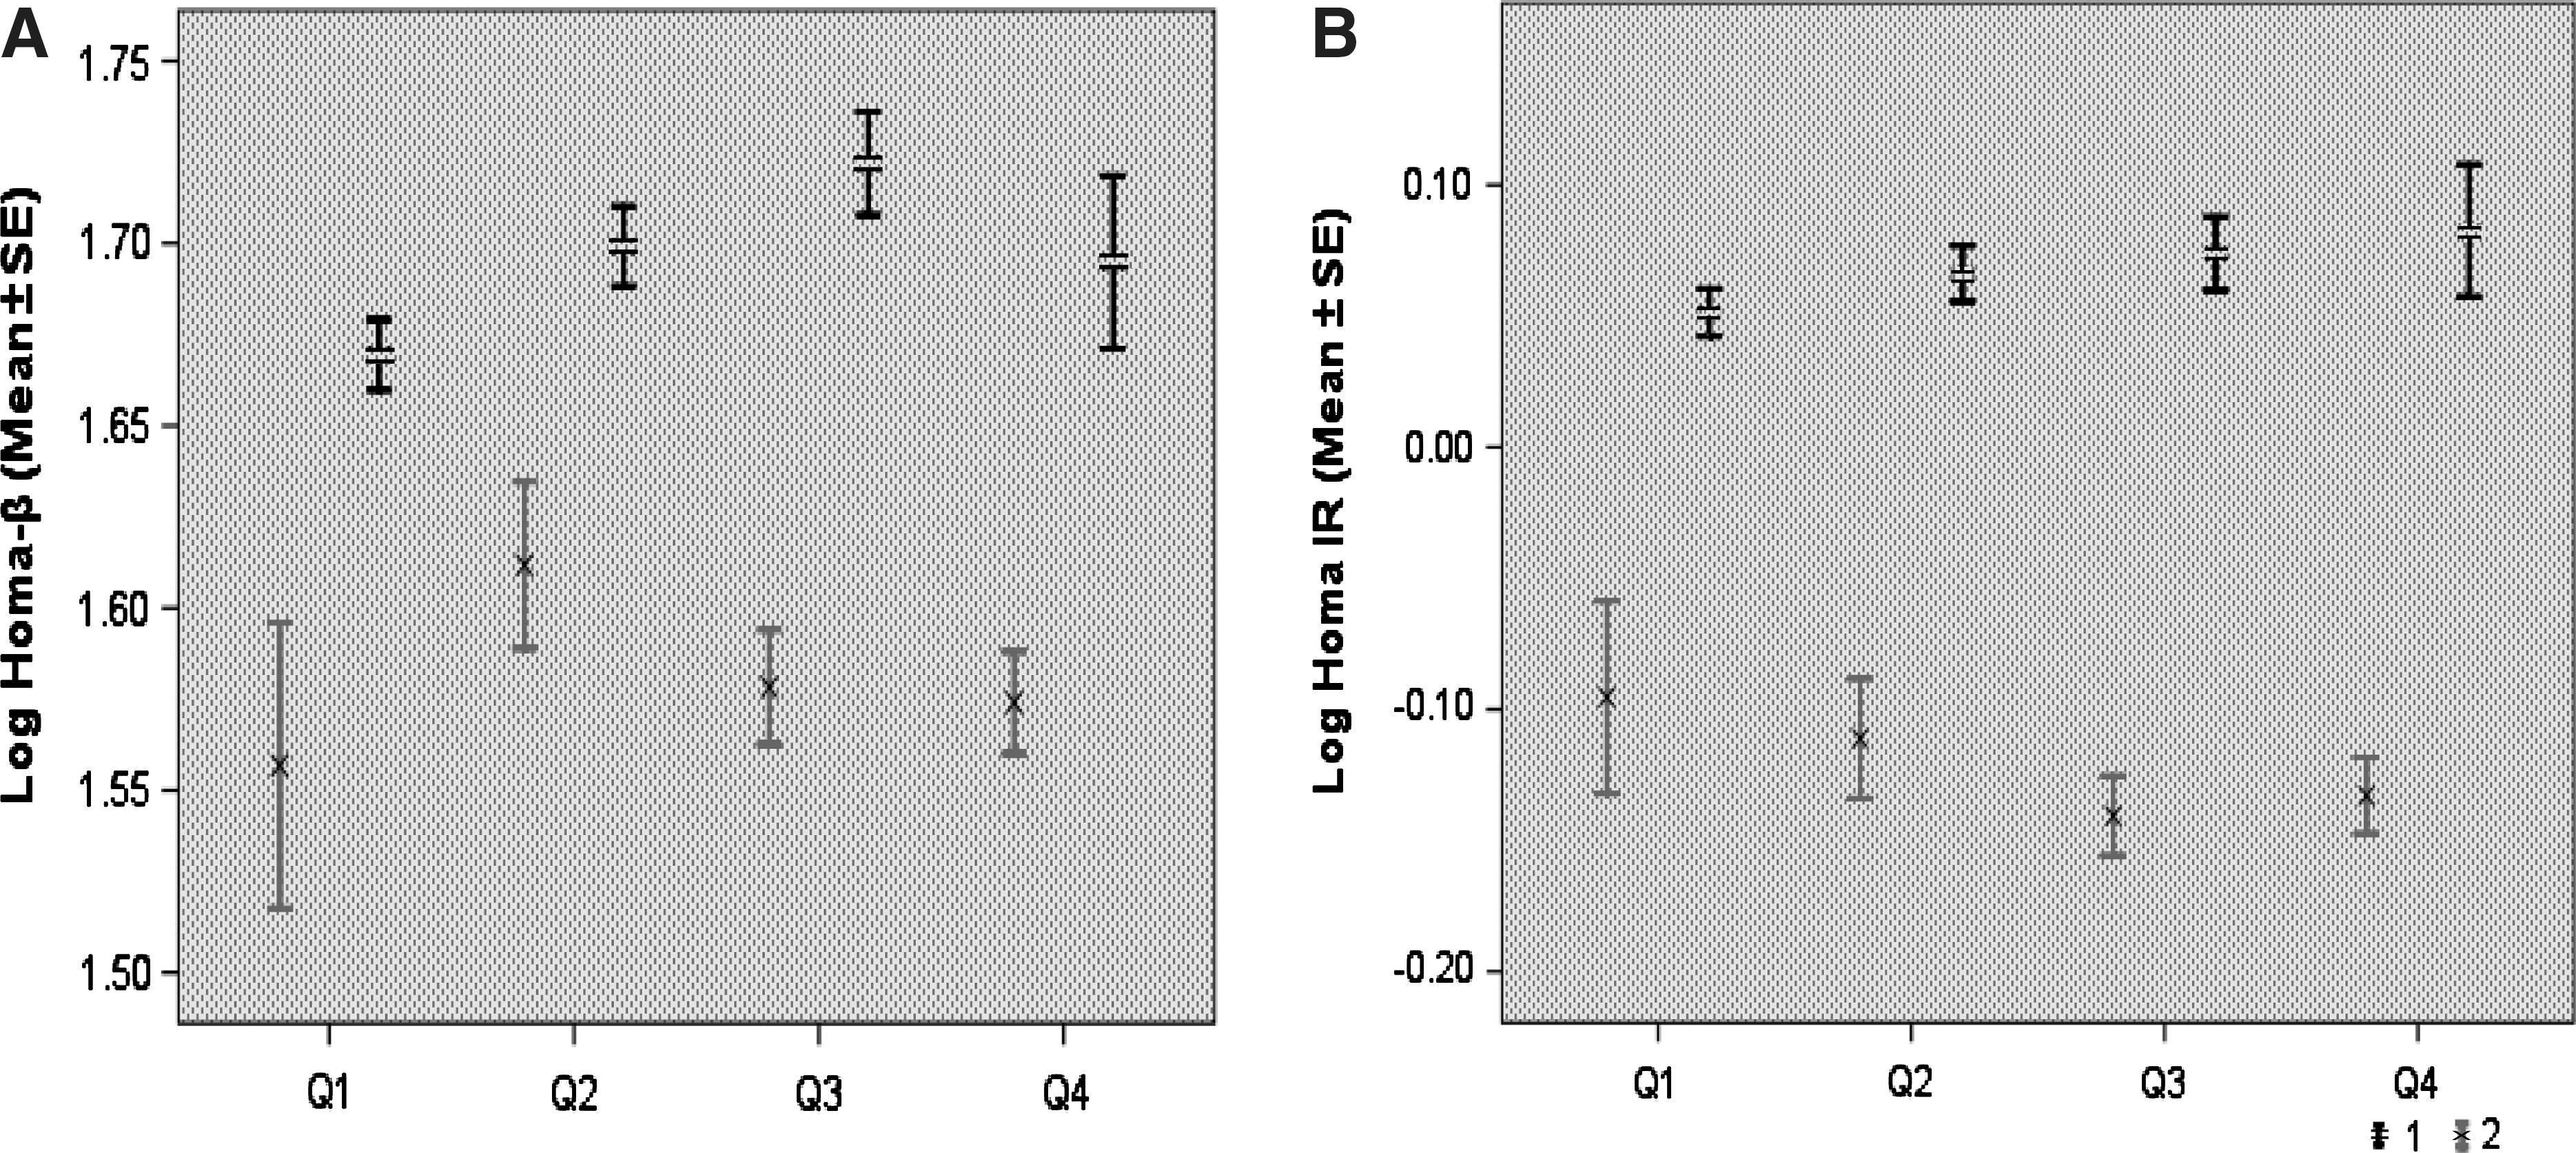
Log-transformed values in the She people of (
TCSS scores
TCSS scores in the IFG, IGT, IFG/IGT, and DM groups were higher than that in the NGT group (Table 3). The prevalences of polyneuropathy in the IFG, IGT, IFG/IGT, and DM groups were 16.1%, 13.1%, 18.6%, and 28.4% separately, which was higher than that in the NGT group. The prevalences of polyneuropathy in the IFG/IGT and DM groups were higher than that in the IGT group (Table 5).
P<0.001 compared with normal glucose tolerance (NGT).
P<0.001, c P<0.05 compared with impaired glucose tolerance (IGT).
DM, diabetes mellitus; IFG, impaired fasting glucose.
Discussion
In the present investigation (Fig. 4), after sex and age standardization, the prevalence of diabetes was 6.1% (6.7% for men, 5.7% for women), and that of prediabetes was 20.6% (17.7% for men, 22.7% for women). According to the recent study based on national sample by Yang et al., 2 9.7% of adults have diabetes, and 15.5% have prediabetes. In 2008, Lin et al. 12 indicated that the standardized prevalence of type 2 diabetes in Fujian Province was 7.19%, and that of prediabetes was 12.35%. This study demonstrated that the standardized prevalence of diabetes in the She people was lower than the national and provincial estimations (6.1% vs. 9.7%; average, 7.19%), whereas the prediabetes prevalence was higher (20.6% vs. 15.5%; average, 12.35%). Most of the She Chinese people live around mountains with a lifestyle similar to those of other residents in Chinese rural areas. The low health consciousness was the reason why undiagnosed diabetes was so high (90.5%). In addition, the standardized prevalence of diabetes in rural areas was 8.9% for men and 7.7% for women in the report of Yang et al., 2 which is still higher than those for the She people. In the report of Lin et al. 12 , the standardized prevalence of diabetes was 6.67% for men in rural areas, which was close to that among She men. The prevalence of diabetes in women was 10.86%, slightly higher than that among the She people. According to our data, whether in men or women, more than half of the subjects participated in physical exercises (71.6% for men and 72% for women), leading to low-risk profiles for diabetes. The prevalence of prediabetes was higher than in other previous reports, indicating slower development of diabetes, and attention must be paid to this population. Most of the She people do farm work in daily life, and their homes are far away from urban areas. Such a remote location results in much simpler living habits. We consider that lifestyle and habits may account for the low prevalence of diabetes in the She people, and another explanation of the differences may be the result of genetics. The prevalences of diabetes and prediabetes increased with deterioration of β-cell function. Total cholesterol and triglycerides, as components of metabolic syndrome, were also risk factors of diabetes. Based on the study, the prevalence of prediabetes was higher for men, which was ascribed to greater age, higher blood pressure, higher amounts of alcohol use, and family history of diabetes.
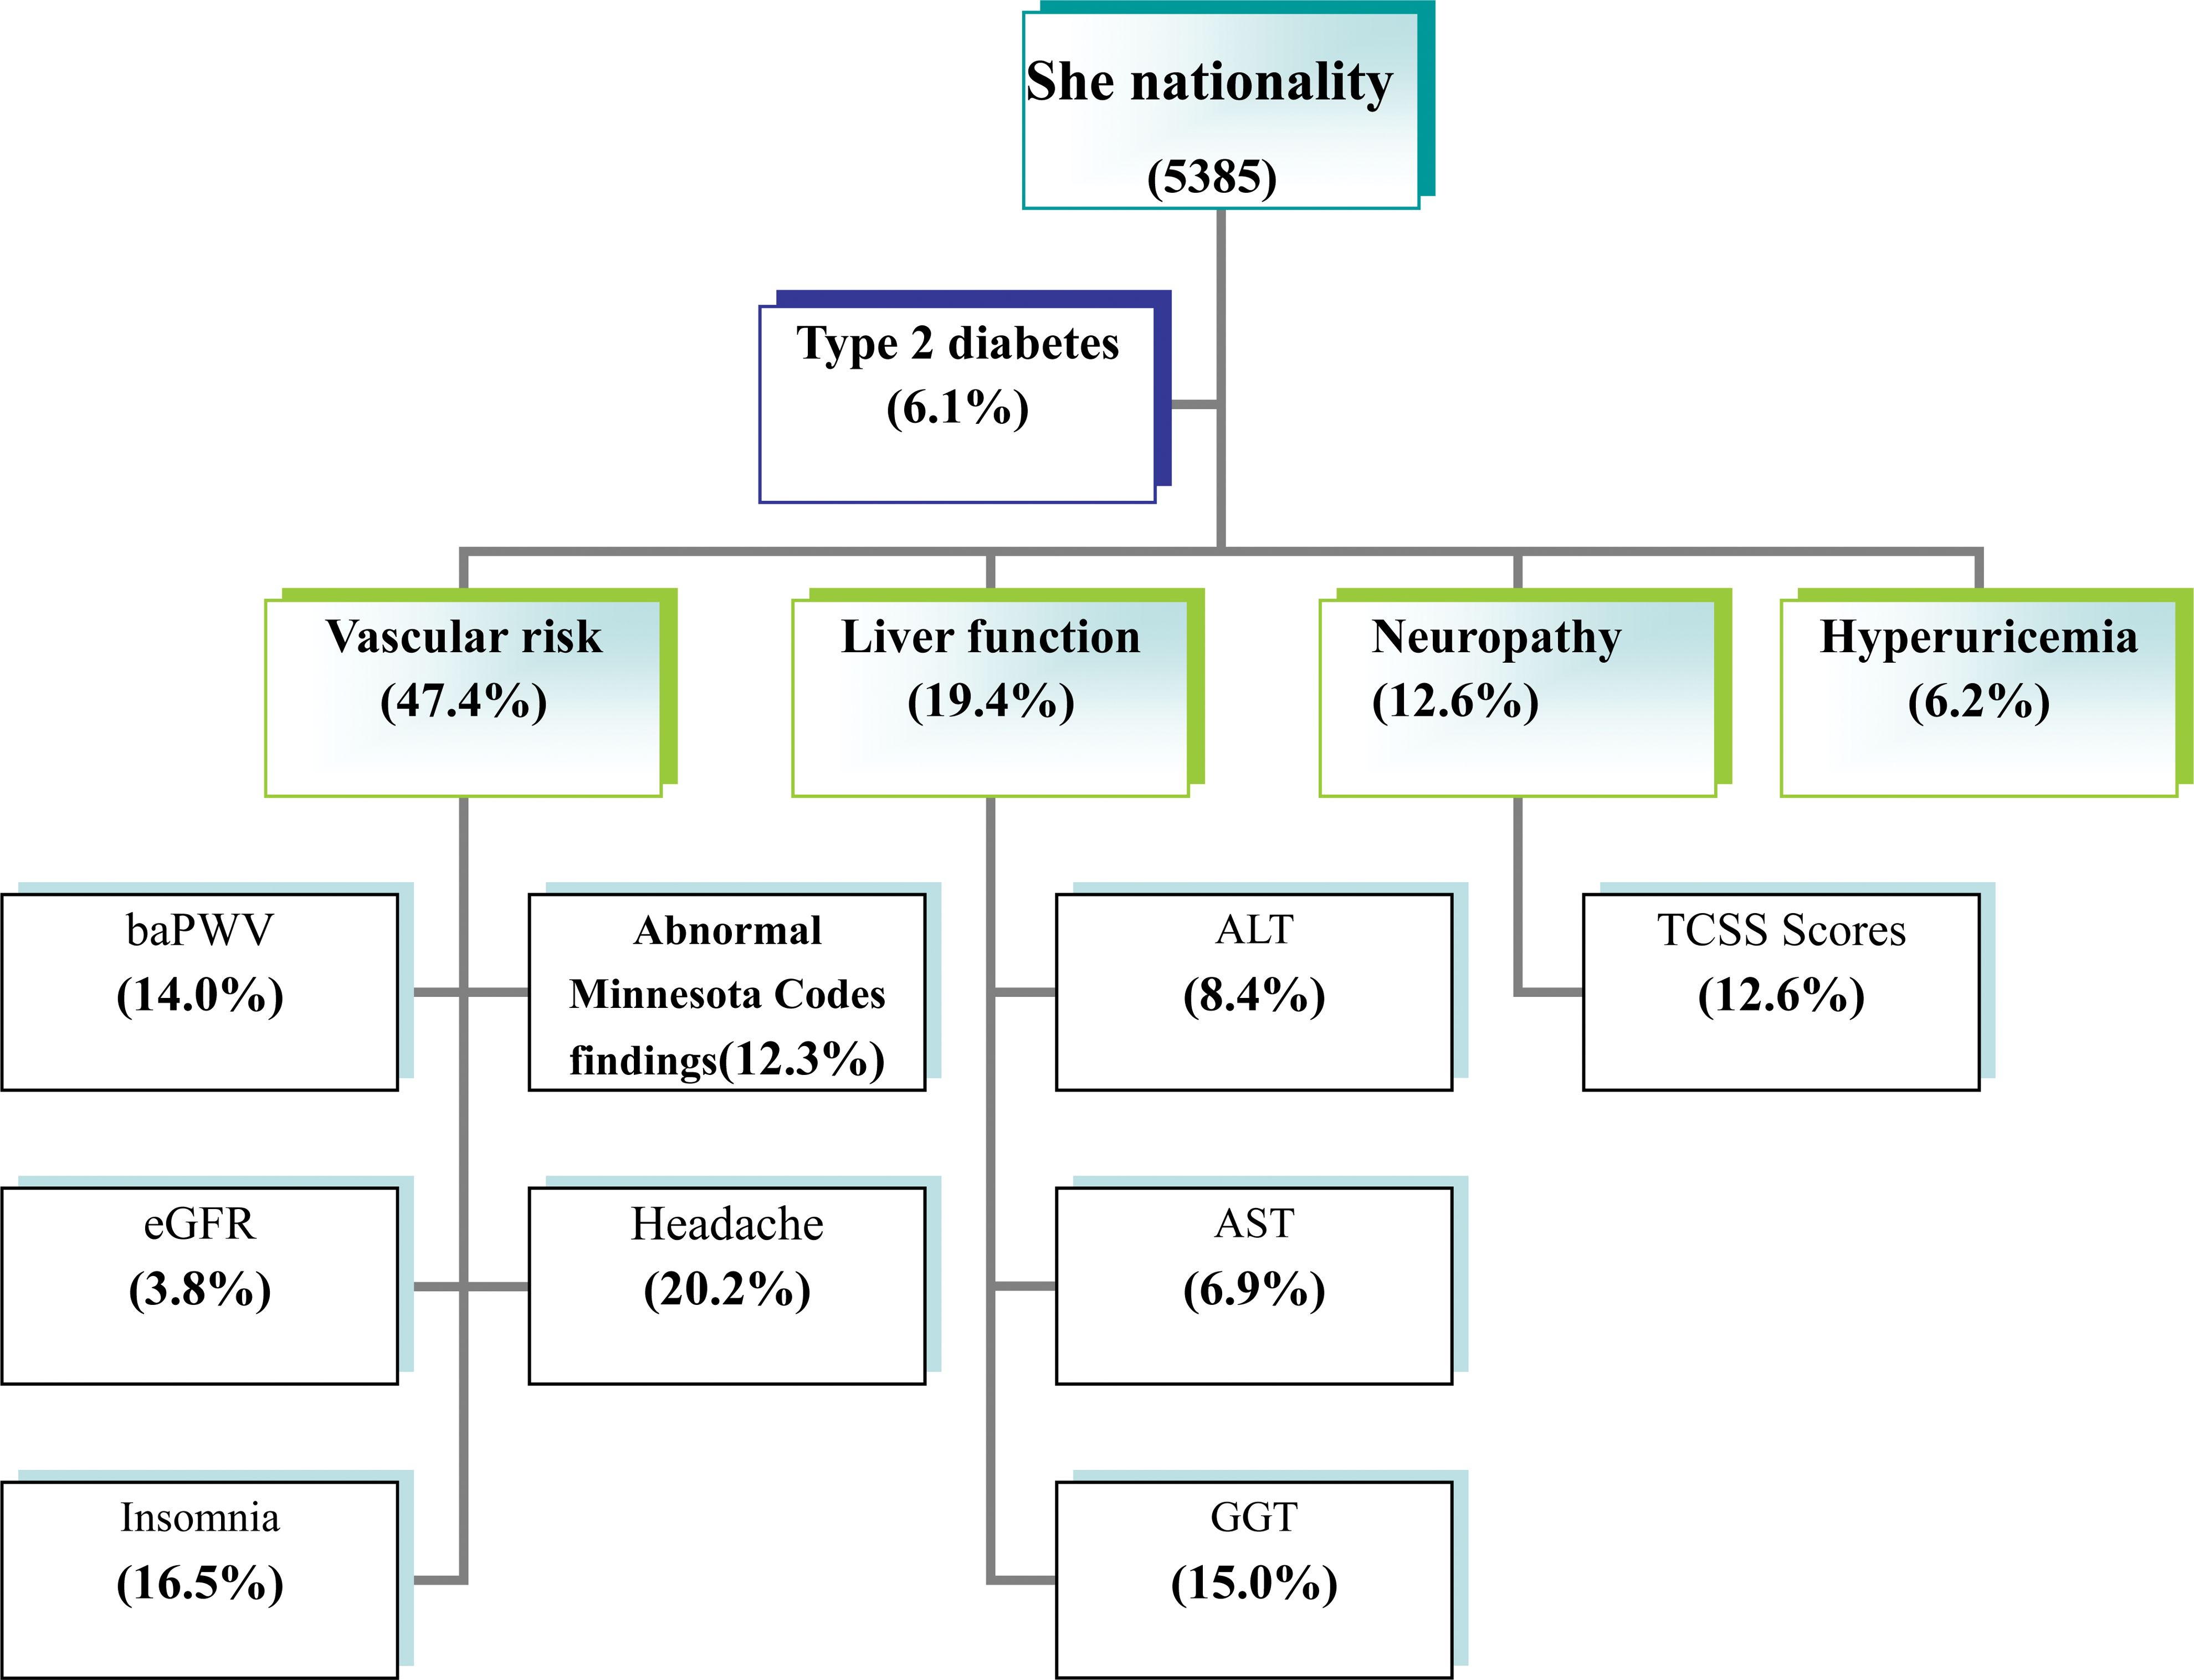
Prevalences of diabetes and various associated diseases in the She people. ALT, alanine aminotransferase; AST, aspartate aminotransferase; baPWV, brachial–ankle pulse wave velocity; eGFR, enhanced glomerular filtration rate; GGT, γ-glutamyltransferase; TCSS, Toronto Clinical Neuropathy Scoring System. Color images available online at
In our study, with the decrease of glucose tolerance levels, a rising trend of serum uric acid was found. Compared with the NGT group, subjects with diabetes had higher uric acid levels, as well as IGT. β-Cell function (HOMA-β) in the first quartile was significantly different from that in the fourth quartile (P<0.05), as well as insulin resistance (HOMA-IR). HOMA-β was elevated in IFG, corresponding to the proposition that hyperuricemia often precedes the development of diabetes. 13 –15 HOMA-IR began to increase in the fourth quartile, which demonstrated decompensated elevation of β-cell secretion emerging in IFG. Previous studies by Taniguchi et al. 16 indicated that uric acid was not significantly associated with diabetes. The relationship between uric acid and diabetes is still controversial, resulting from the opposite opinions proposed from studies conducted by Chien et al. 15 and Dehghan et al. 17 However, uric acid was not a significant risk factor for type 2 diabetes in our study. Therefore, although serum uric acid in DM was higher than in NGT, some other risk factors may play more important roles in the development of diabetes.
Based on our data, the prevalences of liver dysfunction, headache, and insomnia were 19.4%, 20.2%, and 16.5%, respectively. Decreased insulin sensitivity, as a cornerstone in the pathogenesis of type 2 diabetes, activates lipolysis, leading to increased plasma levels of nonesterified fatty acids. A resultant chronic increase in fatty acid flux from the fat stores to nonadipose tissues contributes to the hepatic steatosis. 18 GGT, a marker of liver disease and alcohol intake, was significantly elevated in IFG and DM (P<0.05). Some prospective studies have indicated that elevated GGT, even in the normal range, is associated with type 2 diabetes. 19,20 In addition, abnormal liver function test results were also found in other studies among populations with diabetes. 21,22 We suggest that liver function should be assessed regularly for IFG populations to avoid deterioration. Based on our data, the prevalence of headache was higher in abnormal glucose tolerance (IFG, IGT, IFG/IGR, and DM) than in NGT. Among these groups, only IGT showed a significant increase, with P<0.05, indicating that headache appeared to be apparent ahead of type 2 diabetes. Although the relationship between headache and the prevalence of type 2 diabetes is still controversial, 23,24 previous studies have reported the prevalence of headache is increased among populations with diabetes. 25 DM affects vascular reactivity, inducing diabetic neuropathy and lifestyle changes, and all of those may be relevant in headache pathopysiology. The same trend was also found for insomnia; reduced sleep duration and quality appear to be endemic in modern society, as well as in the She nationality. The mechanisms by which insomnia impacts glucose tolerance is thought to be multifactorial, including decreased brain glucose utilization, alterations in the sympathovagal balance, increased evening cortisol and extended nighttime growth hormone secretion, and pro-inflammatory processes. 26 The relationship between headache and diabetes and the relationship between insomnia and diabetes need further study.
The worst complications of type 2 diabetes were its vascular complications, including microvascular and macrovascular diseases. In total, 47.4% of subjects appeared abnormal. Our results showed that baPWV, eGFR, and abnormal Minnesota codes had changed in IFG (all P<0.05). A decreased eGFR indicated microvascular diseases began in IGT, prior to the onset of diabetes. Elevated baPWV and an increased number of abnormal Minnesota codes findings in IFG indicated the beginning of macrovascular complication. In a study by Ford et al., 27 the estimated odds ratio for cardiovascular disease associated with IGT might range from 0.97 to 1.30, and that associated with IFG ranged from approximately 1.12 to 1.37. Many DM risk factors, such as age and low high-density lipoprotein cholesterol, are also risk factors for cardiovascular disease.
Another important and irreversible long-term complication of type 2 diabetes is diabetic polyneuropathy, and early detection become necessary. In the present study, peripheral neuropathy is a specific form of axonal neuropathy associated with diabetes and is defined clinically by progressive disease that first includes distal and symmetrical peripheral neuropathy of sensory nerve fibers, with eventual autonomic and motor involvement. 28 With polyol flux, accumulation of advanced glycation end products, oxidative stress, and other metabolic abnormalities, diabetic polyneuropathy occurred as early as in the IGR population (including IFG, IGT, and IFG/IGT). Singleton et al. 29 and Tesfaye et al. 30 found that IFG or IGT was more common in chronic idiopathic axonal polyneuropathy. Thus, we suggest that early peripheral neuropathy screening should be performed in the IFG and IGT populations. The prevalence of polyneuropathy in IFG, IGT, IFG/IGT, and DM was higher than that in NGT, and the prevalence of polyneuropathy in IFG/IGT and DM was higher than that in IGT, which suggested intervention should be taken in the IGR population to prevent the development of polyneuropathy.
The prevalence of polyneuropathy in DM was 28.4%. In a population-based study, 31 22% of the diabetes cohort had peripheral neuropathy, which was lower than in our study. The neuropathies associated with diabetes represent insidious and progressive processes for which the pathological severities are poorly linked with the development of symptoms. This study adds further evidence that poor glucose tolerance is related to the severity of diabetic peripheral sensor motor neuropathy in patients with type 2 diabetes. The delay of diagnosis of diabetes may account for the higher prevalence of peripheral neuropathy. For the She people, newly diagnosed diabetes was significant higher than the average level for China 2 (90% vs. 39.3%, respectively).
However, limitations also existed in our investigation. First, it was a cross-sectional survey and could not determine cause-and-effect relationships. Second, women were oversampled in the present study (57.1%). Most Chinese men worked away from home for their families, leaving women at home, which resulted in more women enrolling in the investigation. Nonetheless, this is the first study of DM in the She people. In addition, because the distribution of She people was disproportionate and most of the She people were from rural areas, sample bias might emerge during extracting of the sample.
In summary, our results showed that a total of 6.1% of the She people suffered from type 2 diabetes, which was lower than the average level in China, but the standardized prevalence of prediabetes was higher, 20.6%. In the context of the higher diabetes burden in China, the She people should also be alert to it. TCSS is convenient to assess diabetic polyneuropathy in clinical practice and should be tested regularly for people in prediabetes. Liver dysfunction, headache, and insomnia, appearing to emerge before type 2 diabetes, should be assessed regularly to avoid deterioration.
Footnotes
Acknowledgments
This work was supported by grants C071002, 2009Y0011, and 2010Y3012 from the Natural Science Foundation of Fujian Province, China.
Author Disclosure Statement
The authors have nothing to declare.