




Abstract
Background:
Recent studies have highlighted the importance of managing postprandial hyperglycemia, but adequate monitoring of postprandial glucose remains difficult because of wide variations in levels. We have therefore developed a minimally invasive system to monitor postprandial glucose area under the curve (AUC). This system involves no blood sampling and uses interstitial fluid glucose (IG) AUC (IG-AUC) as a surrogate marker of postprandial glucose. This study aimed to evaluate the usefulness of this system by comparing data with the findings of oral glucose tolerance tests (OGTTs) in subjects with and without diabetes.
Subjects and Methods:
The glucose AUC monitoring system was validated by OGTTs in 37 subjects with and 10 subjects without diabetes. A plastic microneedle array was stamped on the forearm to extract IG. A hydrogel patch was then placed on the pretreated area to accumulate IG. Glucose and sodium ion concentrations in the hydrogel were measured to calculate IG-AUC at 2-h postload glucose. Plasma glucose (PG) levels were measured every 30 min to calculate reference PG-AUC.
Results:
IG-AUC correlated strongly with reference PG-AUC (r=0.93) over a wide range. The level of correlation between IG-AUC and maximum PG level was also high (r=0.86). The painless nature of the technique was confirmed by the response of patients to questionnaires.
Conclusions:
The glucose AUC monitoring system using IG provided good estimates of reference PG-AUC and maximum PG level during OGTTs in subjects with and without diabetes. This system provides easy-to-use monitoring of glucose AUC, which is a good indicator of postprandial glucose.
Introduction
The guidelines of the International Diabetes Federation and the American Diabetes Association 7 also recommend that self-monitoring of blood glucose (SMBG) should be considered because it is currently the most practical method for monitoring postprandial glucose levels. 5 However, accurate estimation of postprandial hyperglycemia with SMBG is difficult because glucose levels vary widely with time, and frequent measurements by SMBG cause pain and inconvenience and are therefore not useful for daily management. The recently developed continuous glucose monitoring technology also provides useful information. 11 However, these systems involve some burden and inconvenience to patients that cannot be neglected.
We have been working on a novel system to estimate postprandial glucose excursions without blood sampling. 12 Using this system, postprandial glucose excursion is estimated as a glucose area under the curve (AUC) value that corresponds to the total increase in glucose levels after a meal, without considering timing of blood sampling. With this technology, the glucose AUC value after a glucose load can be analyzed by placing a hydrogel patch on pretreated skin for a predefined period.
The measurement steps include the following: (1) A plastic microneedle array is stamped on the forearm skin to enhance the interstitial fluid (ISF) extraction rate. (2) A hydrogel patch placed on the pretreated area to accumulate ISF. The glucose extraction rate by the patch from ISF is proportional to the ISF glucose (IG) level in the skin. The reservoir therefore contains glucose proportional to the glucose AUC for the period tested. (3) At the same time, the concentration of accumulated sodium ions is measured for use as an internal standard rather than using calibration by blood sampling. This system allows easy-to-use monitoring of glucose AUC that acts as a surrogate index of postprandial hyperglycemia.
A study to confirm the concept of our technology was conducted and reported by Sato et al. 12 This study in healthy subjects showed that IG-AUC correlated strongly with glucose AUC determined by SMBG after a meal. However, glucose levels varied comparatively slowly within a relatively narrow range of AUC in this study. As a next step, the present study evaluated the usefulness of the measurement system by performing OGTTs in subjects with and without diabetes to compare IG-AUC with reference PG-AUC over a wide range of AUC during rapid glucose change.
Research Design and Methods
Clinical evaluation protocol
The correlation between AUCs measured by our system or calculated by PG levels determined by performing OGTTs in 37 inpatients with diabetes and 10 subjects without diabetes (20–70 years old). The patients with diabetes had already received an oral hypoglycemic agent or insulin treatment, with the OGTTs being performed as part of medical therapy for evaluation of the treatment.
Fasting glucose levels were measured in the morning before glucose consumption using an SMBG device (Medisafe, Terumo, Tokyo, Japan). If the levels were >160 mg/dL, the OGTT was postponed. PG levels were then measured using a conventional clinical laboratory system, which is calibrated routinely.
To extract ISF, the forearm skin was wiped with an antiseptic, and then microneedle arrays were stamped at two sites using a microneedle applicator. After glucose consumption (Trelan-G75, Ajinomoto Pharma, Tokyo), two hydrogel patches were placed on each pretreated area to accumulate ISF. PG levels were also measured every 30 min for 2 h. At the end of this period, the hydrogel patches were removed to analyze the composition of ISF. After ISF extraction, patients were requested to fill out questionnaires to obtain feedback on the system compared with SMBG. All the patients performed SMBG at the hospital.
The ethics committee of Kobe University, Kobe, Japan, approved the protocol. Written informed consent was obtained from all the subjects.
Apparatus and materials
The microneedle arrays were made of polycarbonate and covered approximately 50 mm2, containing 305 needles with a length of 0.3 mm. The applicator for microneedle stamping of the skin was a spring-action, handheld system with a stamping speed of about 6 m/s.
The hydrogel was made of polyvinyl alcohol (Viewgel®, Nichiban, Tokyo). Each hydrogel patch consisted of hydrogel and a plastic cover with an adhesive tape. The hydrogel was cut to the same size as the microneedle pretreatment area and soaked in 150 mM KCl solution overnight to replace the solvent in the gel.
The reagent for glucose analysis consisted of four enzymes and one dye in phosphate buffer solution. Each 0.1 mL of phosphate buffer solution contained 2.6 U of glucose oxidase (Wako Pure Chemical Industries, Osaka, Japan), 0.023 U of mutarotase (Wako Pure Chemical Industries), 0.25 U of peroxidase (Wako Pure Chemical Industries), 0.49 U of ascorbic acid oxidase (Wako Pure Chemical Industries), and 0.016 mL of Amplex® Red solution (Molecular Probes, Eugene, OR).
Procedures for glucose/sodium ion analyses
The hydrogel was separated from the plastic cover prior to analysis of the extract. The hydrogel was then placed in 0.3 mL of pure water overnight to extract glucose and sodium. For glucose measurement, 0.1 mL of a 12-fold diluted sample solution was mixed with 0.1 mL of reagent. After a 60-min incubation, the fluorescent intensity of Amplex Red was measured using a fluorescence plate reader (GENious, Tecan, Kanagawa, Japan). Sodium ion concentrations were analyzed using a DX-500 ion chromatography system (Dionex, Bannockburn, IL).
Data analysis methods
Reference PG-AUCs were calculated by trapezoidal approximation of PG levels measured every 30 min. Defining the PG value at x min as PG(x), the reference PG-AUC was calculated as follows:
IG-AUC was calculated on the basis of the measured mass of glucose M
glu (nmol) and sodium ions M
Na (nmol) in the hydrogel as follows:
where α and β are the calibration constants for glucose and sodium ion permeability through micropores made by the microneedle array, which were 7.12×10⁻⁵ and −4.71×10⁻³, respectively. These values were estimated by the correlation equation between sodium ion and glucose permeability in all the subjects of this study. The details and principles of the data analysis have been described previously. 12
Results
Glucose profiles
Figure 1 shows the PG profiles. OGTT patterns were classified according to the diagnostic criteria for diabetes. 7 The study included 13 NGT, five IGT, and 27 diabetes mellitus (DM) subjects, with mean PG-AUC being 278, 406, and 445 mg·h/dL, respectively (no impaired fasting glucose subjects). Two samples contaminated with sodium ions or stored inappropriately by mishandling before measurement of their contents were excluded from the analysis. The majority of glucose peaks in the NGT and IGT subjects occurred at 60 min, whereas the peaks in the DM subjects showed wide variation between 60 and 120 min.

Plasma glucose (PG) profiles of
Correlation between reference PG-AUC and predicted IG-AUC
Figure 2A shows the correlation between IG-AUC and reference PG-AUC. All data were classified as NGT, IGT, or DM. The correlation coefficient was sufficiently high (r=0.93) over a wide range (227–675 mg·h/dL), with correlation being independent on glucose tolerance classification.
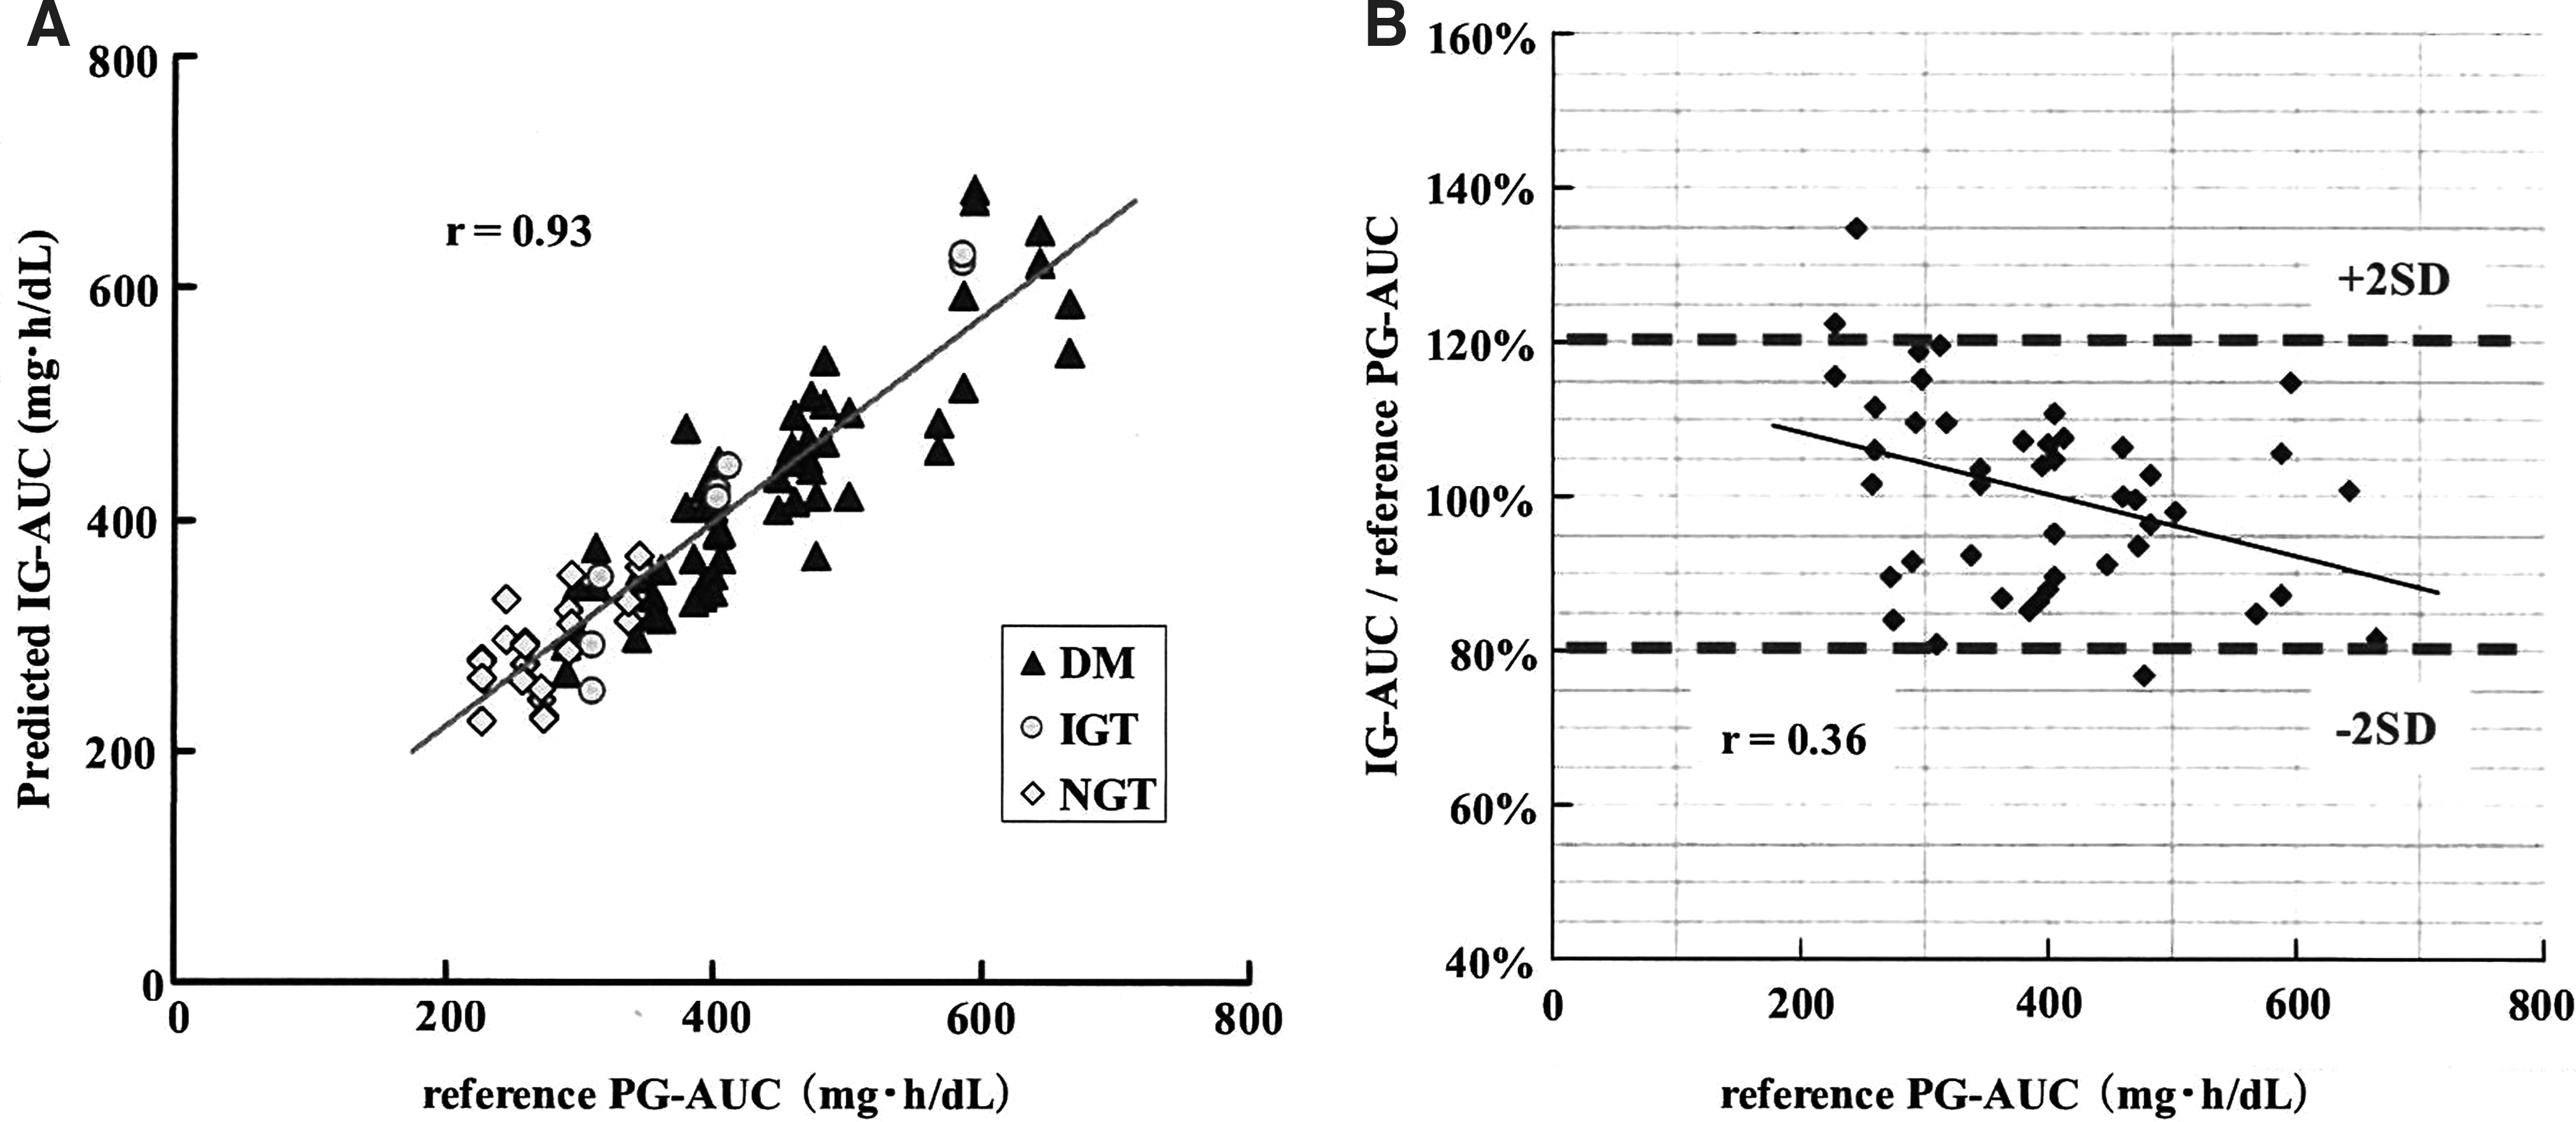
Comparison between interstitial fluid glucose area under the curve (IG-AUC) and plasma glucose area under the curve (PG-AUC).
A Bland–Altman plot showed that the majority of data were within 20% of the reference PG-AUC (Fig. 2B). The degree of error was not clearly dependent of the reference PG-AUC. The reproducibility of two simultaneous IG-AUC measurements was 5.0% (coefficient of variance), and the mean percentage error from the regression line was 11.6%.
Correlation between peak PG and predicted IG-AUC
Figure 3A shows the correlation between peak PG and IG-AUC (mean of two simultaneous measurements). Peak PG correlated strongly with IG-AUC (r=0.86), suggesting that our system is useful to predict peak PG. This correlation was independent of peak PG level. As a reference, we observed a higher correlation between peak PG and PG-AUC (Fig. 3B). On the other hand, predicting peak PG with one glucose measurement was difficult because peak time varied from 60 to 120 min (Fig. 1).
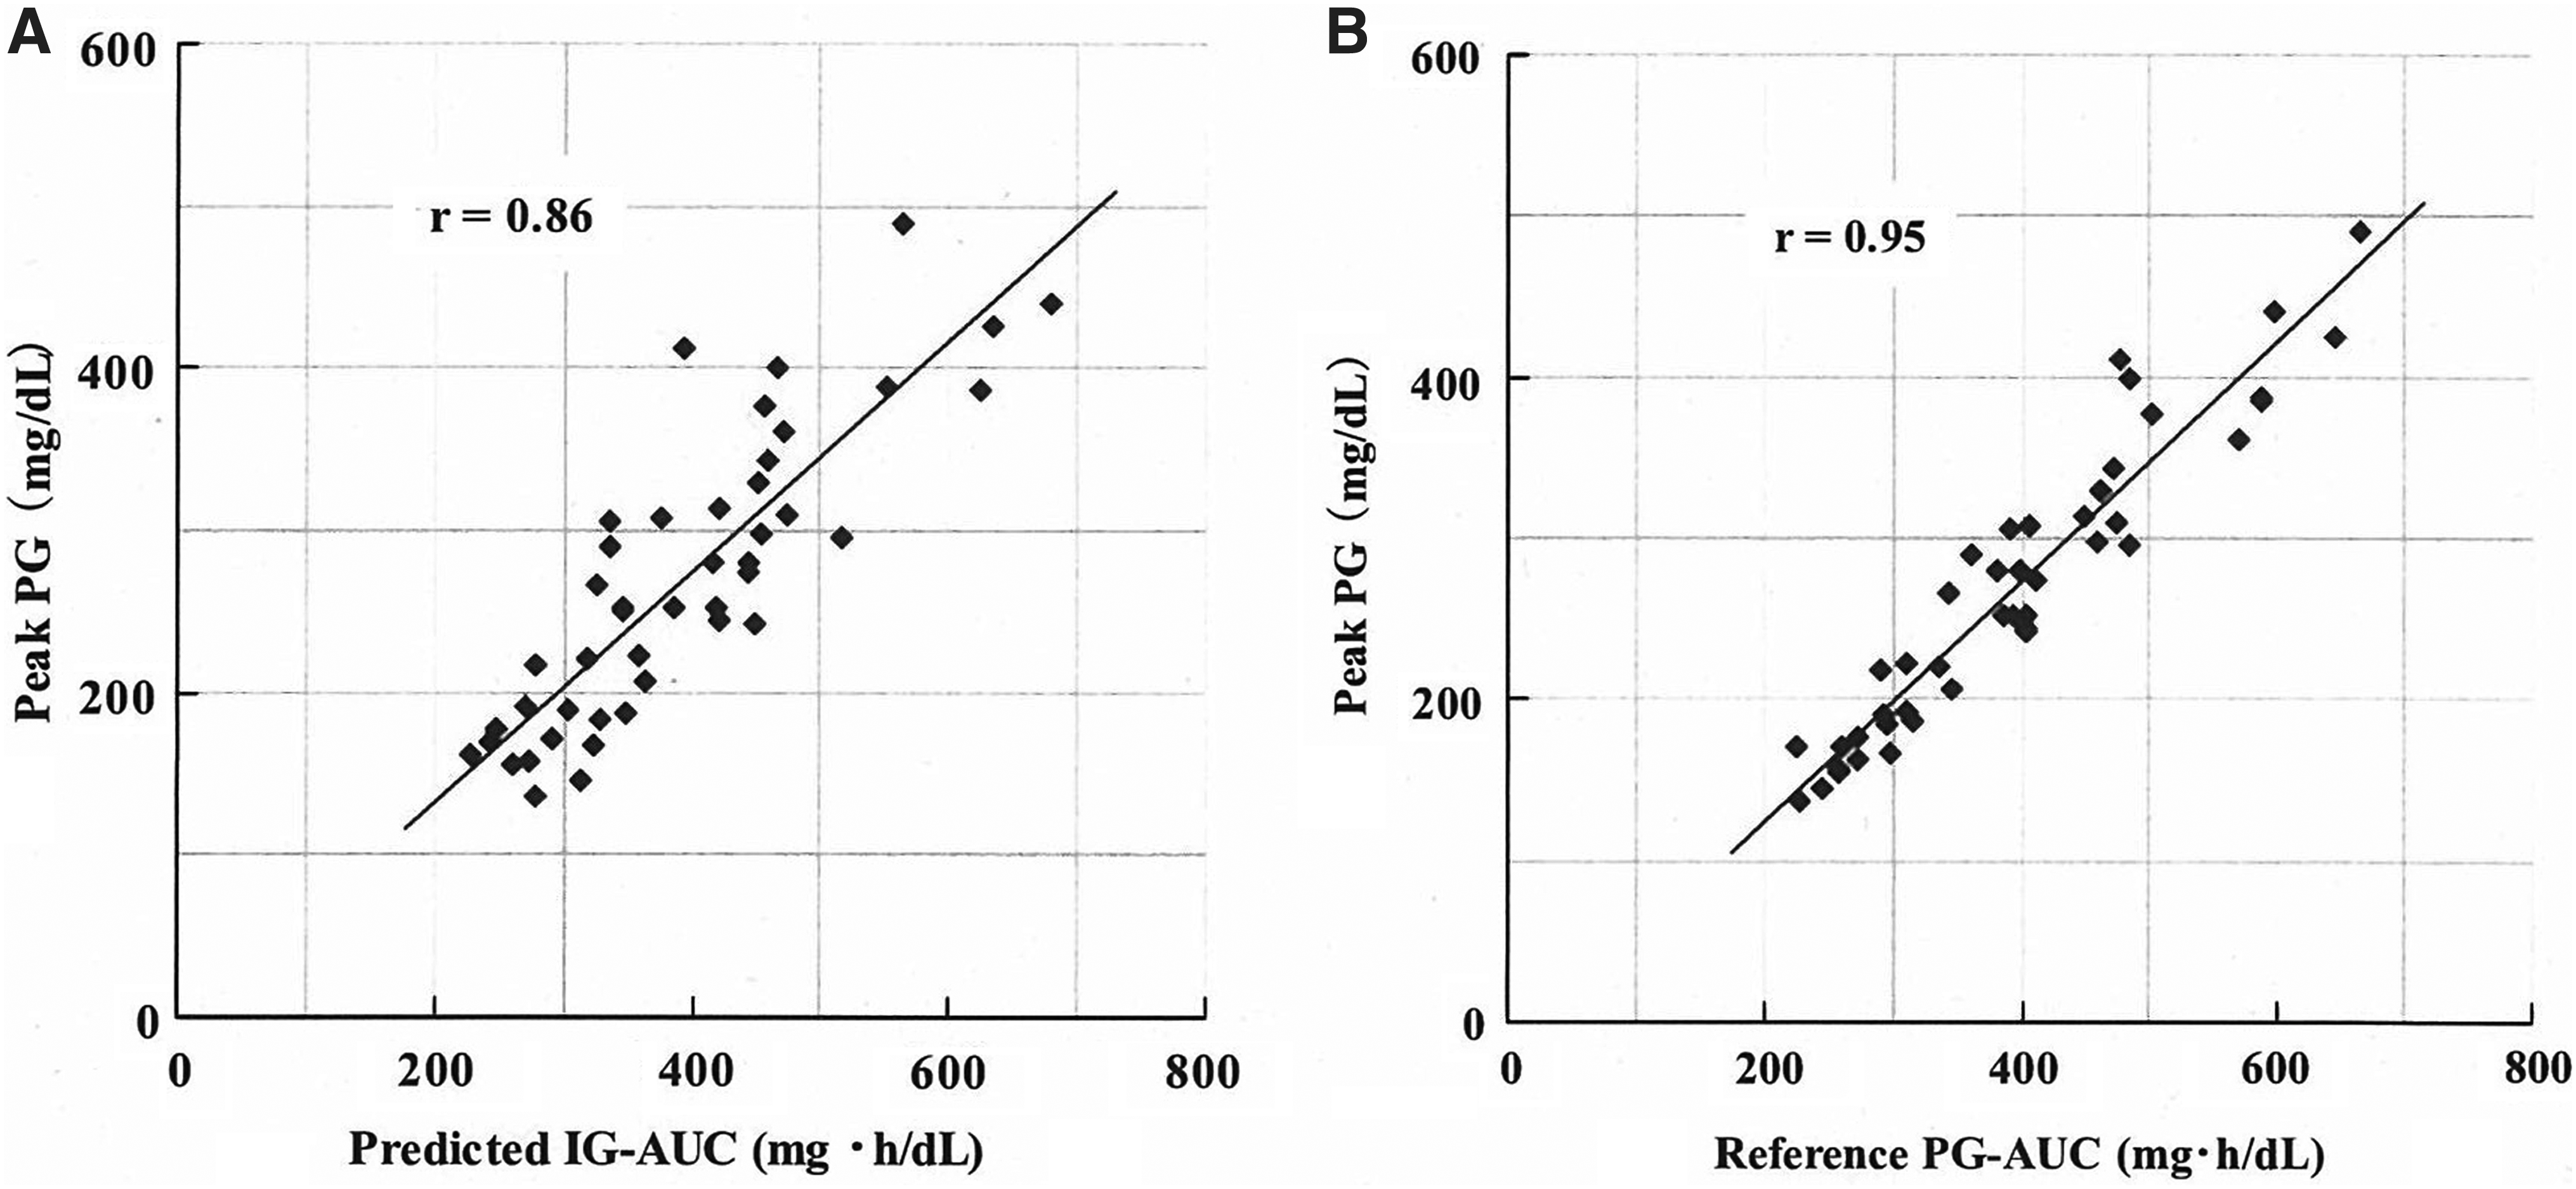
Correlation between peak plasma glucose (PG) and
Skin conditions and results of questionnaires
No bleeding was observed after stamping of the microneedle array or during accumulation of ISF. Slight erythema occurred at the stamped area but disappeared within a few days.
Table 1 shows the results of the patient questionnaires. The majority of patients described neither pain nor discomfort with stamping compared with SMBG.
SMBG, self-monitoring of blood glucose.
Discussion
Physiological difference between IG and PG
In this study, we showed that IG-AUC predicted by our ISF extraction technology correlated strongly with reference PG-AUC calculated from OGTTs in subjects with and without diabetes (Fig. 2). However, there were differences in glucose excursion measured by PG and IG due to the following differences of physiological dynamics of glucose in plasma and ISF. Time-dependent variations in capillary glucose measured by the finger stick method accurately predict variations in PG, whereas capillary glucose measured in the forearm does not predict rapid variations in PG. This is known as the alternate site testing phenomenon. 13,14 Similarly, variations in IG do not predict rapid variations in PG, which is known as an alternate site testing–like phenomenon. This limits the accuracy of monitoring hyperglycemia or hypoglycemia using IG. 15,16 In this study, the average glucose increment rate was 2.2 mg/dL/min from 0 to 30 min. Therefore, the period of variation observed in forearm IG was assumed to be delayed compared with forearm PG.
As shown in Figure 4A, there was a weak correlation between peak time and error level of AUC prediction, with the later peak time having larger errors. Based on the physiological differences in dynamics of glucose excursion described, this weak relationship can be explained by the models shown in Figure 4B and C. Figure 4B depicts a glucose excursion model in plasma and ISF with a peak time of around 60 min. PG-AUC and IG-AUC are the areas under the PG and IG curves, respectively. In this model, compared with reference PG-AUC, IG-AUC would be expected to be smaller from 0 to peak time (stippled area) and larger from peak time to 120 min (meshed area). In total, IG-AUC may be similar to reference PG-AUC as the areas associated with delay are canceled out. On the other hand, Figure 4C describes a model with a peak time of around 120 min, where IG-AUC may be smaller than reference PG-AUC (stippled area) because of the absence of cancellation for the difference between PG-AUC and IG-AUC. Although errors in AUC prediction were observed, these errors were minimal when monitoring postprandial hyperglycemia because the increases and decreases in glucose levels caused by food ingestion were considerably smaller than those caused by the glucose solution in the OGTT.

Plot of the variation in accuracy of the area under the curve measurement and dependency on peak time in the oral glucose tolerance test.
Clinical usefulness of AUC measurement
To our knowledge, there is no epidemiological evidence on the clinical usefulness of the glucose AUC value. Despite this situation, glucose AUC has been used frequently in dietary therapy as an index of postprandial glucose excursion. For example, the glycemic index, which is an index of increases in glucose levels caused by specific foods, is calculated using glucose AUCs measured after consumption of both specific and standard foods. 17,18 In addition to conventional indexes, the efficacy of medicines for postprandial hyperglycemia, such as α-GI or nateglinide, has tended to be monitored by changes in postprandial glucose AUC. 19,20 This trend is also apparent in the evaluation of recently developed medicines, such as incretin-related and sodium–glucose cotransporter type 2 medicines that act by suppressing increases in postprandial glucose level. 21,22
Currently, glucose AUC is not used widely as an index of hyperglycemia as no appropriate method exists for monitoring glucose AUC except for frequent blood sampling or continuous glucose monitoring. Therefore, convenient monitoring of glucose AUC by the system used in the present study would allow glucose AUC to be used as an effective index of postprandial glucose excursion.
For example, hemoglobin A1c is used routinely for diabetes screening and management, but it is not suitable for detecting early-stage diabetes, IGT, or short-term changes in glycemic control during and after alternations in therapeutic approaches. 23,24 Our easy-to-use system without blood sampling would be suitable for screening IGT patients with low hemoglobin A1c levels. Glucose AUC would also be useful for determining the efficacy of administered medicines. Unlike the slow response of hemoglobin A1c, glucose AUC directly reflects glucose excursion and tolerance during testing. Further studies are needed to apply this novel index from our methods to these clinical uses.
As shown in Figure 3, in addition to the AUC value, peak PG value could also be predicted using this system. Prediction of peak glucose without blood sampling would be a useful substitute for OGTTs or monitoring fluctuations in postprandial glucose levels at home.
Application of the IG-AUC measurement system
In this study, the accuracy of AUC was only evaluated over 2 h. This system can easily be applied for longer measurement periods simply by leaving the hydrogel patch attached for the desired period. If placed for 4 h, AUC would reflect the total increment in postprandial glucose levels attributed to diabetes. Glucose AUC divided by the accumulation time corresponds to the average glucose level, and therefore, if the patch was placed for 10–12 h, the average daytime or nighttime glucose levels could be determined without blood sampling. Further studies are needed to confirm the possibilities of such longer measurement periods.
In summary, our data show the correlation between IG-AUC and PG-AUC during rapid change of glucose over a wide range of AUC in subjects with and without diabetes and validates the glucose AUC monitoring system using ISF extraction technology as a surrogate of direct glucose AUC monitoring by either frequent blood sampling or continuous monitoring. Our results indicated that the system is clinically useful and that this novel easy-to-use IG-AUC monitoring system has potential for evaluating postprandial glucose excursion in daily diabetes clinical practice.
Footnotes
Acknowledgments
We would like to thank K. Asano (Sysmex Corp., Japan) for his helpful advice and encouragement. We would also like to thank M. Takahashi, S. Hosoya, and T. Watanabe (Sysmex Corp., Japan) for their assistance and precise measurements. K.S. researched the data and wrote the manuscript. Y.H. and N.H. researched the data. W.O. contributed to the discussion. T.S. researched the data and wrote the manuscript. S.O., K.H., Y.A., Y.K., and J.K. researched the data. Y.M. contributed to the discussion. H.N. contributed to the development of the system, construction of study design, and reviewing all the clinical data and manuscript.
Author Disclosure Statement
K.S., Y.H., and N.H. received research funding from Sysmex. T.S., S.O., K.H., Y.A., Y.K., J.K., and Y.M. are employees of Sysmex. No other potential conflicts of interest relevant to this article were reported.