
Abstract
Background:
Sweat contains glucose that can accurately reflect blood glucose. However, skin surface glucose can confound these measurements.
Methods:
A perfusion method was used to rapidly harvest sweat from forearm sites on human subjects. The sweat samples were analyzed for glucose by high-performance liquid chromatography methods and compared with the results obtained with a blood glucose meter.
Results:
The results of 23 different studies of seven individual subjects with diabetes show a strong correlation between sweat glucose and blood glucose.
Conclusion:
Sweat glucose, when properly harvested to prevent contamination from other sources on the skin's surface, can accurately reflect blood glucose levels.
Introduction
Subject and Methods
Skin preparation and sweat stimulation
We evaluated the correlation between BG and SG in a group of seven subjects with diabetes in an Institutional Review Board–approved protocol. We evaluated serial measurements of BG and SG on both arms over time. The sites were cleaned with soap and water and then a solution of 70% isopropanol in water. Sweat stimulation was achieved on each site using iontophoretic delivery of pilocarpine, a Food and Drug Administration–approved method used for diagnosing cystic fibrosis. 13 Pilocarpine nitrate (1%) solution was applied to the delivery electrode on the lower forearm, while the return electrode was attached to the upper arm. A current of 1 mA was applied to the delivery electrodes for 10 min using a commercial iontophoresis power source (Phoresor®, IOMED, Salt Lake City, UT). After application, the electrodes were removed, and the sites were wiped dry. Immediately following sweat stimulation a barrier substance was applied to the skin site where sweat is collected. This material consisted of a mixture of petrolatum and low-molecular-weight paraffin. A thin, uniform layer was obtained by rubbing the barrier material onto the skin using a gloved finger.
Perfusion sweat collection
The correlation of SG and BG was evaluated using a perfusion technique. A photograph of the perfusion device is shown in Figure 1. The collection area of the perfusion device was 2 cm2. The device rests on the skin's surface after sweat stimulation and is held in place with an elastic band. The sweat is collected in a serpentine collection chamber that is perfused with 150 μL of water every 10 min. The sweat is then swept into a collection vial along with the perfusate. The procedure is repeated every 10 min during the experiment, and each sample is subsequently analyzed for glucose by high-performance anion exchange liquid chromatography with pulsed amperometric detection (HPAE-PAD) (see below). Devices were attached to the left forearm and right forearm for simultaneous measurements from each site.
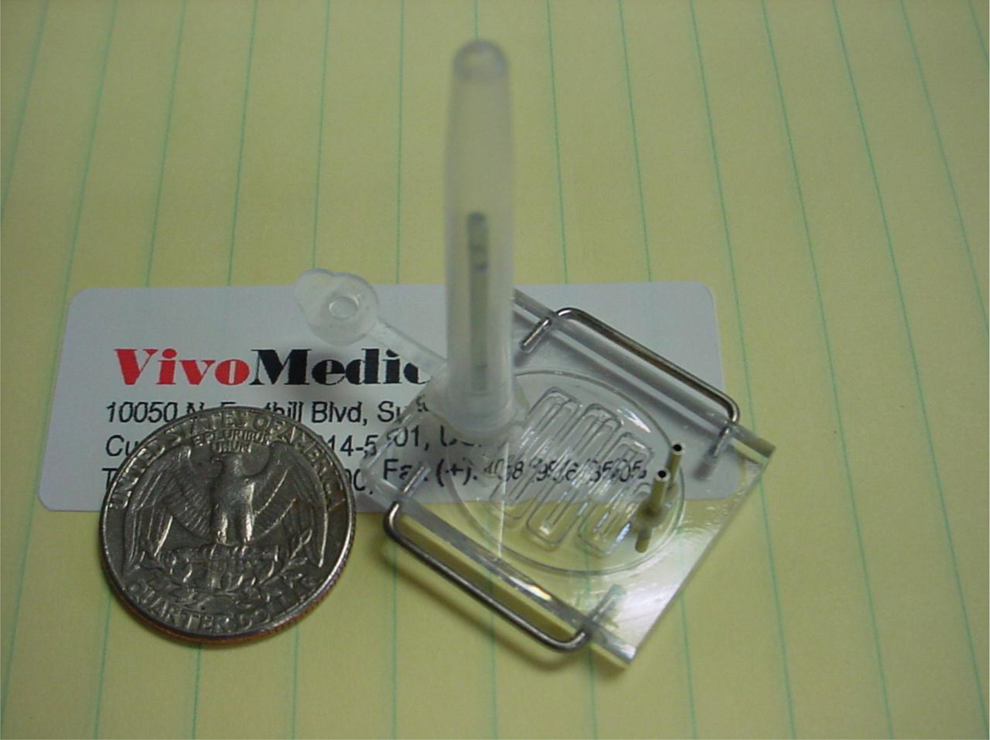
The perfusion, sweat collection device. Color images available online at
To determine the volume of sweat collected the sweat rate is measured in an area immediately adjacent to the sweat collection area. The sweat rate is determined by measuring the relative humidity of a stream of dry nitrogen blown over the skin's surface. From the sweat rate, area, and duration of the measurement the sweat volume can be calculated. The mass of glucose in the sample (determined by HPAE-PAD) and the volume are used to determine the glucose concentration in sweat.
During the initial application of the sweat collection chamber leakage of sample and contamination were often encountered. Hence, the data from the first 10-min collection intervals were omitted from analysis.
BG measurement
BG measurements were obtained at 10-min intervals throughout the study. A commercial BG monitor (Accu-Chek®, Roche Diagnostics, Indianapolis, IN) was used, and blood was obtained from the subject's fingertip. This device routinely provides results with a coefficient of variation of <5%. 14
Glucose assay conditions
Perfusion samples were filtered and then analyzed using HPAE-PAD, using a Dionex (Sunnyvale, CA) PA-20 carbohydrate column (the method used is similar to that proposed by Dionex 15 ). This method typically gives a relative SD of <3% on standards bracketing the concentration of glucose seen in the sweat samples reported here.
Subjects
The correlation between SG and BG was evaluated in a group of subjects with diabetes. The BG profile obtained was simply the one that the subject normally displayed. If the subject entered the laboratory with normal or low BG values he or she was instructed to ingest a solution containing 75 g of glucose. If they entered the laboratory with high BG values they administered insulin as instructed by their physician. To show correlation between SG and BG it is necessary to have a reasonable change in BG. Thus, for this presentation we have selected those subjects where ΔBG exceeded 90 mg/dL (up or down) during the course of the study. We evaluated seven different subjects on 12 separate occasions on two sites (left forearm and right forearm) for a total of 24 studies meeting the ΔBG criterion. On one arm for one subject a pump failure resulted in the loss of data. Thus, 23 studies are included in this report. Six of the seven subjects were white, and one was Asian. Six had type 1 diabetes, and one had type 2. There were five female subjects and two males. They had a mean age of 43.7 years and a mean body mass index of 25.8 kg/m2. The mean BG change in all studies was 143 mg/dL.
Results and Discussion
Following pilocarpine stimulation sweat rates increased to above 1 μL/cm2/min. During the course of the study, however, sweat rates decay continuously to about 0.1 μL/cm2/min, similar to unstimulated values. Sweat samples were collected by the perfusion method and analyzed by HPAE-PAD. The data for one subject are shown in Figure 2. The subject entered the study with BG values near 200 mg/dL, which increased to just over 300 mg/dL over the next 60 min. During this period BG and SG samples were collected every 10 min. As can be seen in Figure 2, the SG values “lag” the corresponding BG values. The “lag” time is determined by moving all SG values along the time axis until maximal correlation with BG values is obtained for all the data in an individual study. The results of this analysis, obtained across a large group of subjects, have shown that the SG values “lag” BG values by about 8 min. All linear regression results presented here utilize a constant 8-min time lag. The linear regression analysis of the data in Figure 2 yields a correlation coefficient (R) value of 0.92.
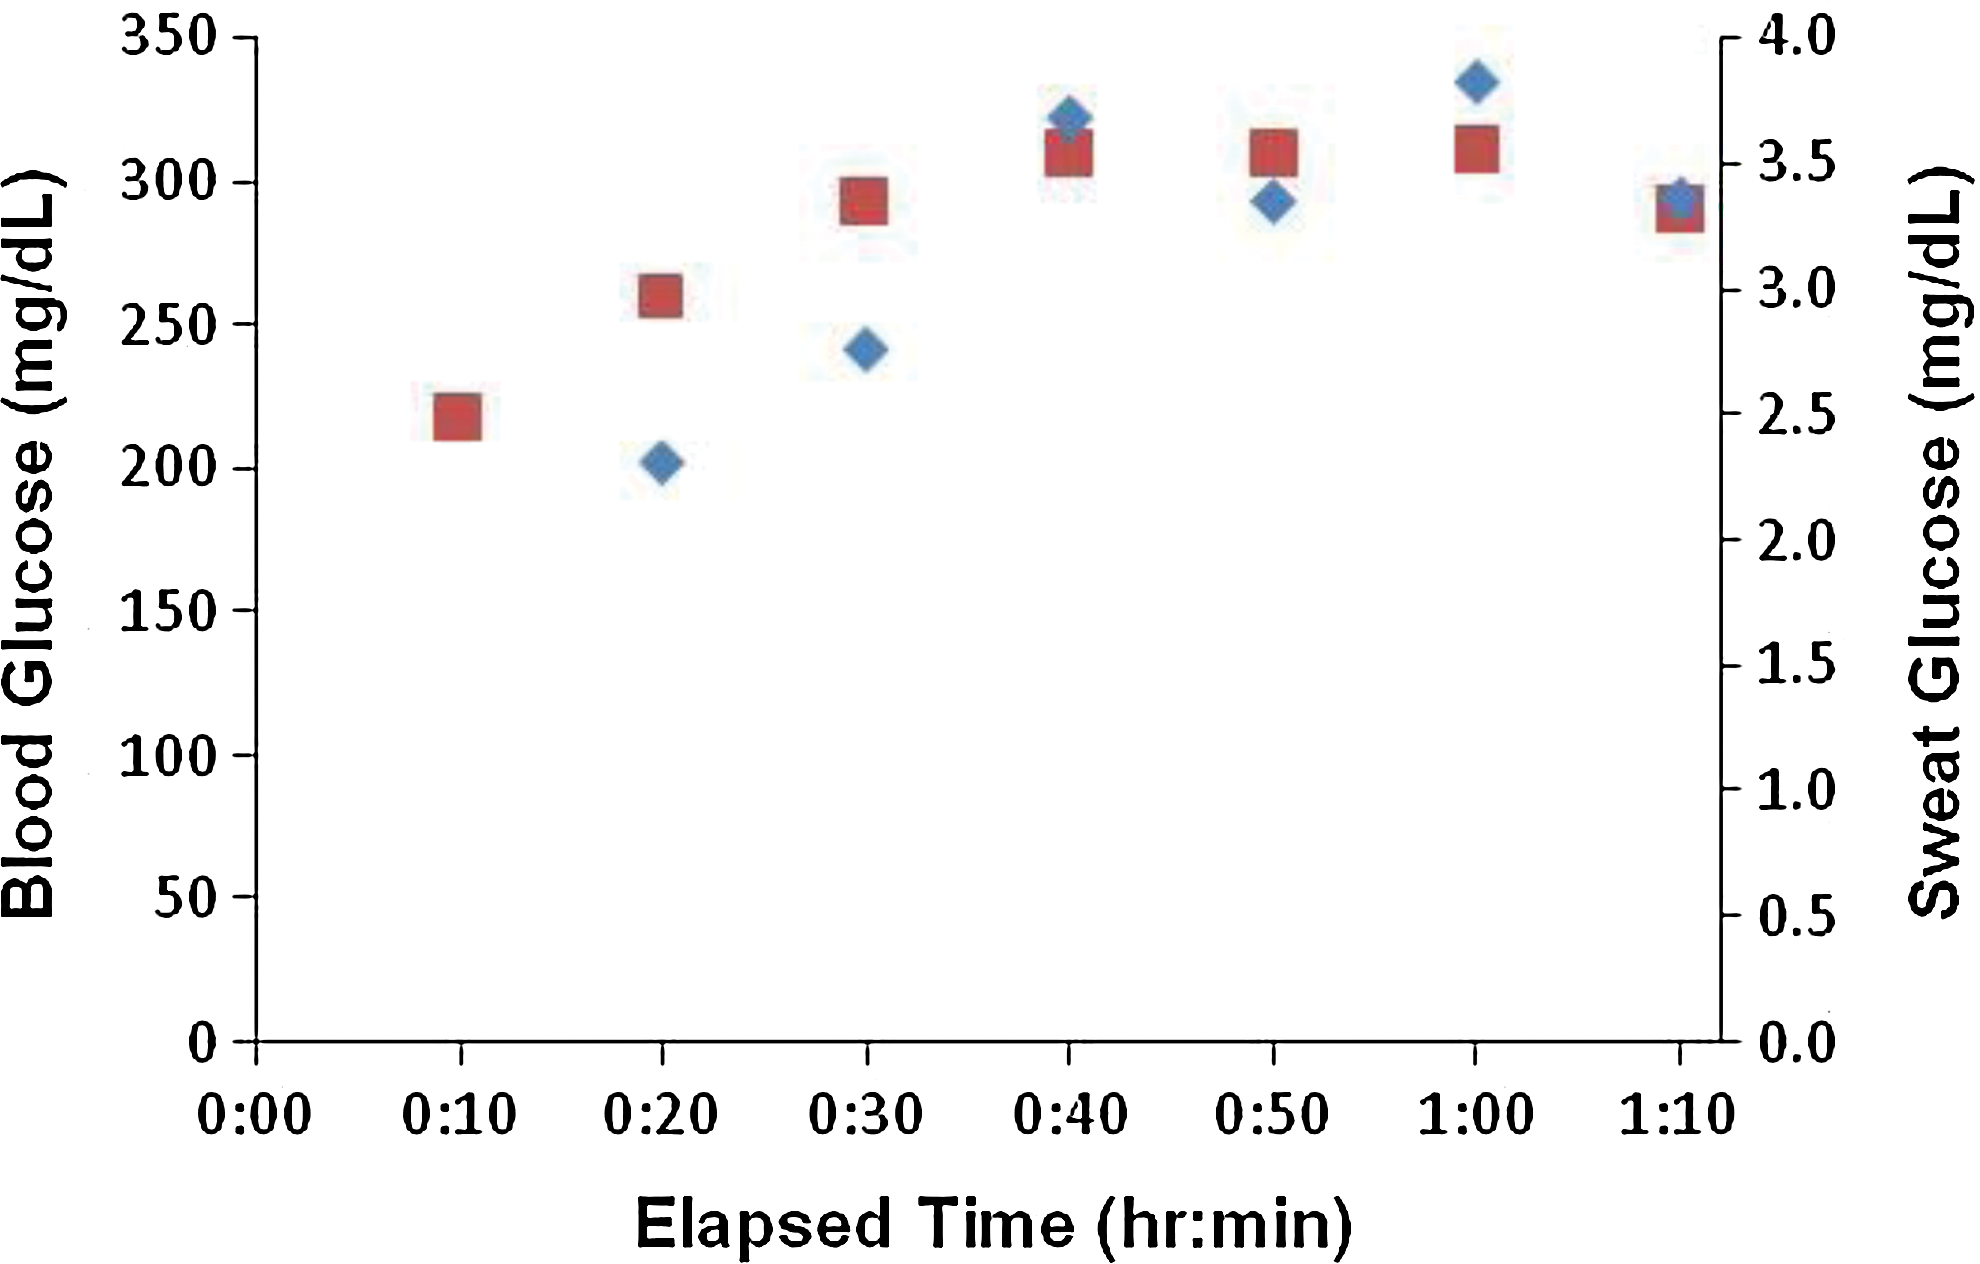
Sweat glucose (diamonds) and blood glucose (squares) data for one subject. Color images available online at
The same linear regression analysis was performed for all studies. The individual R obtained for all 23 studies yielded a mean value of 0.83 and a median value of 0.94.
A linear correlation between SG and BG is equivalent to a constant SG/BG ratio during each study. The dependence of SG/BG on sweat rate is shown in Figure 3. These results show a small but statistically significant (P<0.001) increase in SG/BG with increasing sweat rate. Note, however, that at more physiologically relevant sweat rates below about 0.9 μL/cm2/min there is no effect of sweat rate on SG/BG (R=0.065, P<0.45). In addition, these results show that the correlation maintains even at unstimulated sweat rates of 0.1 μL/cm2/min.
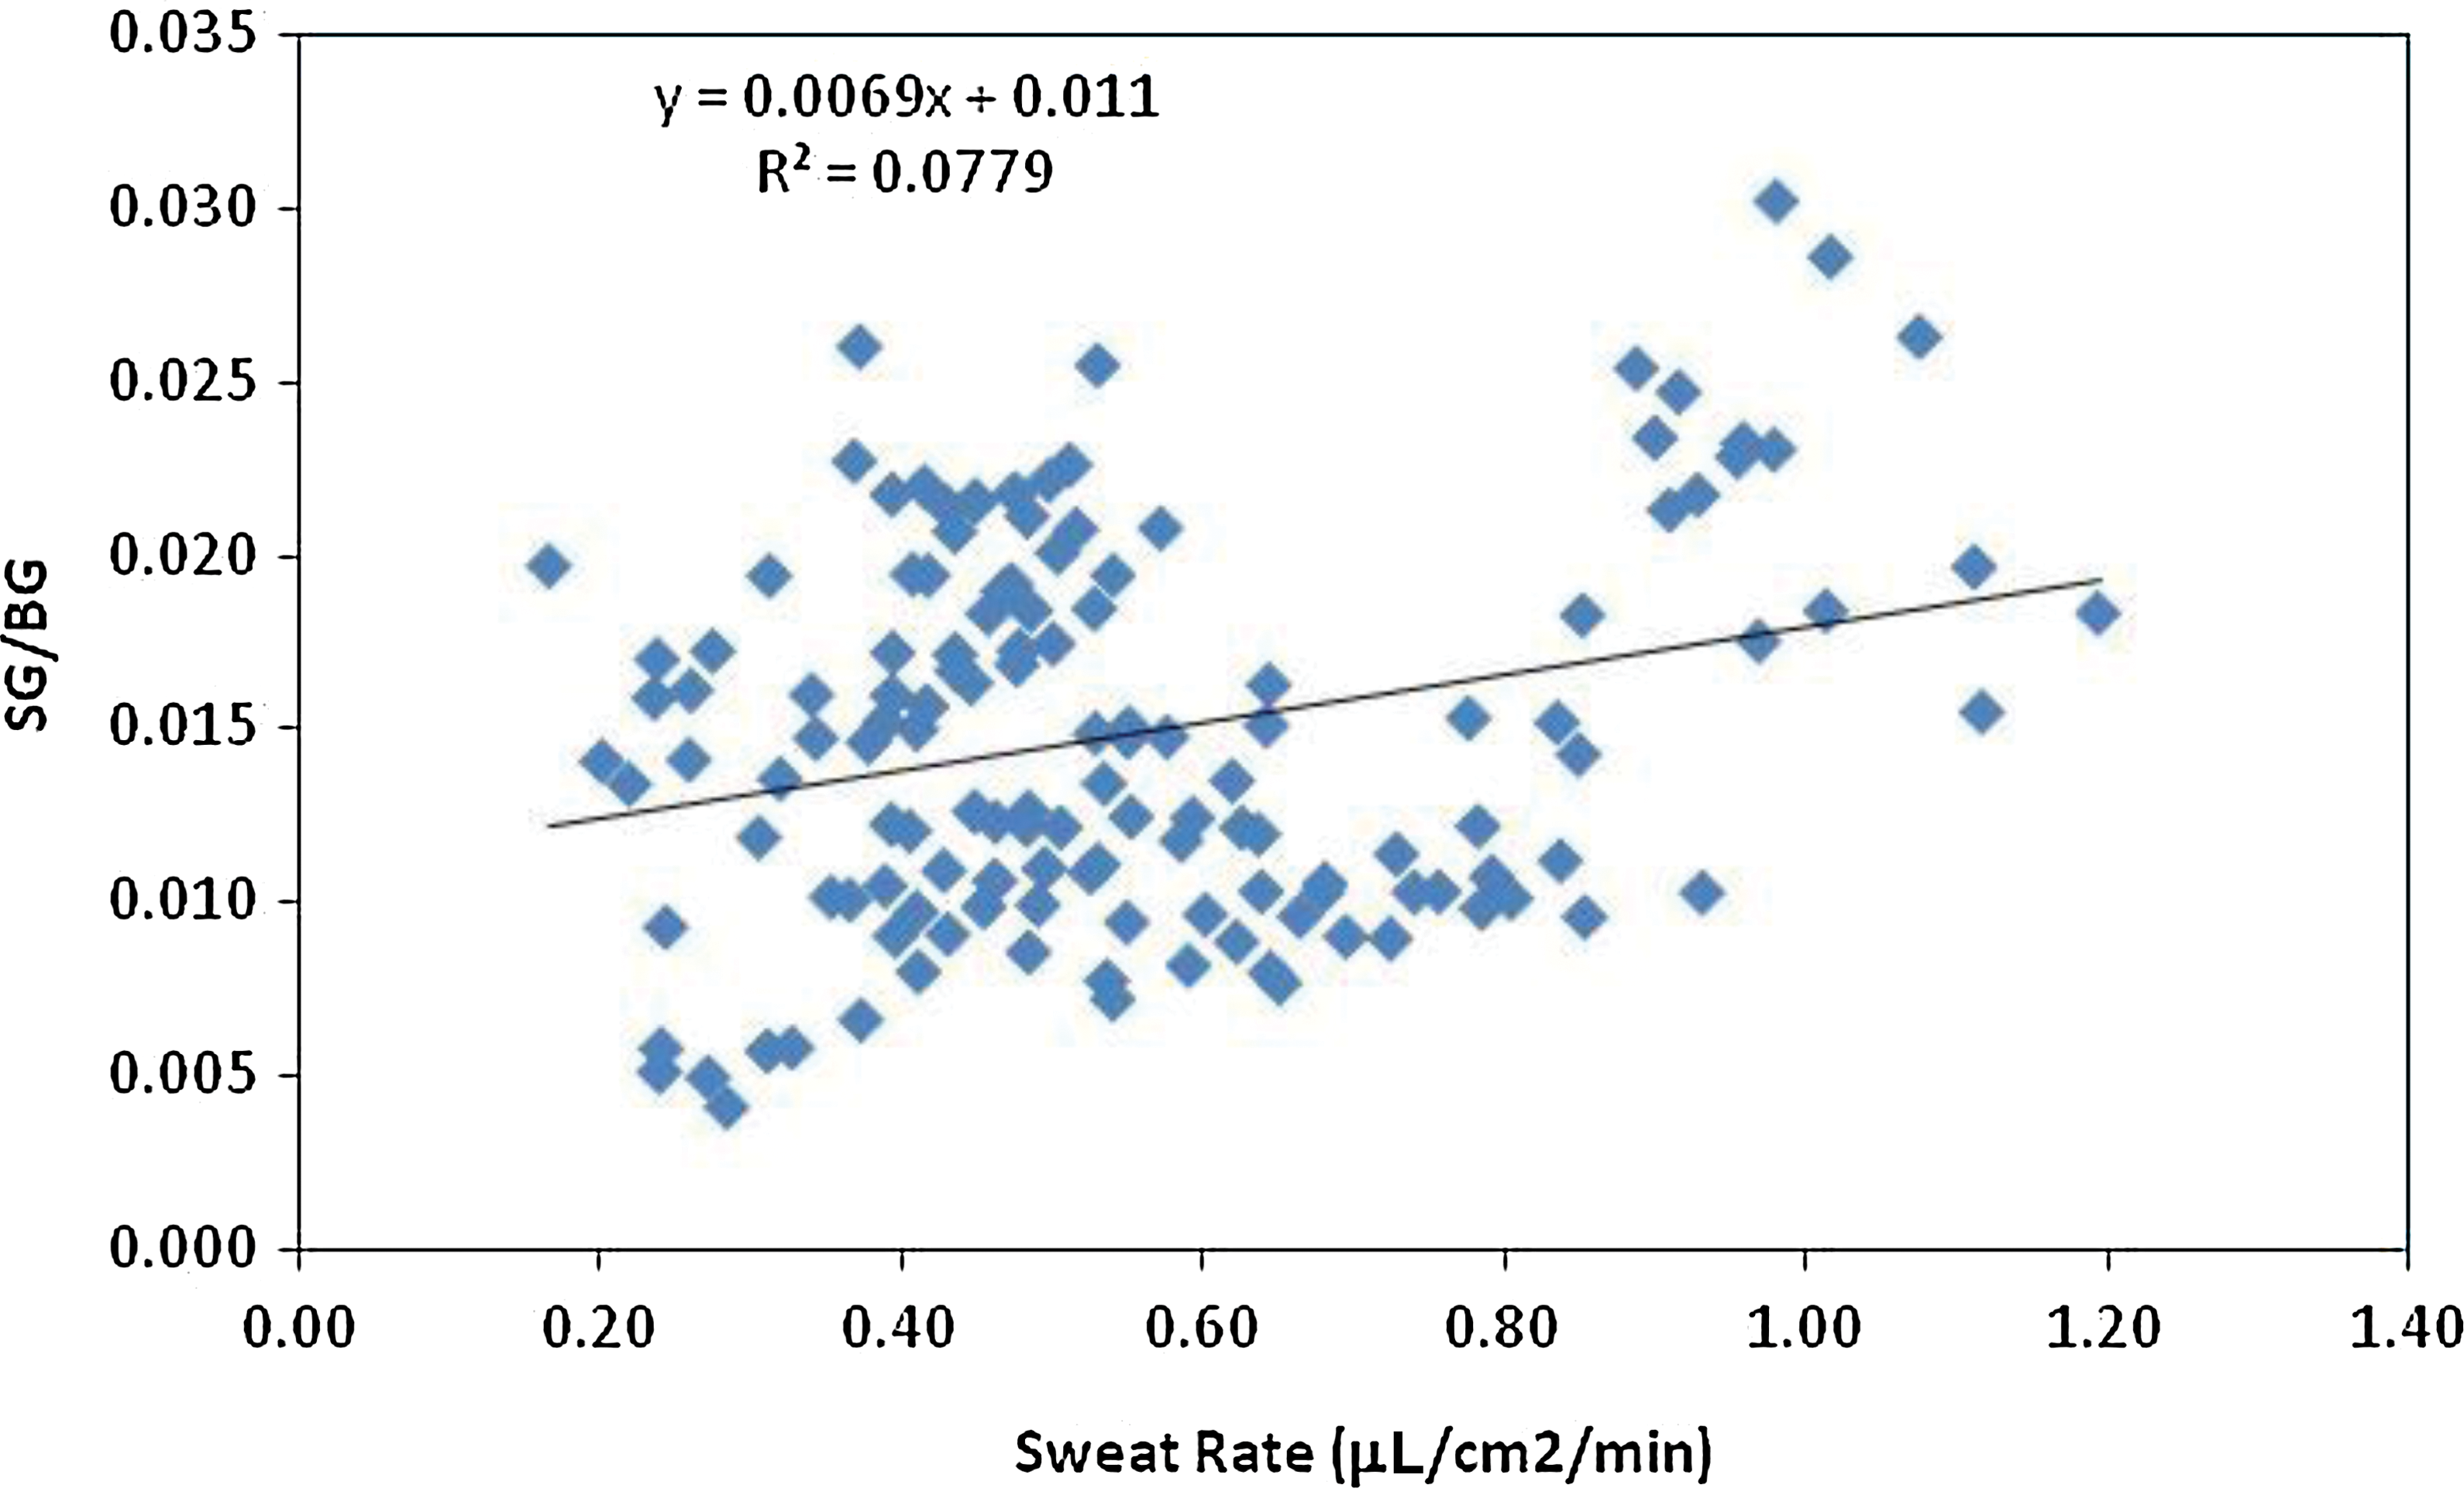
The sweat glucose/blood glucose (SG/BG) ratio versus sweat rate for all subjects studied. Color images available online at
To prospectively “predict” BG values from SG, a calibration is required. The calibration utilized the first analyzed data point assuming a linear relationship between SG and BG and an intercept of 0. This is equivalent to using the BG/SG ratio of the first point to “predict” all following points in time. This calculation is shown in Eq. 1 where BG at time t (BG
t
) is calculated from SG at time t (SG
t
) and the calibration constant, which is the ratio of BG/SG at the initial time point (BG/SG
t=0):
The data for all 23 studies analyzed using the first point calibration are shown in Figure 4. Note that the calibration point is not included in these data. Hence, there are 115 total data points (23 studies×5 points per study). The mean relative difference (MRD) is defined as the mean value of ([SG – BG]/BG) over all data pairs. The mean absolute relative difference (MARD) is the mean of the absolute value ([SG – BG]/BG) over all data pairs. The MRD reflects accuracy, and MARD reflects spread of the data, or precision. For the data presented in Figure 4 the MRD is −6±32%, and the MARD is 23±23%. The correlation coefficient for these data is 0.75, which is statistically significant (P<0.0001). None of these metrics includes the calibration point.
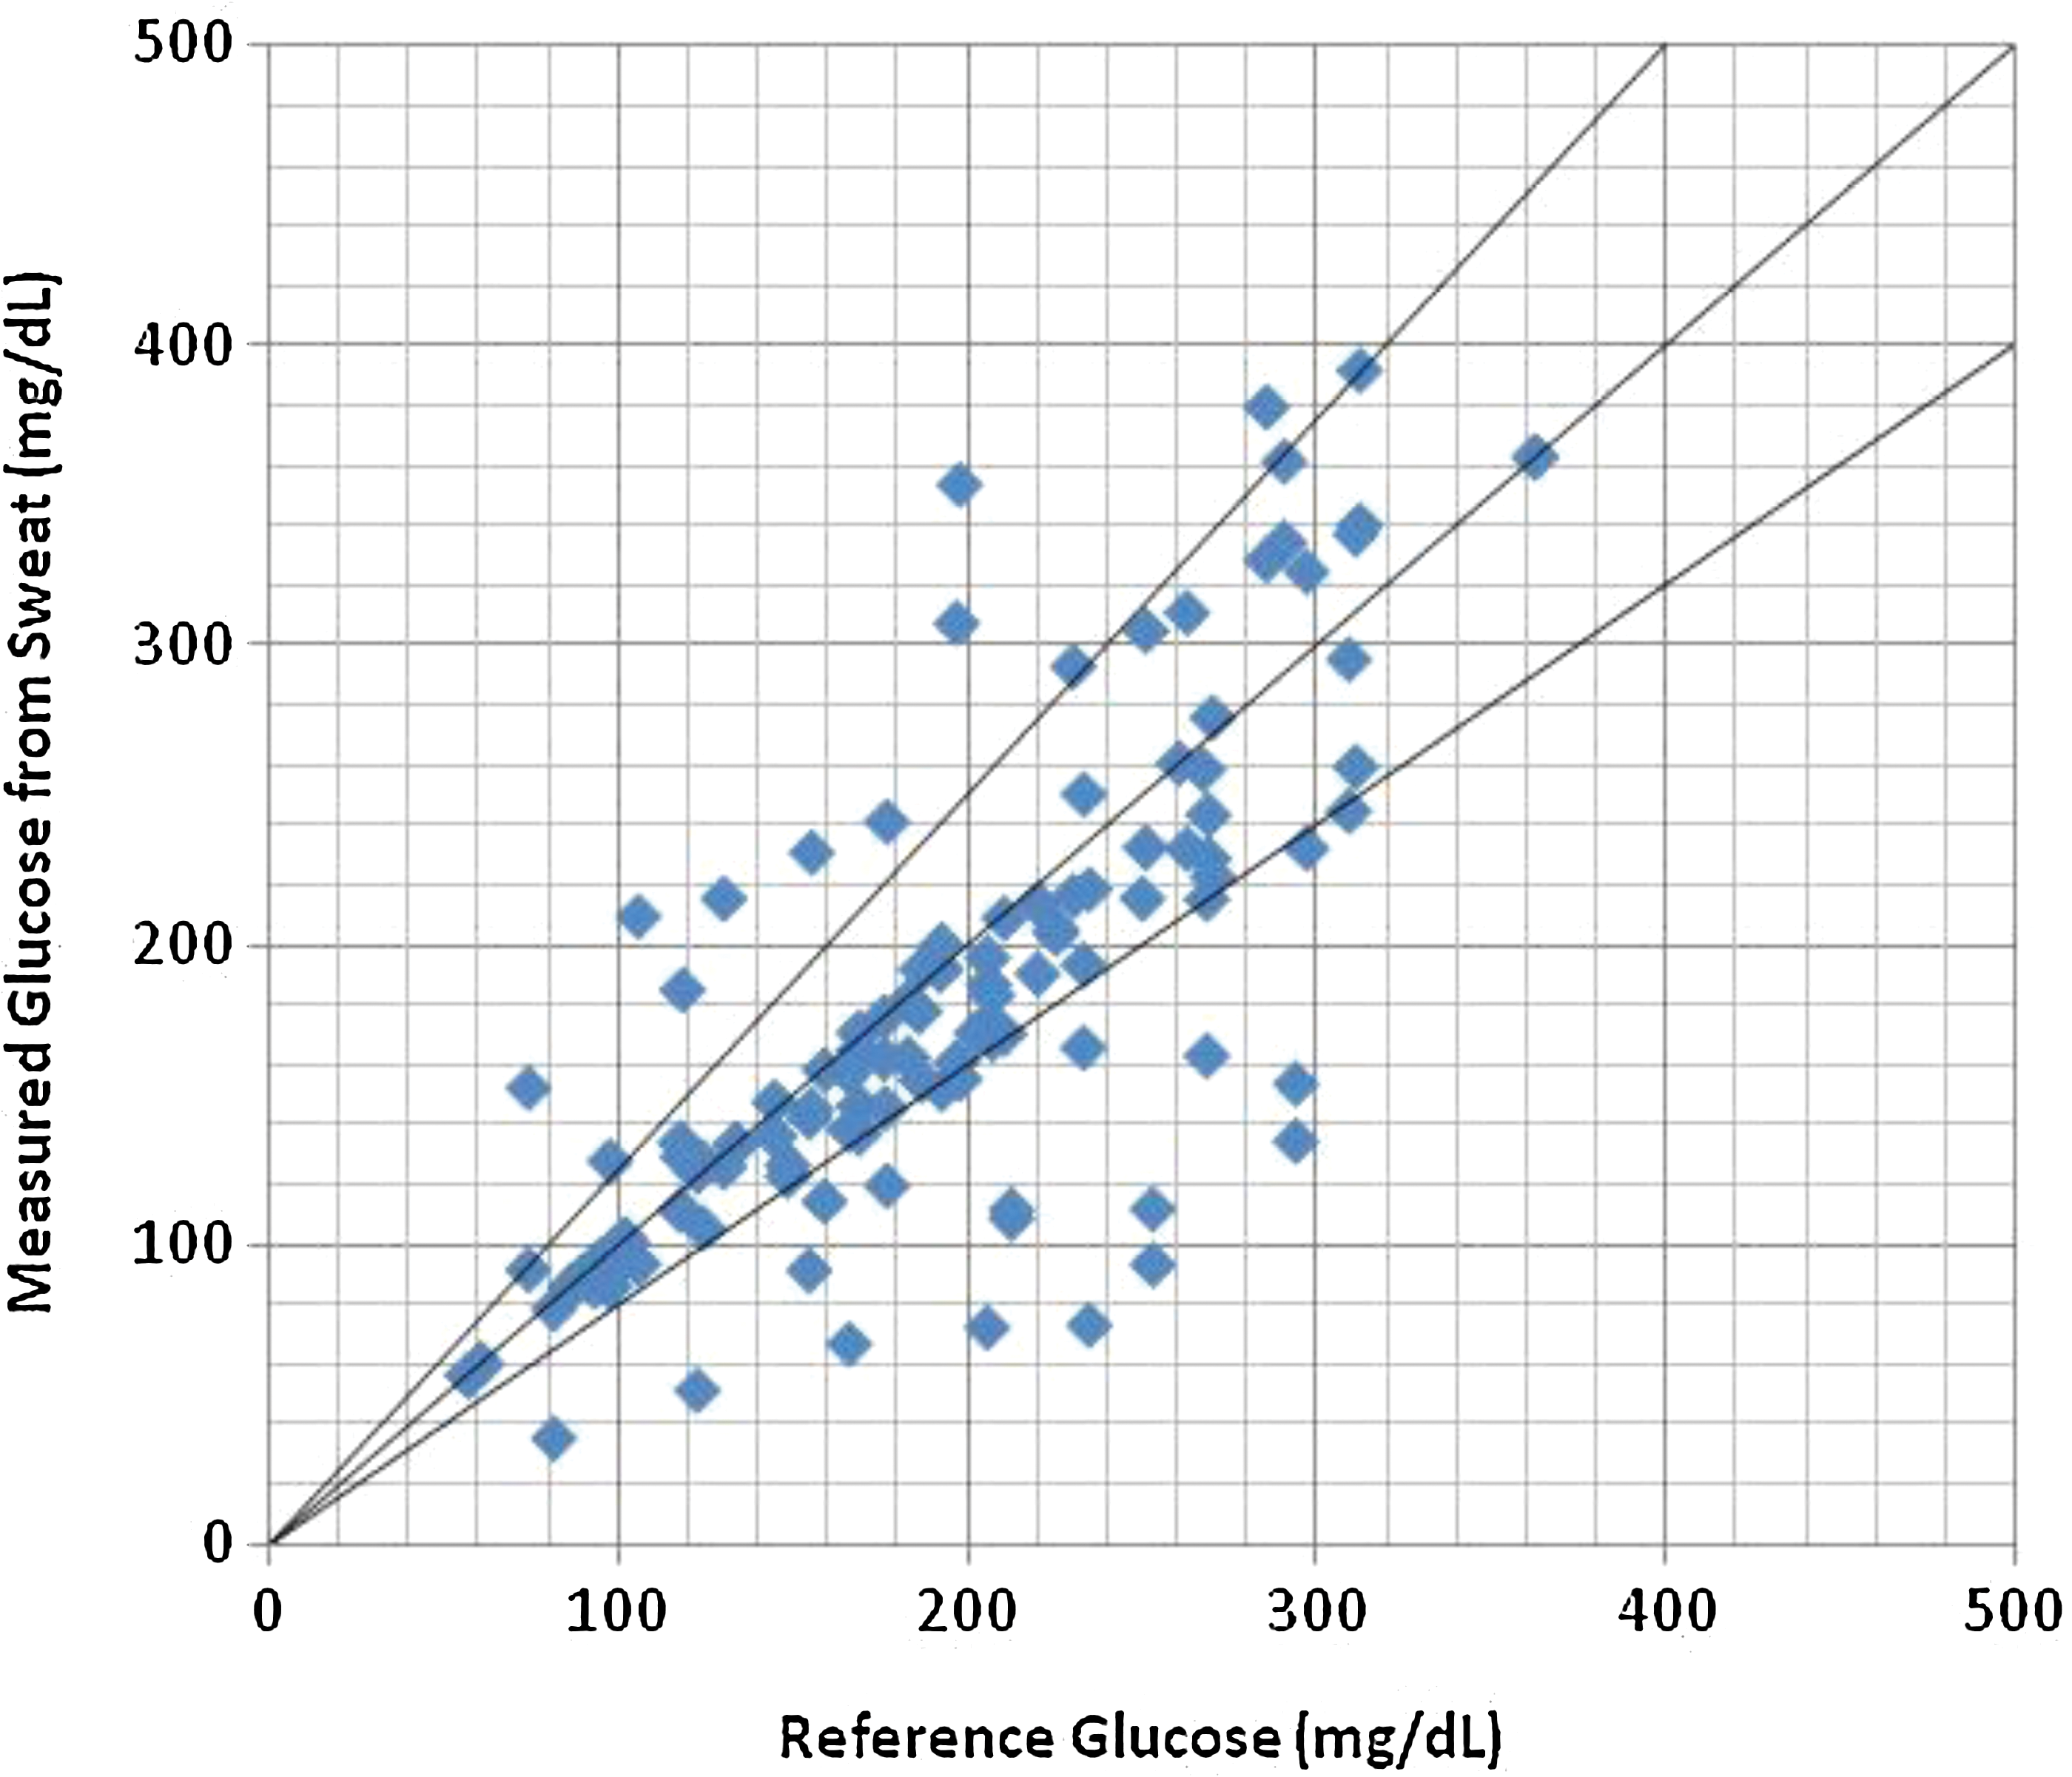
Predicted (measured) blood glucose values from sweat glucose versus a corresponding reference blood glucose value. The upper and lower lines represent +20% and −20%, respectively, about the middle line. Color images available online at
A summary of the data for all subjects is shown in Table 1.
The sweat glucose (SG)/blood glucose (BG) ratio is presented for data obtained on the right and left arms.
The results presented here show that there is a statistically significant correlation between SG and BG in a group of subjects with diabetes. Moreover, the correlation was obtained as the sweat rate varied over a 10-fold range. This is equivalent to sweat rates obtained from ambient conditions to temperature near 50°C. The SG values lag the reference BG value by an average of 8 min. Much of that time delay is due to the time required (10 min) to collect sufficient sweat to measure glucose by HPAE-PAD. Using a single-point, prospective analysis, BG values obtained from SG were obtained. These results show that for all subjects the average deviation (MARD) of the measured value relative to the reference value is about 23%. Note that a commercially available BG meter and strip designed for self-monitoring were used as a reference in these studies so that some of the deviation can be accounted for by BG values. The error in these measurements is as much as 20% and is included in the total value (23%) cited here. (The International Organization for Standardization standards for BG monitoring devices [ISO 15197:2003] state that 95% of the individual glucose results shall fall within±15 mg/dL of the results of the manufacturer's measurement procedure at glucose concentrations of <75 mg/dL and within±20% at glucose concentrations ≥75 mg/dL.) Thus, the actual error associated with SG measurements is comparable to the error obtained in BG measurements. The results presented here show that glucose in sweat is at a concentration that is about 1–2% of the corresponding blood value. This is lower than the value reported in previous studies. 6 –9 The difference most likely reflects the care taken in this study to collect sweat samples uncontaminated with glucose from other sources on the skin (see below). In addition, the studies presented here used a specific glucose assay, whereas those earlier studies measured “reducing” substances, which likely contain other sugars as well as glucose and other substances.
The data presented here also show a strong correlation between SG and BG over a broad range of subjects, BG levels, and sweat rates. These results are in contrast to earlier studies where no correlation was found. 6,7,8,10 We believe the failure to show a strong and reproducible correlation in those previous studies stems from the fact that they sampled glucose from multiple compartments in or on the skin's surface.
There are at least three distinct kinetic compartments of glucose on the skin. These compartments are associated with (a) the stratum corneum, (b) the outward migration of glucose from the interstitial fluid, and (c) sweat.
The stratum corneum is the outermost layer of the skin. This outer layer contains glucose that is enzymatically cleaved from a lipid precursor as epidermal cells migrate outward. The second source of glucose is from outward diffusion from the interstitial fluid underlying the dermis. Several groups have shown that glucose from this source can be collected on the skin's surface over several hours period of time. 16,17 Again, because of the time required to obtain the glucose sample, this source cannot reflect changes occurring rapidly in blood levels. The most rapidly appearing source of glucose is that found in sweat. As sweat response occurs rapidly and the sweat gland is highly vascularized, this source can reflect glucose levels within the body.
Previous researchers have not consistently found a correlation between SG and BG. We believe the reason for this difference lies in the manner in which sweat is collected. We have taken care to clean the skin to remove residual glucose and occlude the skin prior to sweat collection to mask other sources of glucose on the skin. The occlusive barrier is such, however, that active sweat can penetrate it, forming beads of liquid on the surface. This sweat can then be collected without contamination from other sources of glucose on the skin's surface. We also collect sweat samples at short time intervals to minimize mixing with other sources of glucose.
In summary, we have demonstrated in subjects with diabetes that SG and BG are highly correlated over a broad range of sweat rates and BG values. These studies form a proof-of-principle for sweat collection and glucose measurement. Although the device described here is not commercially viable, a substantially simpler device has recently been disclosed. 18
Footnotes
Author Disclosure Statement
All authors were employed by the company performing these studies. They have no conflicting associations.