
Abstract
Aims:
This study monitored blood glucose profiles in normotolerant breastfeeding women, with and without previous gestational diabetes, in real life in order to identify normal blood glucose fluctuations during breastfeeding.
Subjects and Methods:
Two groups were studied: (1) 18 women with recent gestational diabetes mellitus but normotolerant postpartum (pGDM-N group) and (2) 15 women normotolerant both during pregnancy and postpartum (pN-N group). All participants underwent continuous glucose monitoring during which they recorded their main daily activities and three standardized events: “suckling,” “meal,” and “meal and suckling.” Other than these three events, these women were essentially on an “ad lib” diet. Data were expressed as median and SD values. Student's t test and Fisher's test were used to compare mean, variances, and percentages. Differences were significant with P<0.05. Clustering analysis was used to determine the normal range of glucose values.
Results:
The two groups were matched for age, follow-up duration, and monitoring measurements but not for body mass index. Blood glucose levels and variances were higher in the pGDM-N group, particularly during daytime and the three standardized events, and were not related to body mass index. Suckling had no direct effect on glucose profile during both the non-fed and the fed state. Blood glucose levels that best represent the normal breastfeeding population were between 50 and 126 mg/dL (from 2.8 to 7.0 mmol/L).
Conclusions:
Three months after delivery, normotolerant women with recent gestational diabetes had higher daily blood glucose levels than women who were always normotolerant, with no direct effect of suckling. The blood glucose profiles of healthy subjects could be representative of the normal range of the population during breastfeeding.
Introduction
The continuous glucose monitoring system (CGMS) was approved a decade ago, 12 initially for adults and then for children with type 1 diabetes mellitus. Every 10 s the system measures interstitial glucose levels in subcutaneous tissue, within a range of 40–400 mg/dL (2.2–22.2 mmol/L) and saves the mean value every 5 min (for 288 data points in a 24-h period). Glucose values obtained by such a device have been shown to be correlated with laboratory measurements of plasma glucose levels and with capillary blood glucose readings during periods of euglycemia, hyperglycemia, and hypoglycemia. 13,14 CGMS performance has been shown to reveal an abnormal glucose profile in subjects with prediabetes. 15
Therefore, using monitoring we evaluated whether breastfeeding women with recent GDM have abnormal glucose profiles even when they are normotolerant. To this aim, we analyzed blood glucose profiles of normotolerant breastfeeding women, with and without recent GDM, about 3 months after delivery, during their normal daily activities (24 h, daytime, and nighttime) and during three standardized events: “suckling,” “meal,” and “meal and suckling.” Finally, using statistical techniques of cluster analysis, we also tried to determine normal blood glucose fluctuations in real life during breastfeeding.
Subjects and Methods
Women were successively recruited from January 2007 to December 2008 from outpatients attending the Diabetes in Pregnancy and Gynaecology Unit at “Sapienza University,” Rome, Italy. Eighteen women with GDM (3-h 100-g oral glucose tolerance test [OGTT] at week 24–28 of gestation, by the criteria of Carpenter and Coustan 16 ) but normotolerant postpartum (75-g OGTT-negative) 17 constituted the pGDM-N group, and 15 normotolerant women both during pregnancy (glucose challenge test and/or 3-h 100-g OGTT-negative) and postpartum (fasting blood glucose <100 mg/dL [5.5 mmol/L]) constituted the pN-N group (control). All women were breastfeeding with no more than one bottle of formula per day of supplementation at 6 or more weeks after delivery. They received general dietary recommendations (except for “standardized events”; see below) with respect to caloric intake, its distribution during the day in terms of meals and snacks, and nutrient distribution, 18,19 checked by a paper food diary. We recorded the main clinical and anthropometric data (age, delivery date, follow-up duration, body mass index [BMI]) and implanted the CGMS® Gold™ device (MiniMed-Medtronic, Northridge, CA) according to the manufacturer's directions. 20,21 Participants wore the CGMS for up to 72 h and recorded the start of infant suckling, food intake, exercise, sleep, three well-defined activities, and finger-stick blood glucose calibration. The Accu-Chek® Aviva (Roche Diagnostics, Basel, Switzerland) was used to measure finger-stick blood glucose and to calibrate the sensor (at least four times daily). Women were asked to perform three standardized events: (1) “suckling,” on Day 2 or 3 a suckling during a 120-min fast (60 min before and 60 min after suckling onset); (2) “meal,” on Day 2, a breakfast consisting of 200 g of partially skimmed milk and four cookies (containing a total of 33 g of carbohydrates) and lasting about 10 min, influenced neither by suckling (at least 60 min before and 60 min after) nor by other food intake (at least 3 h before and 60 min after; and (3) “meal and suckling,” on Day 3, a standard breakfast [as for (2)] just before a suckling episode.
Women were excluded from the study if they (1) were taking any medications known to influence blood glucose (including oral contraceptives), (2) were nursing more than one infant, or (3) were incapable of using the continuous glucose monitoring system. The local Ethics Committee approved the study protocol, and all women provided informed written consent to the study.
Sample size calculation
Power and Sample Size Calculation version 2.1.23 (
In the postpartum setting, mean glucose profiles in 28 healthy normal-weight women were 94 mg/dL (85.2 mmol/L) using a monitor at 6 weeks and irrespective of breastfeeding. 22 In our preliminary data, mean glucose profiles were 103 mg/dL (5.7 mmol/L) in breastfeeding women with previous GDM and 86 mg/dL (4.8 mmol/L) in those without GDM. During suckling an SD value of 14 mg/dL (0.8 mmol/L) has been reported in women with normal glucose tolerance 8 and, from our preliminary data, in a previous GDM group. Thus, the sample size chosen (calculated for differences of mean glucose values of 9 and 16 mg/dL and SD of 14 mg/dL) is 10–30 for each study group.
Statistical analysis
Data concerning the glucose profile are expected to follow a normal distribution and are expressed in terms of their median and SD. Several data analysis subroutines were used (clustering with particular reference to the medoid algorithm and the factorial method) to verify the coherence of or data by the patients' membership in the pGDM-N or the pN-N group and to determine, on the basis of homogeneous glucose profiles, the group of healthy women that identify the normal range of glucose fluctuations.
23,24
Standard methods, such as Student's t test and Fisher's test, are used to compare means, variances, and percentages. Simple regression analysis was performed to analyze the effect of postpartum BMI on blood glucose profiles. Significance was considered at a value of P<0.05. Data were analyzed with the R (
Results
Eighteen women were enrolled in the pGDM-N group and 15 women in the pN-N group. There were no significant differences between groups in terms of age (35.2±4.0 vs. 36.2±3.4 years, respectively), follow-up duration (11.5±3.7 vs. 13.1±5.1 weeks, respectively), and monitoring duration (864.1±220.1 vs. 737.5±144.4 data points per patient, respectively). However, the groups differed in BMI (25.9±4.5 vs. 23.0±1.6 kg/m2, P=0.02), which was distributed as follows: 10 pGDM-N women had normal weight, six were overweight, and two were obese, whereas 14 pN-N women had normal weight and one was overweight.
Figure 1 is a plane graph of clustering analysis of 33 subjects (from numbers 1 to 18 pGDM-N, from numbers 19 to 33 pN-N) and in particular of 288 blood glucose values per each study subject, on Day 2 of monitoring. The clustering analysis divided the whole population into two groups (circles 1 and 2) corresponding to our pGDM-N and pN-N groups in more than 86% of the point variability.
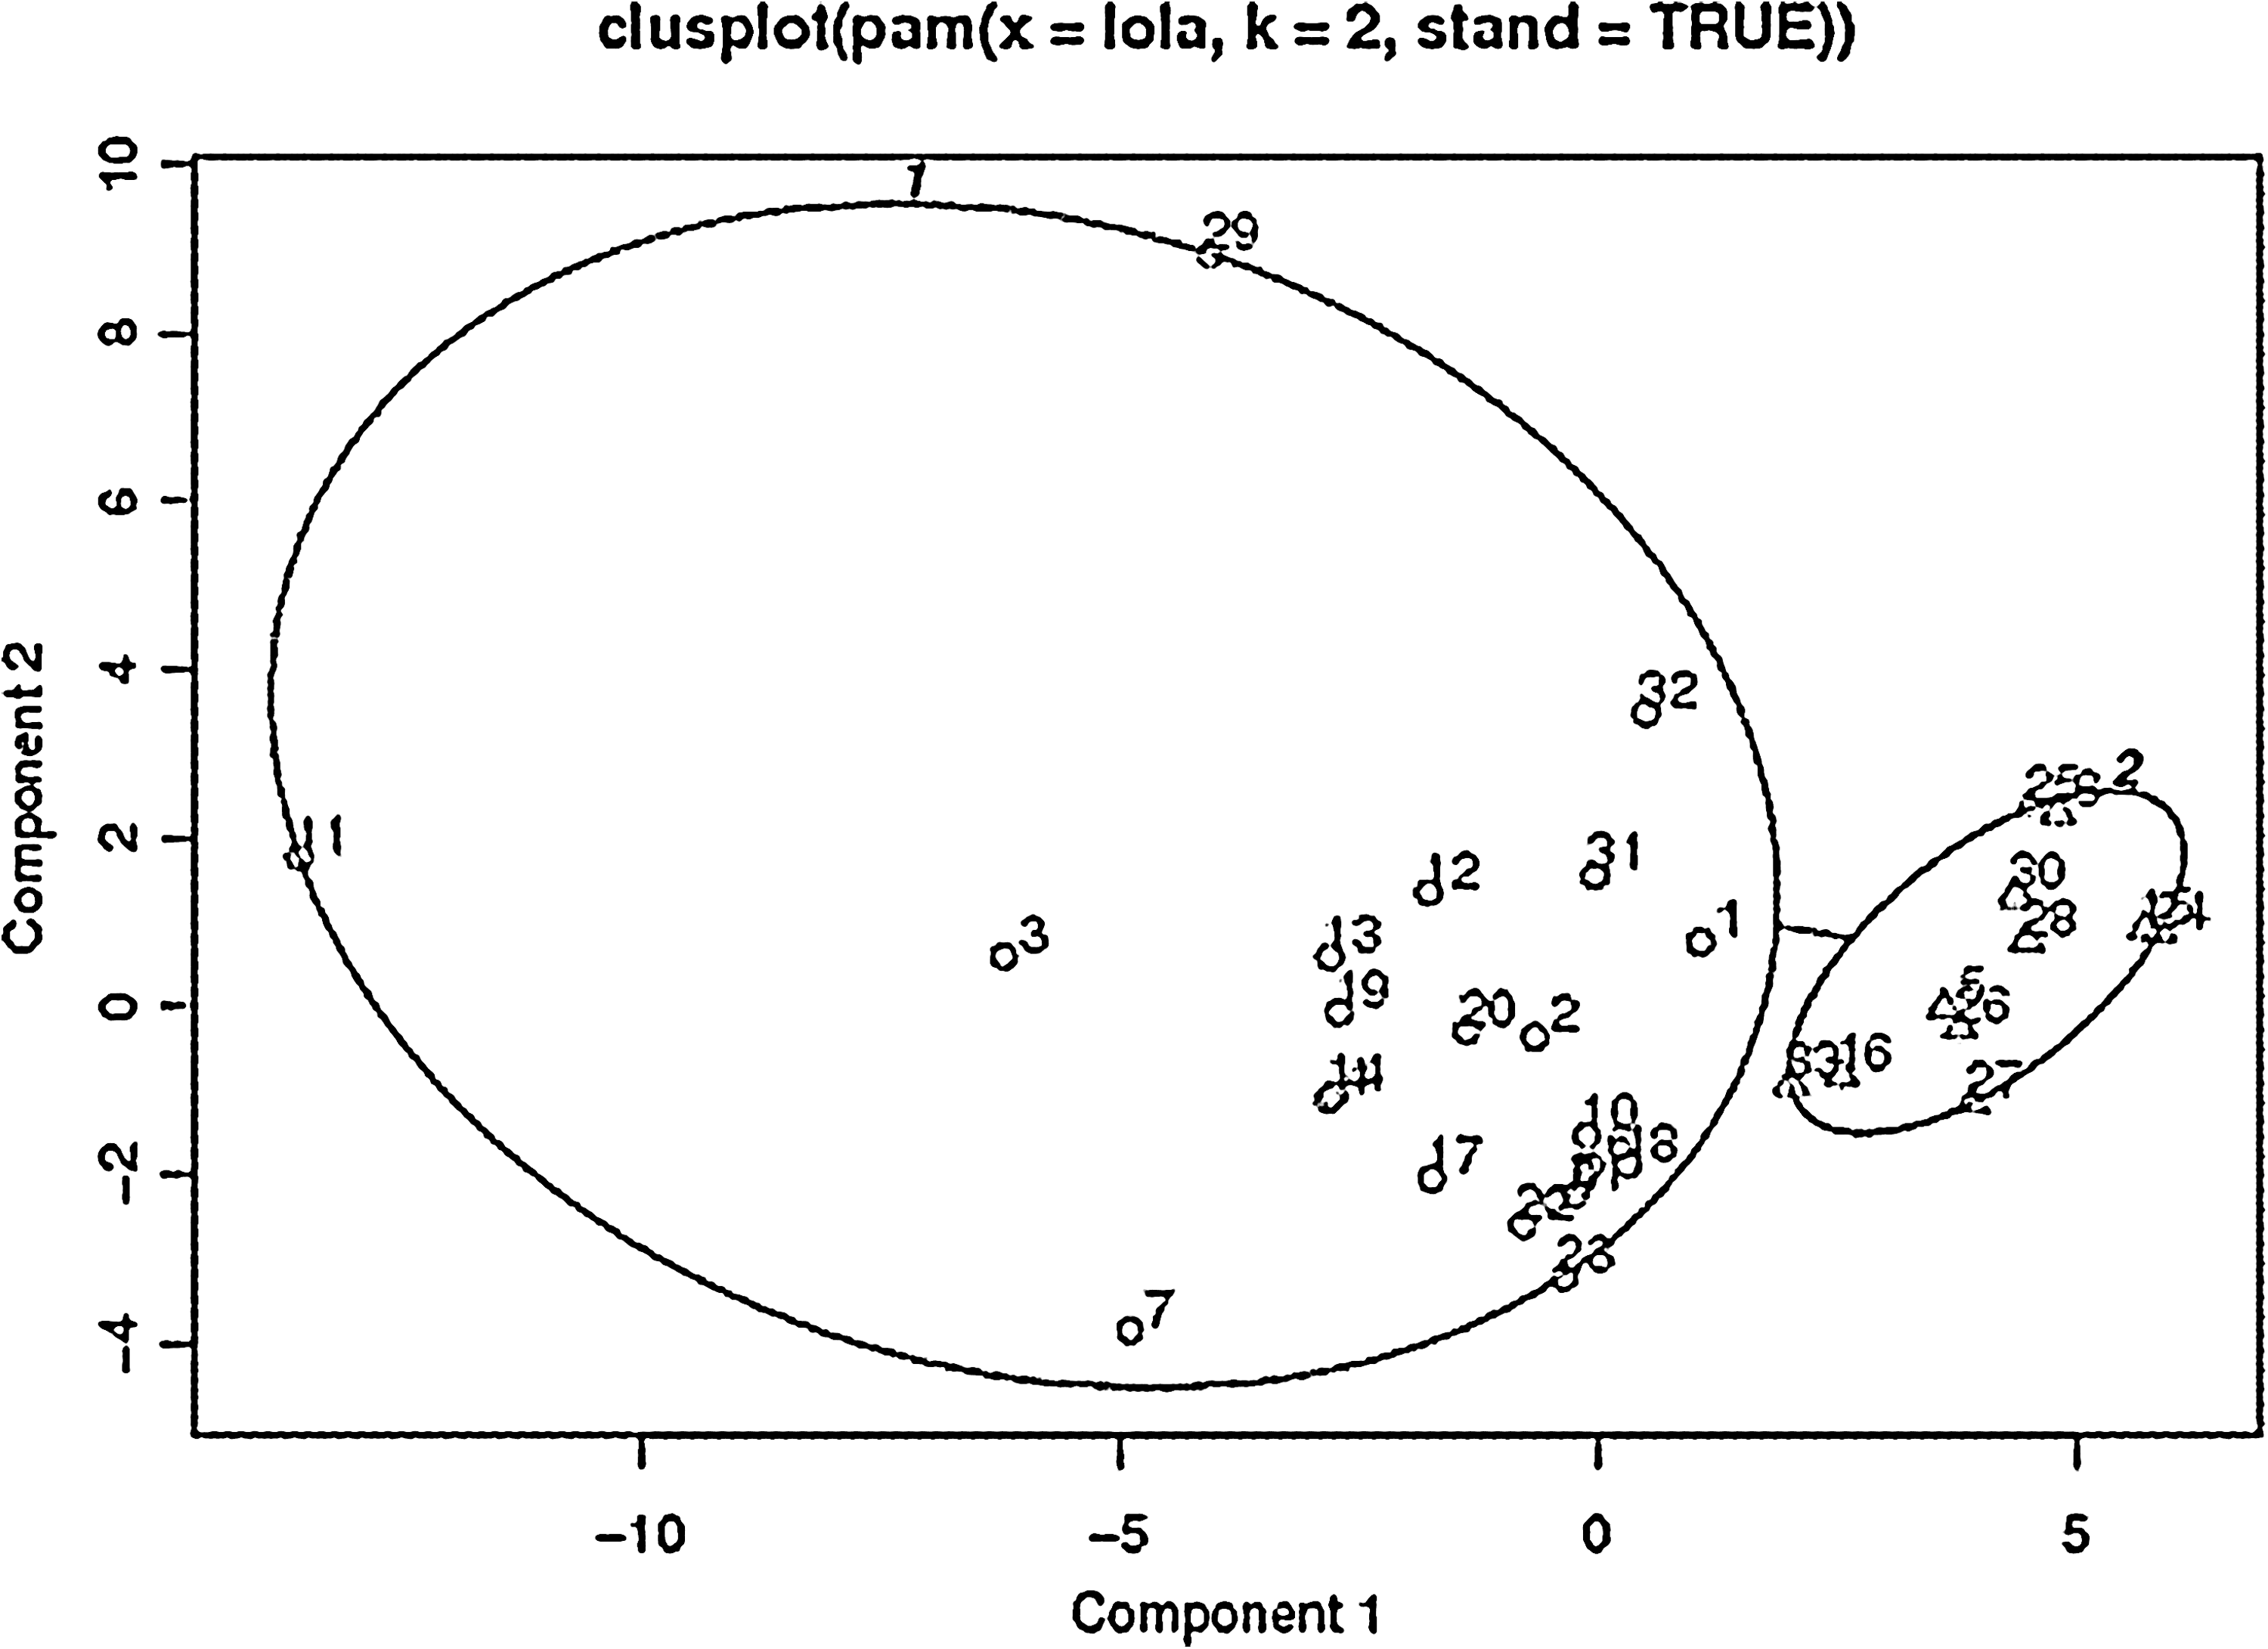
Clustering of values for individual women in the recent gestational diabetes mellitus but normotolerant postpartum group (circle 1) and in the normotolerant both during pregnancy and postpartum group (circle 2). These two components explain 86.38% of the point variability.
Glucose profiles
Glycemic levels were significantly higher in pGDM-N women than in pN-N women during the whole monitoring interval (101.4±14.2 vs. 87.5±8.7 mg/dL [5.6±0.8 vs. 4.9±0.5 mmol/L], P=0.002), and particularly during the second 24-h period (98.2±13.7 vs. 85.3±8.9 mg/dL [5.5±0.8 vs. 4.7±0.5 mmol/L], P=0.004). Moreover, variances were higher in pGDM-N women (by Fisher's test: F=1.1111, P=0.0001). The differences in blood glucose levels were particularly evident during the day: total daytime periods, 99.4±10.5 versus 89.0±9.2 mg/dL (5.5±0.6 vs. 4.9±0.5 mmol/L), P=0.005; and second daytime measurement, 101.8±11.3 versus 88.0±9.8 mg/dL (5.7±0.6 vs. 4.9±0.5 mmol/L), P=0.001 (Fig. 2a). However, nighttime blood levels did not differ significantly between the two groups: total nighttime periods, 93.0±14.2 versus 84.8±9.5 mg/dL (5.2±0.8 vs. 4.7±0.5 mmol/L), not significant; and second nighttime measurement, 95.4±12.3 versus 89.3±10.7 mg/dL (5.3±0.7 vs. 5.0±0.6 mmol/L), not significant (Fig. 2a). In particular, in the window between 3 and 6 a.m., during which all the women breastfed once and had fasted for at least 3 h, blood glucose profiles were very similar in the two groups: 88.8±12.8 versus 86.1±9.7 mg/dL (4.9±0.7 vs. 4.8±0.5 mmol/L), not significant (Fig. 2b). Moreover, mean blood glucose levels were higher during the daytime than during the nighttime in pGDM-N women (P=0.01), but not in pN-N women (Fig. 2a).

Glycemic profiles
A positive correlation was found between 24-h or nighttime blood glucose values and BMI (simple regression, P=0.02 and P=0.04, respectively) of only the pN-N group. A similar trend observed in the pGDM-N group only did not reach the level of significance. However, when we compared the normal-weight women only of both groups (pGDM-N, n=10; pN-N, n=14), blood glucose values remained significantly higher in the pGDM-N group: whole monitoring, 101.8±14.4 versus 87.1±8.8 mg/dL (5.6±0.8 vs. 4.8±0.5 mmol/L), P=0.005; second 24-h period, 96.2±14.2 versus 84.1±7.8 mg/L (5.3±0.8 vs. 4.7±0.4 mmol/L), P=0.01; total daytime periods, 101.4±11.0 versus 88.8±9.5 mg/dL (5.6±0.6 vs. 4.9±0.5 mmol/L), P=0.006; second daytime measurement, 102.6±13.2 versus 86.6±8.5 mg/dL (5.7±0.7 vs. 4.8±0.5 mmol/L), P=0.001; total nighttime periods, 95.2±14.6 versus 84.1±9.5 mg/dL (5.3±0.8 vs. 4.7±0.5 mmol/L), P=0.03; second nighttime measurement, 95.3±13.3 vs. 88.5±10.7 mg/dL (5.3±0.7 vs. 4.9±0.6 mmol/L), not significant; and 3 and 6 a.m., 92.0±14.1 versus 85.5±9.8 mg/dL (5.1±0.8 vs. 4.8±0.5 mmol/L), not significant.
Standardized events
Results of standardized events are shown in Figure 3 and Table 1.

Glucose profiles during three standardized events in women with recent gestational diabetes mellitus but normotolerant postpartum (triangles) and women who were normotolerant both during pregnancy and postpartum (squares). Significant differences between the two groups are indicated by solid symbols.
Values of P<0.05 indicate significant differences.
AUCg, glucose area under the curve; NS, not significant; pGDM-N, recent gestational diabetes mellitus but normotolerant postpartum; pN-N, normotolerant both during pregnancy and postpartum.
“Suckling”
Blood glucose levels in terms of means and point-by-point values differed significantly between the two groups both before and after the “suckling” event, whereas there were no differences between before and after the event in each group.
“Meal”
When expressed as mean values, blood glucose profiles decreased in pN-N women before the “meal” event; when expressed at each time point, they were significantly lower in the pN-N group than in the pGDM-N group before breakfast (P<0.005) and in the first 10 min (P<0.05) after breakfast. Blood glucose levels increased after the test “meal” in both groups. In particular, the highest level occurred at time point+45 min for both: 117.9±34.0 mg/dL (6.6±1.9 mmol/L) in the pGDM-N group and 99.3±27.0 mg/dL (5.5±1.5 mmol/L) in the pN-N group.
“Meal and suckling”
Mean glucose values were lower in pN-N women before this event. However, when expressed as time point by time point, there were differences from −20 min to +10 min around the event (P<0.04). After the “meal and suckling” event, blood glucose levels were significantly increased in both groups. In particular, in pGDM-N women the highest level occurred at +35 min (110.4±20.5 mg/dL [6.1±1.1 mmol/L]), whereas in pN-N women it occurred at +45 min (109.5±28.7 mg/dL [6.1±1.6 mmol/L]).
By comparison of event 2 versus event 3 we found no differences in each group for mean glucose values. When expressed time point by time point, blood glucose values were lower from +45 to 60 min after “meal and suckling” in pGDM-N women only (P<0.04).
“Normal” range of blood glucose levels in real life
Using the medoids method, we determined blood glucose levels in a homogeneous group of healthy women on the basis of 288 data point per each study subject, on Day 2 of monitoring. During daytime, blood glucose levels ranged from 53 to 126 mg/dL (from 2.9 to 7.0 mmol/L); during nighttime they ranged from 50 to 113 mg/dL (from 2.8 to 6.3 mmol/L) and from 77 to 97 mg/dL (from 4.3 to 5.4 mmol/L) between 3 and 6 a.m., without food intake. During the “suckling” event, blood glucose levels ranged from 62 to 90 mg/dL (from 3.4 to 5.0 mmol/L); the before “meal” level was 57–90 mg/dL (3.2–5.0 mmol/L), and that after the “meal” was 73–96 mg/dL (4.1–5.3 mmol/L); and finally, the before “meal and suckling” level varied from 54 to 85 mg/dL (from 3.0 to 4.7 mmol/L), and the level after it ranged from 90 to 103 mg/dL (from 5.0 to 5.7 mmol/L). The highest value recorded was 126 mg/dL (7.0 mmol/L).
In summary, during breastfeeding glucose profiles in healthy women ranged from 50 to 126 mg/dL (from 2.8 to 7.0 mmol/L), with no added effect by suckling.
Discussion
The glucose variability elsewhere shown in women with type 1 diabetes during breastfeeding 5 –7 was not found in healthy women and in women without diabetes who had had prior GDM. However, through advanced technology, we were able to get detailed and realistic assessments of glucose modifications.
The clustering method confirmed that 3 months after delivery our two groups remained distinct in terms of glucose levels and variability during the daytime only. Moreover, breastfeeding was associated with higher daytime values than nighttime values of glucose, just in “prior-GDM” women without diabetes.
The differences between the two groups were not due to BMI, as shown by the comparison of blood glucose values between pN-N and pGDM-N normal-weight women; moreover, we cannot show the behavior of blood glucose profiles in different classes of BMI because most subjects were normal weight in both groups. We speculated that the positive relationship between BMI and blood glucose levels reached the level of significance only in controls, likely because in pGDM-N women the deficit of insulin secretion/action could play a major role. 9,10
It has been reported that normotolerant women with recent GDM show both impairment in insulin secretion and action irrespective of body weight. 9 A more pronounced defect in insulin secretion seems to characterize normal-weight women, whereas a more prominent defect in insulin action is found in overweight women. 10 The latter could justify differences in blood glucose levels between groups, only visible through a sophisticated technique, such as monitoring, even though during lactation there is an improvement of insulin sensitivity and secretion. 25
The glucose levels identified, depicting 24-h, daytime, nighttime, and postprandial blood glucose profiles of healthy women, could represent the normal range of the population during breastfeeding.
Siegmund et al. 22 showed 24-h glucose mean values (93.7±9.0 mg/dL [5.2±0.5 mmol/L]) higher than those we recorded in the pN-N group and lower than in the pGDM-N group. This finding could be due to the different length of follow-up (shorter in the German study) and to the fact that they considered lactating and not lactating women as a single group.
In agreement with data reported for normal women, 8 suckling during the non-fed state did not affect glucose profiles in women with recent GDM. In addition, suckling did not affect blood glucose profiles during breakfast, although levels peaked slightly earlier in the pGDM-N group, when food was ingested closely to suckling. It should be noted that a fasting period of only 2 h, which was the shortest “food-free time” reported by the women during suckling, was not long enough to even partially deplete glycogen stores, contributing to keep stable glycemic patterns during breastfeeding in both groups.
Although these women were given dietary advice, they were essentially on an “ad lib” diet; therefore, it cannot be ruled out that differences in glycemic profiles between groups were not due to differences in quality and quantity food intake.
We assessed the range of glycemia in healthy women during breastfeeding. In particular, the continuous monitoring showed that the mother's interstitial glucose did not fall below 50 mg/dL (2.8 mmol/L), which is important reassurance. There are few data on this specific point, and it is very important in the case of type 1 diabetes where insulin-induced hypoglycemia during prolonged breastfeeding is a real danger. 7
Even if not particularly large, our sample size was adequate; it was analyzed by strong statistical methods that tend to reveal information inside data without preestablished models, regardless of the probabilistic hypothesis. 25
We did not concentrate on postpartum weight loss, which is one of the confounders affecting insulin sensitivity, 26 as the CGMS was used early after delivery, in normotolerant women, mainly normal weight, coming from the same urban area, to monitor blood glucose fluctuations in the real life of breastfeeding women, with and without previous GDM.
A long-term follow-up is needed to assess if and how these metabolic differences can anticipate a different clinical evolution.
Larger studies are necessary to confirm our results in comparison with non-lactating women and to observe the influences of cofactors such as hormonal, nutritional, or caloric variables.
Conclusions
During breastfeeding, women with a recent history of GDM, still normotolerant by OGTT 3 months after delivery, had higher daily glycemic profiles and higher variability than women who were normotolerant during pregnancy and when not pregnant.
During breastfeeding glucose profiles in healthy women ranged from 50 to 126 mg/dL (from 2.8 to 7.0 mmol/L), with no added effect by suckling.
Footnotes
Acknowledgments
The authors thank Prof. Bruno Simeone for his assistance with data management and his helpful editorial suggestions.
Author Disclosure Statement
No competing financial interests exist.