
Abstract
Background:
Skin blood flow plays an important role in maintaining the health of the skin. The development of interstitial edema may impede oxygen diffusion to the skin. The aim of this study was to evaluate the association of skin blood flow and edema and epidermal thickness in the feet of people with and without diabetic neuropathy compared with a healthy control group.
Subjects and Methods:
Eighty-seven subjects (19 people with diabetic neuropathy and foot ulceration, 35 people with diabetes but without neuropathy, and 33 healthy controls without diabetes) participated in the study. High-frequency ultrasonography was used to measure the epidermal thickness and edema in papillary skin at the big toe as reflected by the thickness of the subepidermal low echogenic band (SLEB). The capillary nutritive blood flow was measured by the use of video capillaroscopy, and skin blood flux was monitored by laser Doppler flowmetry.
Results:
There was a 7.2% increase in epidermal thickness in those with diabetes but without neuropathy and a 16.5% decrease in people with diabetic neuropathy and foot ulceration compared with the healthy controls (all P<0.05). The SLEB thickness increased in all subjects with diabetes to a greater degree in those with neuropathy and ulceration than in those without (64.7% vs. 11.8%, P<0.001). Skin blood flux was shown to be higher in the diabetes groups than in the controls (all P<0.05), but no significant differences were found in the resting nutritive capillary blood flow (P>0.05). A significant negative correlation (P=0.002, r=−0.366) was demonstrated between the SLEB and epidermal thickness at the pulp of the big toe, whereas no significant correlation was demonstrated between skin blood flow and epidermal thickness (all P>0.05).
Conclusions:
An increase in subepidermal edema was demonstrated in people with diabetic neuropathy and ulceration, which may partly contribute to reduced epidermal thickness at the pulp of the big toe. This may subsequently lead to the breaking down of skin in the diabetic foot.
Introduction
Human skin is composed of an outer thinner epidermis and an inner thicker dermis. The epidermis consists of keratin with no blood supply, and nutrition is provided by the papillary layer of the dermis. The microvascular network located in the dermal layer of the skin is composed of both nutritive capillary blood flow and thermoregulatory arteriovenous (AV) shunt flow. The glabrous (hairless) skin is mainly involved in thermoregulation, in which large numbers of AV shunts are maintained in the constricted state by sympathetic tone. In contrast, the main function of nonglabrous (hairy) skin is primarily to provide nutrition. Its regulation involves the intrinsic myogenic, sympathetic, and endothelial control. 5 In people with diabetes, especially if the disease is complicated by neuropathy, an increase in foot swelling is a commonly observed feature that precedes the development of noticeable skin lesions. However, the impact of swelling on skin thickness and on the risk of skin breakdown is unclear. Under normal circumstances, the development of distal interstitial edema is prevented by the venoarteriolar reflex by limiting the rise of capillary hydrostatic pressure during leg dependency. 6 Such a vasoconstriction reflex response is impaired in people with diabetic neuropathy and ulceration. 7 –9 The reduction or absence of effective precapillary vasoconstriction upon standing will expose the capillary bed to a high hydrostatic load, leading to edema and thickening of the capillary basement membrane. Very few studies have performed a quantitative assessment of the degree of foot swelling that occurs in a diabetic foot. It is unclear whether foot edema could lead to a change in skin thickness, a key factor contributing to foot ulceration.
Given that a rich microvascular network is located in the dermal layer of the skin, any change in skin blood flow or in the formation of interstitial edema would definitely affect the local tissue tension inside and hence the tissue properties of skin layers in response to external pressure. This is particularly true for plantar skin that is located in weight-bearing areas. Edema is an extremely important factor affecting the oxygenation of tissue in that it increases the intercellular spaces, hence causing an increase in the distance for oxygen to diffuse to the most distant cell. 10 Skin edema may lead to ulcers, but very few studies have examined the presence of edema in the skin of the diabetic foot.
Contradictory findings on morphological changes associated with diabetes in the skin of the diabetic foot have been reported. 11 –13 Some studies have found thickening of the skin and others thinning of the skin occurring in the feet of people with diabetes. A study suggested that such thickening of the skin may be due to an excessive accumulation of advanced glycosylation end-products in the collagen of the dermis. 14 We postulate that skin blood flow and edema may influence the thickness of the skin. Ultrasound technology is a commonly used technique for assessing skin morphology. 15,16 The echogenicity of the skin tissues is supposed to be inversely related to the amount of fluid contained in the ultrasound images, and the subepidermal low echogenic band (SLEB) is presumed to represent either the edema in the papillary dermis or the photodamage of the skin. 17 High-frequency ultrasonography can be used to measure skin thickness and edema in the papillary skin layer. 18,19
Skin health is reliant on an adequate perfusion of blood supply. Edema may disrupt the microcirculation system, thereby impairing the supply of nutrients to the skin. This can eventually lead to changes in skin morphology and to the breakdown of the skin. The aim of this study was to evaluate the association between skin blood flow and edema and epidermal thickness in the feet of people with and without diabetes.
Subjects and Methods
Participants
Eighty-seven subjects (35 people with diabetes but without neuropathy [DM group], 19 with diabetic neuropathy and a history or present condition of foot ulceration [DU group], and 33 healthy controls without diabetes) participated in the present study. All diabetes subjects were recruited from the diabetes clinic of a local hospital in the period of January 2009–November 2010 and had the confirmed medical diagnosis of type 2 diabetes mellitus. Diabetic peripheral neuropathy was identified using the 10-g Semmes–Weinstein monofilament (lack of feeling in at least five of the following 10 testing points: the pulp of the first, third, and fifth toes; the plantar aspects of the first, third, and fifth metatarsal heads; the plantar medial and lateral sides of the midfoot; the plantar area of the heel; and the dorsal aspect of the midfoot) and a vibration perception threshold of above 25 volts. The group with foot ulcerations all had diabetic neuropathy: they either had a history of diabetic foot ulceration below the malleoli level or were currently suffering from that condition. Healthy control subjects who had no history of diabetes or any other form of neuropathy or arterial disease were recruited from the community by convenience sampling. All of them passed the 8-h fasting glucose test. Subjects were excluded if they had peripheral vascular disease as determined by the absence of both posterior tibial and dorsalis pedis pulses and the presence or symptoms of intermittent claudication and with an ankle brachial index smaller than 0.9, unstable cardiac condition, or malignancy.
Testing was undertaken on those with a history or present condition of foot ulceration. For subjects who had no history of diabetic ulcers, the right foot was tested. If the ulcerated foot had been partially amputated or if any skin lesions were found on the measuring sites, the contralateral foot was tested. Ethical approval for the test was obtained from a local university and hospital. Written consent to participate in the test was obtained from each subject.
Measurement of the thickness of the epidermal and subepidermal low echogenic band (SLEB)
A high-frequency ultrasound scanner with a Vevo model 708 scanhead operating at a center frequency of 55 MHz (VisualSonics Inc., Toronto, ON, Canada) was used for imaging skin morphology. This frequency gives an axial resolution of 30 μm and a lateral resolution of approximately 70 μm, producing high-resolution images to a maximum depth of 8 mm. The system displays the information obtained in the form of a B-scan in a gray scale image. In total, four ultrasound biomicroscopy scans were performed on the skin of the foot being tested, at the nailfold and pulp of the big toe. After ultrasound gel was applied over the measuring sites, the Vevo model 708 probe was placed perpendicular to the surface of the skin during the capturing of the image. The pressure of the transducer on the surface of the skin was minimized to avoid compressing the surface of the skin. By using fractal geometry, quantitative data on epidermal thickness were measured by analyzing the change in the echogenicity of the ultrasound image on each sonogram. The first entry echo as shown in the sonograms corresponds to the interface between the coupling gel and surface of the skin, followed by a broad echo-rich band underneath corresponding to the epidermis. This is followed by a thin echolucent band, the so-called SLEB, corresponding to the upper dermis (Fig. 1). After the boundaries of different layers were identified, the thickness of the skin at various layers, as defined as the distance between the demarcation echo lines, was then calculated by the in-house Vevo image analysis software. The mean of the measurements for the two images obtained at each testing point was used to analyze the data.

Ultrasound images showing the epidermal and subepidermal low echogenic band (SLEB) thickness at the pulp of big toe among the study groups:
Measurement of skin blood flow
Capillary diameter and capillary blood cell velocity
Using CapiScope capillaroscopy (KK Technology, Honiton, Devon, UK), capillary blood cell velocity (in mm/s) representing skin nutritive blood flow was monitored in the nailfold of the big toe while the subjects were in a supine position. The subjects were positioned comfortably in a supine position with the foot being tested placed on the platform of a custom-made foot stand. The subjects were acclimatized for 20 min prior to the actual recording. A drop of liquid paraffin oil was applied to the testing area to maximize the translucency of the keratin layer and decrease reflection. Images were subsequently videotaped, coded, and stored using CapiScope videocapillaroscopy analysis software for an off-line analysis using a computerized, videophotometric, cross-correlation technique (KK Technology). The diameter of the capillaries and the capillary blood cell velocity were measured. Capillary blood cell velocity was recorded for 1 min in five different erythrocyte-perfused capillaries identified at the measuring sites, and the mean value was obtained for subsequent analysis.
Skin blood flux
The skin blood flux over the skin of the nailfold and the pulp of the big toe was recorded using laser Doppler flowmetry (model DRT4, Moore Instruments, Milway, Devon, UK). This instrument mainly measures the flow of blood in arteriovenous anastomoses, arterioles, and venous plexuses. 20 The measurements were carried out in a quiet environment with the room temperature controlled at 24±0.2°C. Caution was taken to minimize external disturbances. The testing sites of the skin were cleaned with alcohol prep. The laser Doppler probe was then gently applied on each of the testing sites using an adhesive pad to avoid vascular compression. The subjects were then comfortably positioned in a supine position for at least 20 min to acclimatize to the room's temperature. Baseline resting skin blood perfusion was represented in arbitrary units, calculated as a product of mean blood cell velocity and the concentration of blood cells in the recording area in terms of flux. Continuous measurements were made for 5 min in each of the measuring sites, and the averaged data obtained in the last 2 min were recorded. All of the data were stored on a computer for off-line analysis using the Moorsoft software package (Moor Instruments).
Statistical analyses
One-way analysis of variance was used to test for group differences in the demographic variables and all testing variables. When a significant group difference was detected, Hochberg's GT2 or Games–Howell post hoc multiple comparisons were performed to identify pairwise group differences. Correlations among epidermal thickness, the thickness of the SLEB, and skin blood flow were calculated using Pearson's correlation analysis. The level of significance was set at 0.05 for all measurements.
Results
Details of the demographics of the subjects are shown in Table 1. Nineteen subjects with a history or present condition of diabetic foot ulcerations (DU group) (14 males and 5 females, 63.32±12.7 years old), 35 diabetes subjects without neuropathy or ulceration (DM group) (16 males and 19 females, 65.17±9.0 years old), and 33 healthy controls without diabetes (11 males and 22 females, 69.00±4.7 years old) participated in the study. No significant differences in demographic data, diastolic blood pressure, and ankle brachial index were found among the groups. In line with the group definition, the fasting glucose was significantly higher in the diabetes groups than in the healthy controls without diabetes (P<0.001). Subjects in the DU group demonstrated a longer duration of diabetes and higher vibration perception threshold than subjects in the DM group and healthy control subjects (P<0.001). No significant difference in the glycated hemoglobin level was found between the two diabetes groups.
Data are mean±SD values.
Normal group versus both diabetes groups.
Ulcer group versus diabetes-only group.
DM, with diabetes but without neuropathy; DU, diabetic neuropathy and foot ulceration.
Epidermal thickness and edema in papillary dermal skin
The epidermal thickness of plantar skin was significantly different among the study groups at both measuring sites (Table 2). Post hoc analyses indicated that the average epidermal thickness of plantar skin was significantly thicker in the DM group and thinner in the DU group compared with the control group (Fig. 2). Specifically, epidermal thickness had decreased by 16.5% in the DU group but increased by 7.2% in the DM group compared with the healthy controls. The SLEB was observed only at the pulp of the big toe, but not at the nailfold. We demonstrated that the SLEB thickness had increased in both diabetes groups (P<0.001). Compared with the control group, a 12% increase was found in the DM group, and a 65% increase was observed in the DU group (Fig. 2). A significant negative correlation (P=0.002, r=−0.366) was demonstrated between SLEB and epidermal thickness at the pulp of the big toe (Fig. 3).
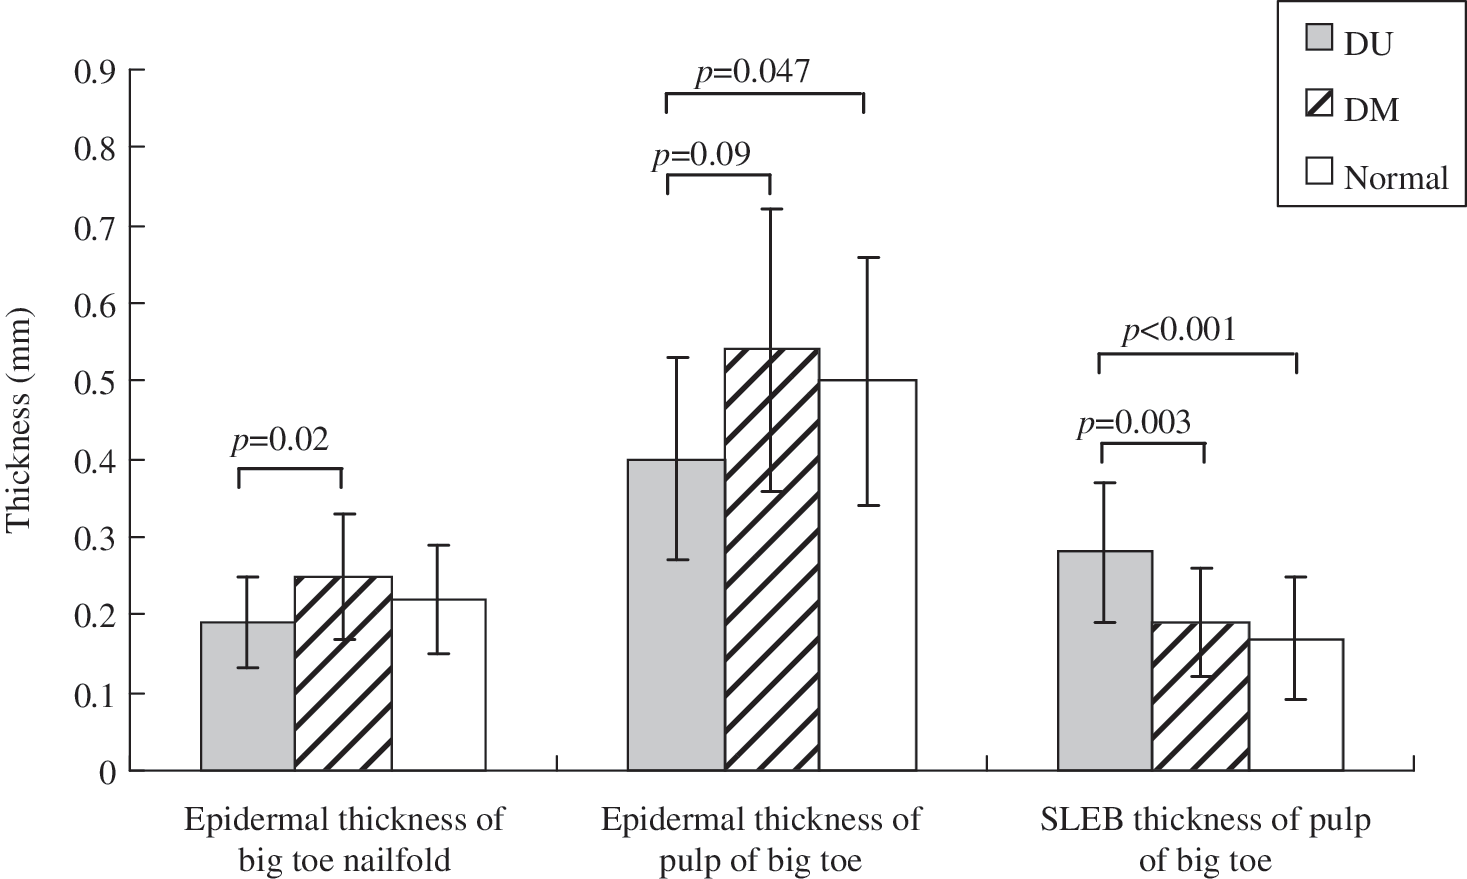
Epidermal and subepidermal low echogenic band (SLEB) thickness at different regions of the big toe in people with or without diabetes. DM, with diabetes but without neuropathy; DU, diabetic neuropathy and foot ulceration.

Correlation curve between epidermal and subepidermal low echogenic band thickness at the pulp of big toe.
Data are mean±SD values.
Diabetes-only group versus ulcer group.
Diabetes-only group versus ulcer and normal groups.
Ulcer group versus diabetes-only and normal groups.
DM, with diabetes but without neuropathy; DU, diabetic neuropathy and foot ulceration; SLEB, subepidermal low echogenic band.
Skin blood flow
At the nailfold of the big toe, the resting capillary diameter, nutritive blood flow, and skin blood flux were similar in all of the study groups (all P>0.05) (Table 3 and Figs. 4 and 5). At the pulp of the big toe, the resting skin blood flux was significantly higher in the DM group, followed by the DU group and the control group, respectively (161.08±100.51 vs. 139.46±79.23 vs. 93.53±63.26 arbitrary units, respectively, P=0.009). The skin blood flux was significantly higher at the pulp than at the nailfold. No significant correlation was demonstrated between skin blood flow and epidermal thickness (all P>0.05).
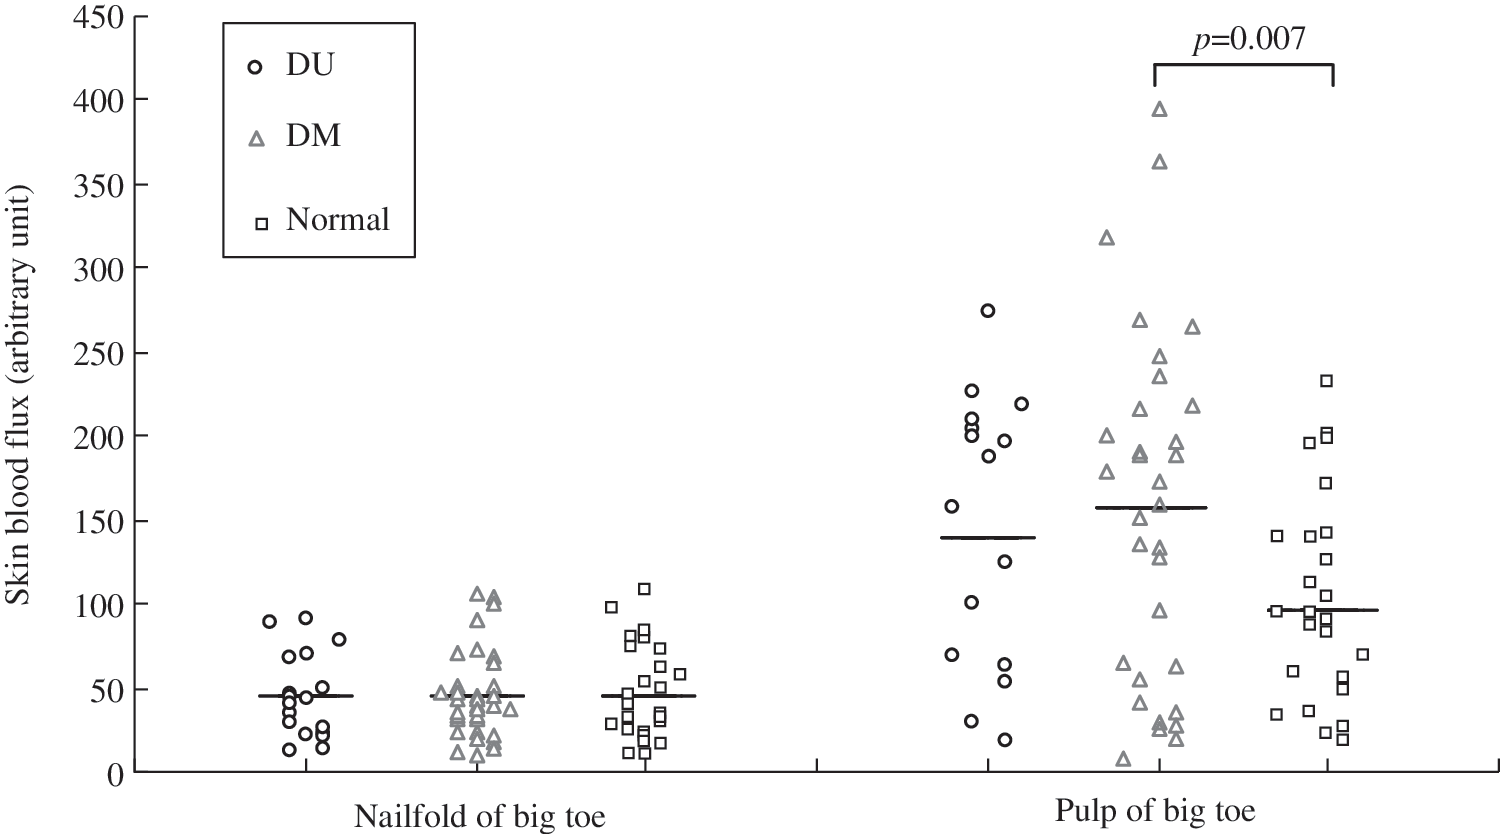
Resting skin blood flux at the nailfold and pulp of the big toe as measured by laser Doppler flowmetry. The horizontal bar represents the averaged mean value. DM, with diabetes but without neuropathy; DU, diabetic neuropathy and foot ulceration.
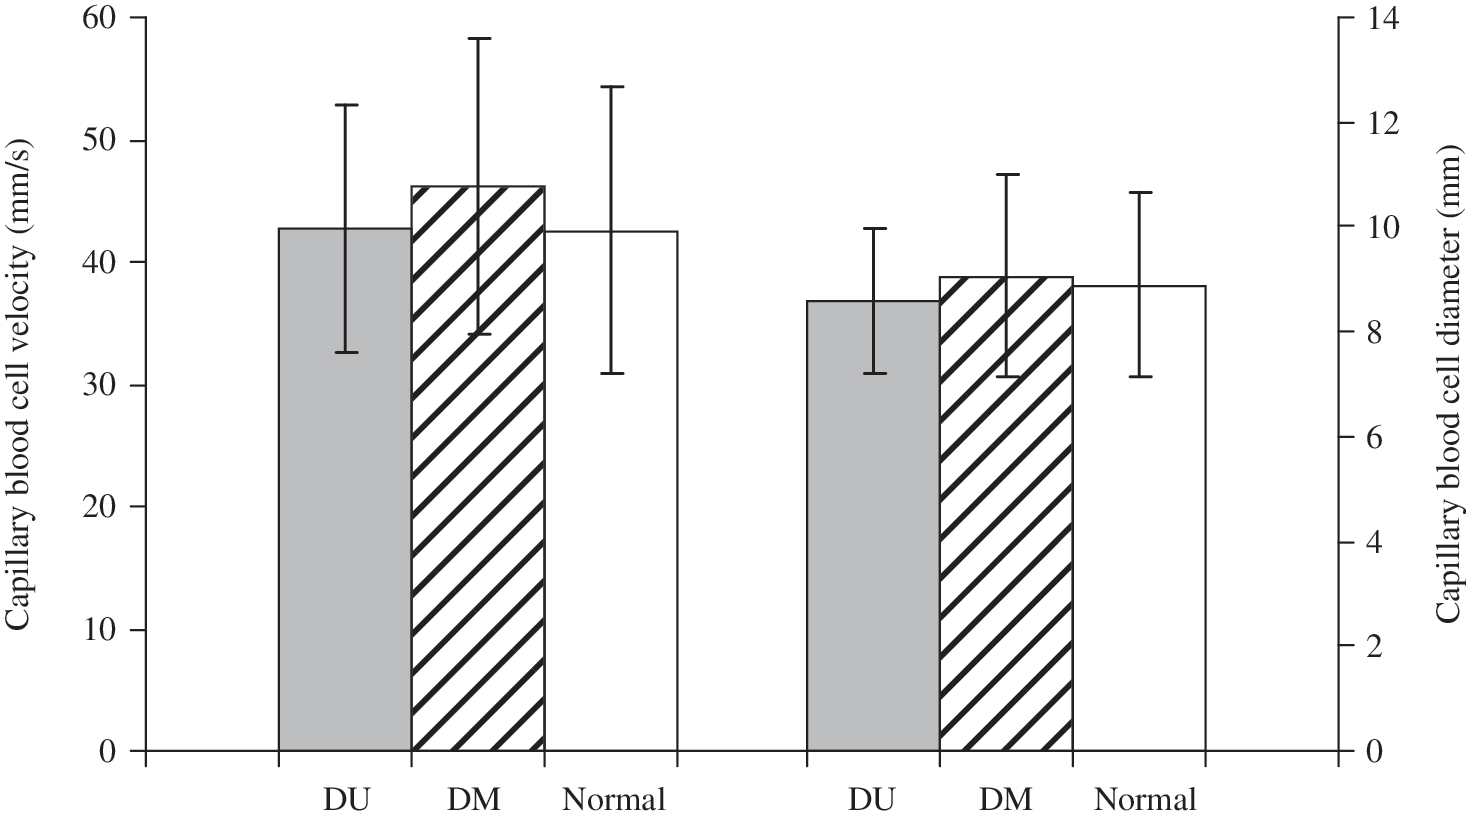
Capillary blood cell velocity and diameter at the nailfold of the big toe. DM, with diabetes but without neuropathy; DU, diabetic neuropathy and foot ulceration.
Data are mean±SD values.
Diabetes-only group versus normal group.
DM, with diabetes but without neuropathy; DU, diabetic neuropathy and foot ulceration.
Discussion
We found thickening of the epidermal layer of plantar skin in the DM group, but thinning in the DU group. In addition, there was an increase in papillary dermal edema over the pulp of the big toe, as reflected by the presence of SLEB in all subjects with diabetes but to a greater degree in those with foot ulceration. We found no difference in capillary diameter and nutritive capillary blood flow among the groups, but we observed an increase in skin blood flux in the diabetic foot. A significant negative correlation was demonstrated between the SLEB and epidermal thickness. However, we did not find any correlation between skin blood flow and the thickness of the epidermal skin.
Compared with the healthy control group, the epidermal thickness had decreased by 16.5% in the DU group but increased by 7.2% in the DM group. The epidermis is known to be a glycolytic tissue that is affected by the level of insulin in the body for regulating the migration and proliferation of keratinocytes. 21 The observed hyperproliferative state of the epidermis in the DM group is believed to be the consequence of an accumulation of advanced glycation end-products induced by hyperglycemia 22,23 or an increase in the cross-linking of collagen fibers. 24 However, we did not observe an increase in epidermal thickness in all of our subjects with diabetes. We found epidermal atrophy when diabetes is complicated by neuropathy and ulceration. Previous studies using skin biopsies have shown that the amount of epidermal nerves in patients with sensory neuropathy, such as diabetic peripheral neuropathy, is substantially lower than in normal subjects. 25 –28 Such a reduction in epidermal nerves may induce a reduction in the proliferation of keratinocyte, speed up keratinocyte differentiation, and enhance programmed cell death, hence causing epidermal thinning. 29 –31 This may partly explain the epidermal atrophy that was observed in our diabetes group with neuropathy and ulceration (the DU group). The epidermal layer of plantar skin serves as the front line in the biological barrier protecting the foot from physical wear and tear. 32 This may explain why people with diabetic neuropathy or a history of ulceration have a higher incidence of ulceration or re-ulceration. However, one should bear in mind that the present study used the 10-g monofilament test and vibration perception threshold as screening tools for neuropathy and that subjects in our DU group may have relatively severe neuropathy. Our findings might not be generalized to people with mild neuropathy.
We detected a SLEB at the pulp of big toe but not at the nailfold region. The pulp of the big toe is not an area that is subject to exposure from the sun, so the observed SLEB is not likely to have been due to ultraviolet exposure or photodamage of the skin. Instead, it may represent the degree of edema in the papillary dermis. We found an increase in SLEB thickness in all subjects with diabetes, to a greater degree in those with foot ulceration. This indicates that people with diabetes develop foot swelling, particularly those with a history or present condition of foot ulceration. In addition, a significant negative correlation was demonstrated between the SLEB and epidermal thickness, meaning that the epidermal layer becomes thinner with an increase in papillary dermal edema. Therefore, diabetes associated with subepidermal edema may have pathophysiologic consequences. The efficiency of the delivery of oxygen to the tissues depends on various factors, including the nature of the intercellular matrix, cell density, and whether the intercellular spaces are affected by edema. 10 Edema impairs skin oxygen consumption by increasing the volume of interstitial tissue, hence increasing the distance for oxygen to diffuse between capillaries and target tissues and leading to less efficient delivery of oxygen to the tissue. Therefore, the presence of edema in the subepidermal region where the capillary loops are located could significantly impair epidermal nutrition and metabolism. This ultimately leads to epidermal atrophy and predisposes the skin in a diabetic foot to breaking down. This may explain the epidermal atrophy observed in people with diabetic foot ulceration. We found that water tends to accumulate in the subepidermal papillary skin layer. This may due to be the fact that the papillary dermis is rich in collagen fibers and hence is a site for pronounced collagen damage due to the pathological changes induced by diabetes. With an increase in compactness and in the degree of the folding of the proteins, the water-binding capacity for fluid accumulation also increases. 17
Skin blood flow in patients with diabetes mellitus has been studied extensively in the last few decades. However, conflicting results have been found. The present study found no significant differences in the resting nailfold nutritive capillary blood flow and capillary diameters but a marked increase in the skin blood flux at the pulp of all people with diabetes. Laser Doppler flowmetry measures the flow of blood in both the capillaries and the AV shunts. We demonstrated that the skin blood flux was significantly higher at the pulp (glabrous skin) than in the nailfold (nonglabrous skin), as the pulp contains a large number of AV anastomoses. Houben et al. 33 also reported similar findings, namely, that the resting skin blood flux increased whereas the capillary blood cell velocity remained unchanged at the forearm in people with diabetes compared with healthy controls. However, they did not investigate the change in skin blood flow in the diabetic foot.
The present study presented an unexplored area on the association of skin blood flow and edema with epidermal thickness in diabetes and in the diabetic foot, and this subject so far has received inadequate attention. We demonstrated in the present study subepidermal edema and a reduced epidermal thickness in people with diabetic neuropathy and ulceration. Our subjects in the DU group had a longer duration of diabetes than did the DM group, which suggests that a longer history of diabetes may lead to greater impact on microangiopathy. Instead of using clinical examination scores such as the Neuropathy Disability Score 34 for screening neuropathy, the present study made use of monofilament for screening neuropathy, which can be more stringent for detecting neuropathy. Therefore, our findings may be more applicable to people with more severe diabetic neuropathy but may not be generalized to people who have mild diabetic neuropathy. Also, our sample size is relatively small. These are the limitations of the present study. Further studies should be conducted in people with diabetes who have a shorter history of the disease, with or without foot ulceration, who have different severity of neuropathy with a larger sample size.
The present study did not find any significant correlation between skin blood flow and epidermal thickness. Given that the microvascular network is located only in the dermal layer of the skin and that both an increase in skin blood flux and edema formation in a restricted volume of the papillary skin layer occurred, it is conceivable that there was a remarkable increase in local tissue tension inside the layers of the skin, especially the plantar skin, in an area subject to repetitive weight bearing during ambulation. This could further impede the skin blood flow during ambulation, ultimately affecting the health of the skin and predisposing it to breaking down and forming ulcers.
Conclusions
People with diabetes tend to have thicker epidermal skin in the foot. However, if they develop diabetic neuropathy and ulceration, epidermal thinning occurs. Our findings demonstrated that the AV shunt flow increases in all subjects with diabetes. In addition, we observed an increase in subepidermal edema in all people with diabetes, with a greater increase occurring in those whose condition was complicated by neuropathy and ulceration. This may contribute to the reduction in epidermal thickness that makes the diabetic foot prone to tissue breakdown and hence ulcer formation.
Footnotes
Acknowledgments
This project was supported by the General Research Fund provided by the Research Grants Council of the Hong Kong SAR Government (grants PolyU5128/08E and PolyU 5600/11M).
Author Disclosure Statement
No competing financial interests exist.