




Abstract
Background:
Oral hypoglycemic agents (OHAs) are usually divided into postprandial and basal drugs. As their actions are probably more complex, it is important to ascertain which factors can modulate their effects.
Subjects and Methods:
Thirty-one type 2 diabetes patients treated with metformin (glycosylated hemoglobin [HbA1c] 6.5–9%; median, 7.3%) and enrolled in two randomized controlled studies were allocated to either rosiglitazone (Group 1, n=8) or glimepiride (Group 2, n=7) and to either vildagliptin or sitagliptin (Group 3 considered as a whole, n=16). All patients were investigated using continuous glucose monitoring at baseline and after 8–12 weeks of add-on therapy. Areas under the 24-h glycemic profile curves (AUCs) were determined for assessing postprandial (AUCpp), basal (AUCb), and total (AUCtotal) hyperglycemia. After calculation of decrements in AUCs (∂AUCs) from baseline to end of treatment periods, the following contribution ratios of postprandial and basal decrements to the overall glucose decrement were determined: ∂AUCpp/∂AUCtotal and ∂AUCb/∂AUCtotal (%).
Results:
∂AUCpp/∂AUCtotal and ∂AUCb/∂AUCtotal were negatively and positively, respectively, associated (R 2=0.195, P=0.013) with baseline HbA1c. ∂AUCpp/∂AUCtotal was significantly higher (50.8±4.8%) in patients with HbA1c <7.3% than in those with HbA1c ≥7.3% (27.0±4.4%) (P=0.001). After adjustment on baseline HbA1c, ∂AUCpp/∂AUCtotal was greater in Group 3 (44.0±1.6%) than in Group 1 (32.1±4%) and 2 (37.0±3.1%) (P=0.007).
Conclusions:
Gliptins, glitazones and sulfonylureas concomitantly act on basal and postprandial glucose even though gliptins are more efficient on postprandial glucose. HbA1c appears as a reliable factor for predicting the respective decrements of these two parameters and thus for guiding the choice between the aforementioned drugs.
Introduction
Patients and Methods
Study design and patient selection criteria
Data from two similarly designed randomized trials in France enrolling adult patients with type 2 diabetes treated with metformin as first-line therapy were pooled for analysis. Both trials were industry-initiated studies (trial 1, Glaxo Smith Kline Laboratories, Marly-le-Roi, France; trial 2, Novartis Pharma, Rueil Malmaison, France). In both trials the primary end point was to assess the efficacy of an add-on drug given as second-line therapy, in patients with type 2 diabetes, who did not achieve the recommended HbA1c targets on metformin alone. The efficacy of the add-on therapy was estimated on chronic (ambient) hyperglycemia with its two components, basal and postprandial hyperglycemia. 15 This assessment was made by quantifying the changes from baseline to end point via continuous glucose monitoring (CGM), which were all centrally analyzed in a blinded fashion.
Men and women (mean age, 58.5 years; range, 26–76 years) with type 2 diabetes and inadequate glycemic control defined by HbA1c level >7% (trial 1) or 6.5% (trial 2) while taking metformin monotherapy at a stable dose ranging from 1,700 to 3,000 mg/day for at least 12 weeks were eligible for randomization provided that HbA1c was not greater than 9% or 8% (trials 1 and 2, respectively).
Trial 1 was conducted from 2005 to 2007. The 21 patients (mean age, 60.4 years; body mass index, 31.1 kg/m2) who were included in this trial (Fig. 1) were randomly allocated to either rosiglitazone or glimepiride as add-on therapy to metformin after a maximum 3-week run-in period. Rosiglitazone was initiated at a dose of 4 mg/day and increased up to 8 mg if well tolerated after an adjustment period of 8 weeks. Glimepiride was started at the lowest dose (1 mg/day) to avoid hypoglycemic episodes and titrated by a stepwise escalation at consecutive visits based on self-monitoring of blood glucose data and provided that side effects such as hypoglycemia did not restrict the dose increase. The maximum dose was set at 4 mg/day. Metformin was maintained at a constant dose of 2,000 mg/day throughout the entire study period.

Flow of patients through the studies. Patients were eligible for the final analysis of changes in areas under the 24-h glycemic profile curve (AUCs) (∂AUCs) when the three changes (total, postprandial, and basal [∂AUCtotal, ∂AUCpp, and ∂AUCb, respectively]) converged and were all negative (decrements). By contrast, all patients for whom at least one of the ∂AUCs diverged from the two others (increments instead of decrements) were excluded.
In trial 2, conducted from 2009 to 2011, 30 patients (mean age, 57.1 years; body mass index, 31.1 kg/m2) were randomized to either vildagliptin or sitagliptin as add-on therapies to an ongoing metformin treatment (at 1,700–3,000 mg/day) after a 2-week run-in period. Both DPP-4 inhibitors were given at fixed doses of 50 mg twice daily for vildagliptin or 100 mg once daily for sitagliptin throughout the entire duration of the study. Metformin was maintained unchanged during the study period.
For both trials, patients were excluded if they had (1) a history of type 1 diabetes, (2) intercurrent illness or pharmacological treatments susceptible to impair glycemic control, or (3) renal function impairment inconsistent with the use of metformin. Other exclusion criteria included pregnancy, women who planned to become pregnant during the trial period, and patients who were not on a stable diet or who planned to lose weight. The double-blind treatment period was 12 weeks for trial 1 and 8 weeks for trial 2. Both study protocols were approved by the Ethics Committee of the University Hospital of Montpellier and were in compliance with the Helsinki Declaration. 16 Written informed consent was obtained from all participants.
Clinical investigations and laboratory determinations
At baseline on metformin alone and at the end of the 8–or 12-week study period with addition of a second OHA, all patients underwent ambulatory CGM for three consecutive days by Minimed generation systems (second-generation Minimed in trial 1 and iPro2™ in trial 2) (Medtronic, Northridge, CA). The sensor was inserted on study Day 0 and removed midmorning on study Day 3. All calculations were made on study Days 1 and 2 to avoid any bias due to either insertion or removal of the sensor.
Ambient hyperglycemia defined as the total glucose exposure due to the sum of normal glucose exposure and additional hyperglycemia above normal was assessed by HbA1c levels determined by high-performance liquid chromatography 17,18 on whole blood at baseline and at the end of the follow-up period. The 24-h glycemic profiles were analyzed to assess the additional hyperglycemia above the normal glucose exposure that was defined and calculated as the areas under the 24-h glycemic profile curve (AUCs) above a baseline glucose value set at 100 mg/dL (AUCtotal). This value is the new definition of the upper limit of normal for FPG, according to the 2011 updated standards of the American Diabetes Association. 19 Both HbA1c level and additional hyperglycemia can be considered a reflection of the ambient hyperglycemia. Further calculations were performed to quantify the contribution ratios of basal and postprandial hyperglycemia to the overall additional hyperglycemia (AUCtotal). These calculations are based on the fact that AUCtotal is the sum of the postprandial (AUCpp) and basal (AUCb) hyperglycemia. AUCpp was assessed by calculating the area under the curve over a 4-h period after the beginning of each meal and above each baseline (premeal) glucose value except when either the return of glucose profiles to premeal values or the time interval between two consecutive meals were less than 4 h. 15 The basis of this calculation is first that postprandial states, with respect to hydrolysis and absorption of dietary carbohydrates, usually cover a 4-h period after the beginning of a given meal 20 and second that each premeal value is usually different from the two others. 21 Basal hyperglycemia (AUCb) was simply calculated by subtracting AUCpp from AUCtotal. Absolute decrements in AUCs from baseline to end point were further calculated as follows: ∂AUCpp=AUCpp at end point−AUCpp at baseline, ∂AUCb=AUCb at end point−AUCb at baseline, and ∂AUCtotal=AUC total at end point−AUC total at baseline. Finally, the contribution ratios of postprandial and basal decrements (∂AUCpp and ∂AUCb) to overall glucose decrement (∂AUCtotal) were calculated as the contribution ratios ∂AUCpp/∂AUCtotal and ∂AUCb/∂AUCtotal (%), respectively. For understandable reasons, these final values could only be calculated in patients with improved glycemic control, who exhibited a decrease in AUCtotal and consistent concomitant decreases in all AUCs. This selection was based on the fact that the calculation was not possible in individuals with diverging changes in AUCs. In addition, those persons with a positive increment in any of the AUCs were considered to be not perfectly compliant to either dietary measures or pharmacological treatments. Consequently, six of the 21 patients (29%) were excluded from trial 1, as well as 14 of the 30 patients (47%) from trial 2. Finally, eight patients in the rosiglitazone arm (Group 1), seven in the glimepiride arm (Group 2), 10 in the vildagliptin arm, and six in the sitagliptin arm (16 patients in the gliptin group considered as a whole, Group 3) were included for final analysis of AUC decrements (Fig. 1).
Statistical analysis
Univariate analysis was performed in the final analysis population (n=31) to determine the relationship between the contribution ratios of either postprandial or basal decrements to the overall glucose decrement (dependent variable) and the baseline HbA1c (explanatory variable). Contribution ratios of postprandial (∂AUCpp/∂AUCtotal) and basal (∂AUCb/∂AUCtotal) glucose decrements to the overall glucose decrement were compared in the three groups (by analysis of variance) before and after adjustment for baseline HbA1c. All results are given as mean±SEM values.
Results
Patient demographic and baseline characteristics
Clinical, laboratory, and CGM data of the patients (n=31) of the three groups are shown in Table 1. The median HbA1c level was 7.3% (range, 6.6–9.0%) in the overall population (n=31).
Data are mean (SEM) values.
AUCtotal, total incremental area under the 24-h glycemic profile above a baseline glucose value set at 100 mg/dL, composed of the AUCpp (incremental postprandial area) plus the AUCb (incremental basal area), while ∂AUCb=AUCb at end point – AUCb at baseline, ∂AUCpp=AUCpp at end point – AUCpp at baseline, and ∂AUCtotal=AUCtotal at end point – AUCtotal at baseline, and BMI, body mass index; CGM, continuous glucose monitoring; HbA1c, glycosylated hemoglobin.
Doses of OHAs at baseline and at the end of follow-up
As indicated in Table 1, mean (±SEM) doses of metformin before randomization were 2,290 (±150), 2,160 (±220), and 1,938 (±165) mg/day in Groups 1, 2, and 3, respectively. At the end of the study period, the mean doses of metformin were not different from those prescribed during the run-in period: 2,000 (±0), 2,000 (±0), and 1,938 (±165) mg/day in Groups 1, 2, and 3, respectively. At the end of the study period, the mean doses of add-on therapies were as follows: 8±0 mg/day for rosiglitazone (Group 1), 2±0.4 mg/day for glimepiride (Group 2), and 100±0 mg/day for vildagliptin and sitagliptin (Group 3).
Relationships between baseline HbA1c levels and the contribution ratios of either postprandial (∂AUCpp/∂AUCtotal [%]) or basal (∂AUCb/∂AUCtotal [%]) glucose decrements to the overall glucose decrement
A significant negative association was observed between ∂AUCpp/∂AUCtotal (%) and baseline HbA1c (Fig. 2a), whereas ∂AUCb/∂AUCtotal (%) was positively associated with HbA1c (Fig. 2b) (R 2 =0.195, P=0.013). When the overall population was divided into two subsets according to whether baseline HbA1c levels were strictly below or above/equal to the median HbA1c (7.3%), ∂AUCpp/∂AUCtotal was significantly higher in individuals who had an HbA1c <7.3% (n=15) than in those with an HbA1c ≥7.3% (n=16): 50.8±4.8% versus 27.0±4.4% (mean±SEM) (P=0.001).
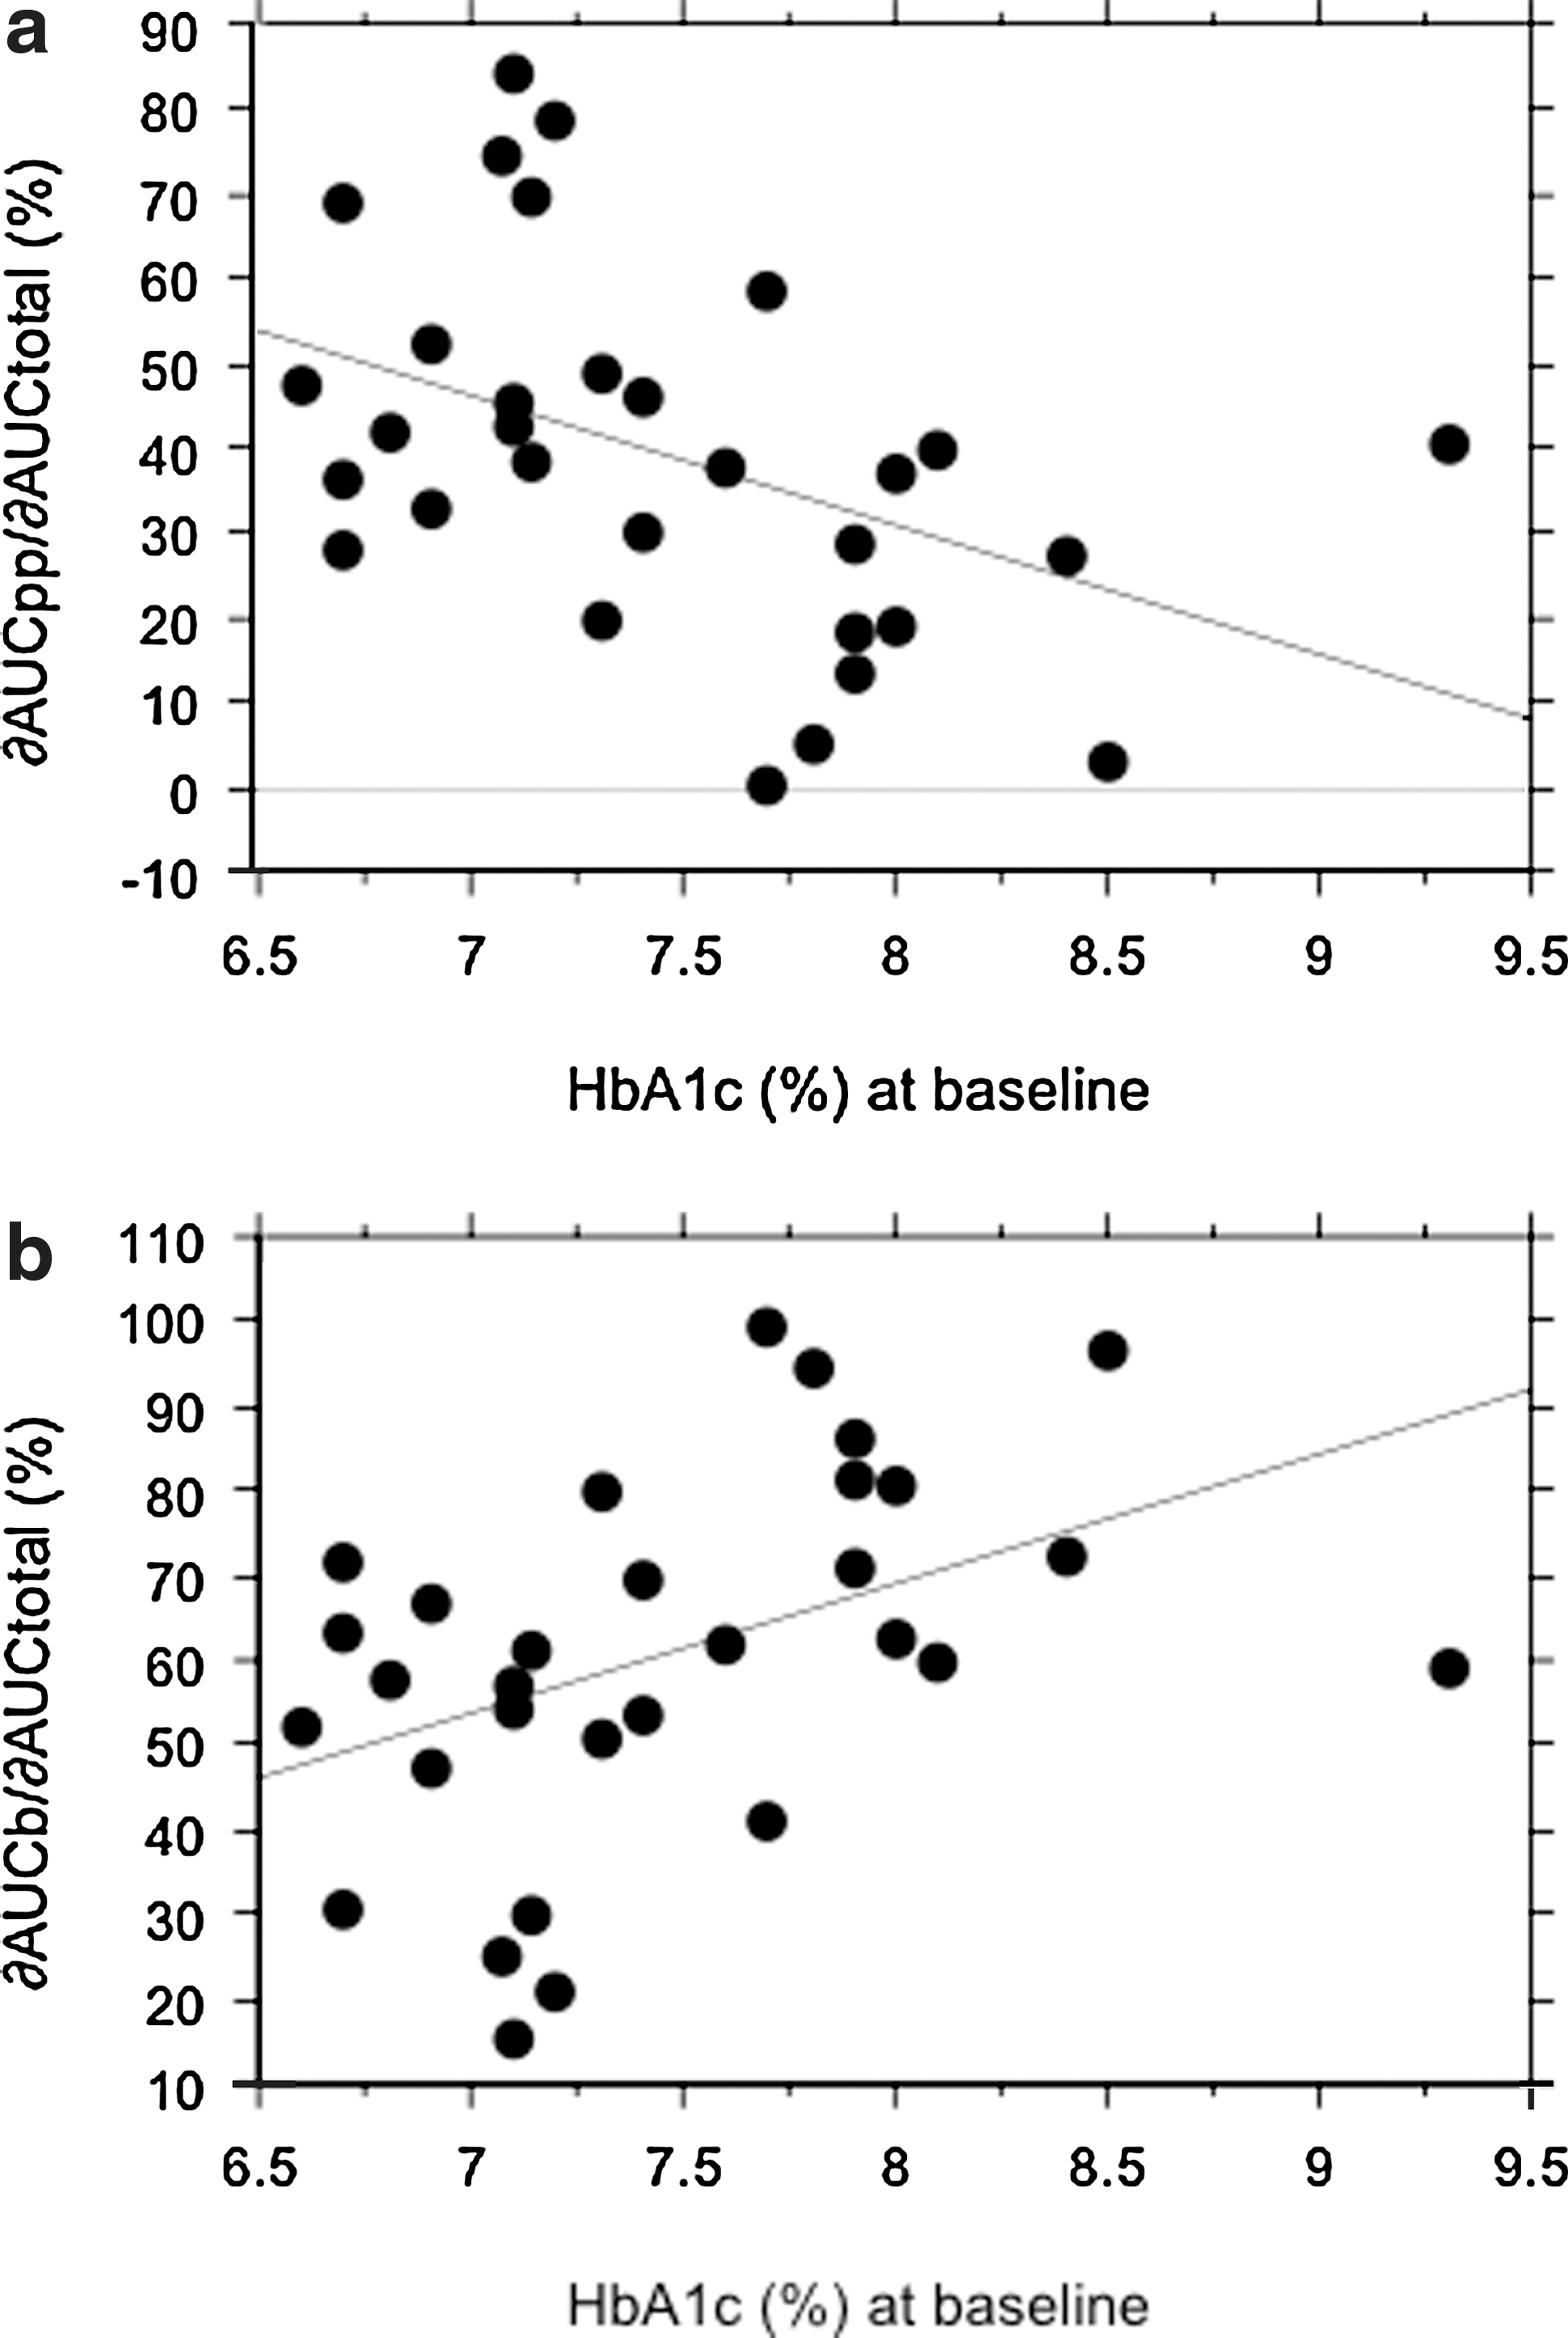
Relationship between glycosylated hemoglobin (HbA1c) levels at baseline (%) and the contribution ratios of areas under the 24-h glycemic profile curves (AUCs) for either
Contribution ratios of postprandial (∂AUCpp/∂AUCtotal [%]) and basal (∂AUCb/∂AUCtotal [%]) glucose decrements according to categories of treatment
To conduct this analysis, the contribution ratios were adjusted for baseline HbA1c to take into account that significant relationships were found between baseline HbA1c and the contribution ratios of postprandial and basal glucose decrements to the overall glucose decrement. The results after adjustment for baseline HbA1c are given in Figure 3: ∂AUCpp/∂AUCtotal was significantly greater (P=0.007) in patients treated with a gliptin (either vildagliptin or sitagliptin, Group 3) than in those treated with rosiglitazone (Group 1) or glimepiride (Group 2). An illustration of this effect is given in Figure 4, which provides the mean glycemic profiles obtained from CGM at baseline and at the end of the treatment with gliptins.
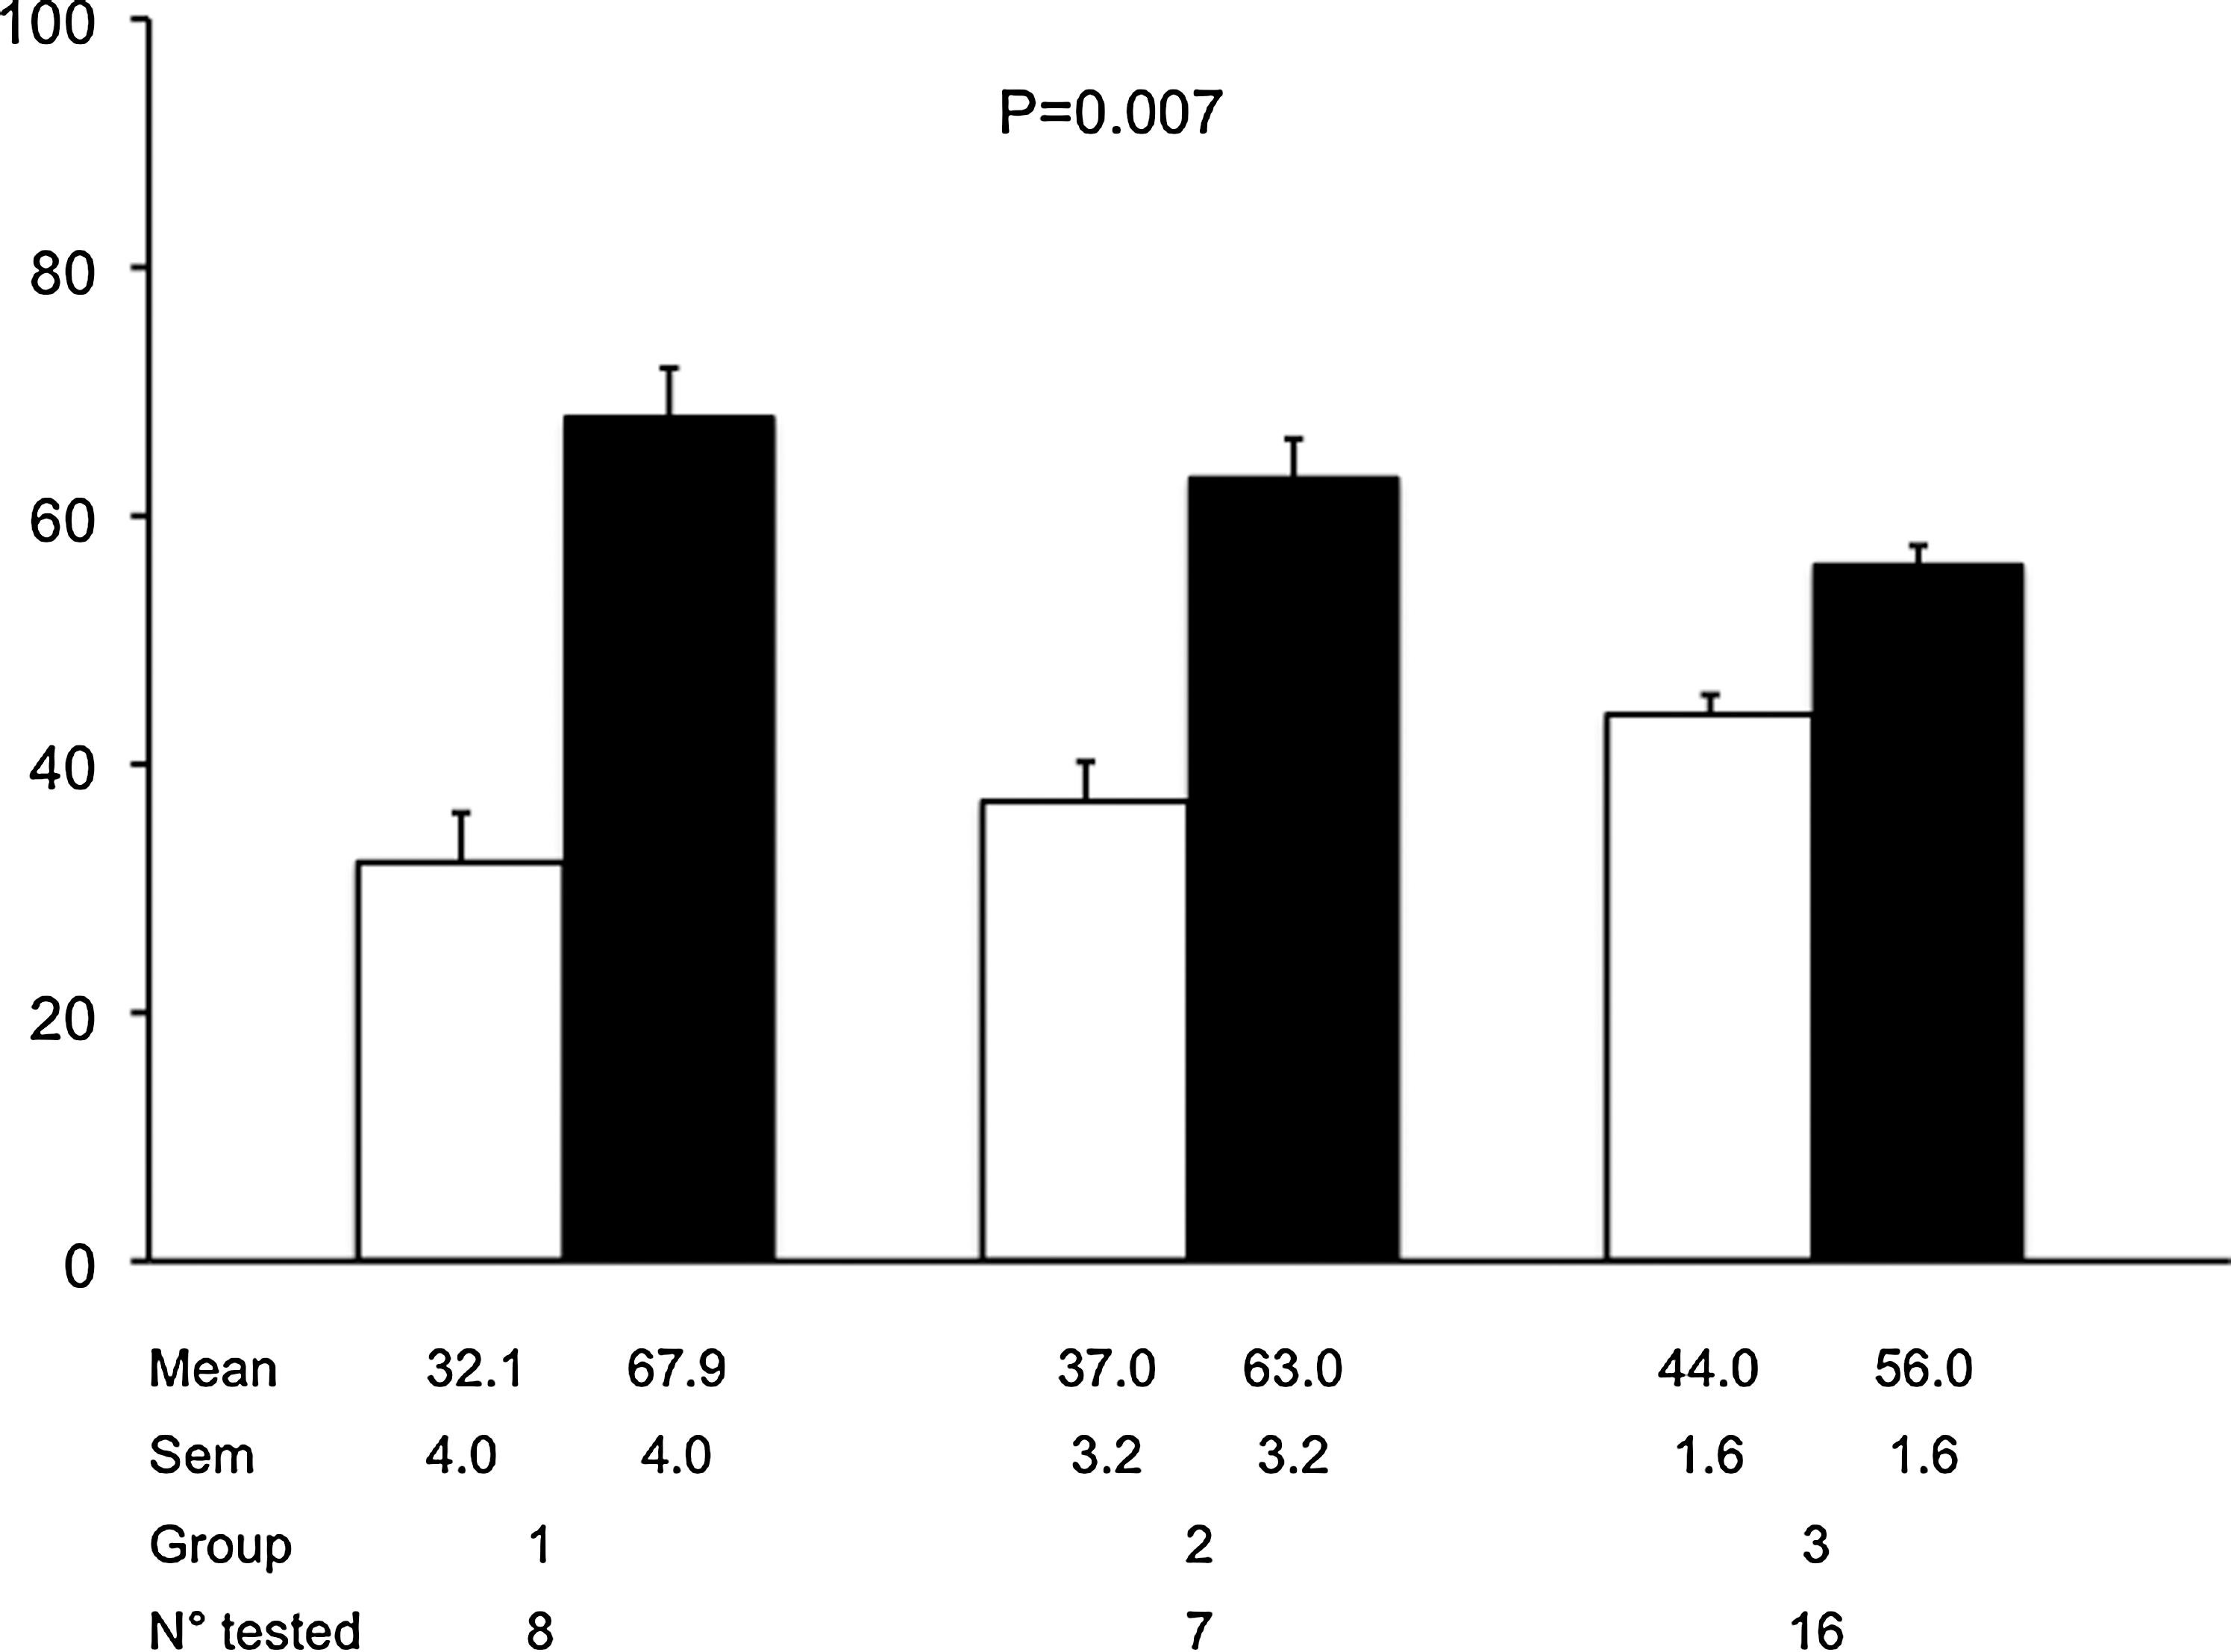
Contribution ratios of the areas under the 24-h glycemic profile curves (AUCs) for postprandial (∂AUCpp/∂AUCtotal [%]; white bars) and basal (∂AUCb/∂AUCtotal [%]; black bars) glucose decrements to the overall glucose decrement in the different groups. Data are mean±SEM values. All data were adjusted for baseline glycosylated hemoglobin. Statistical comparisons among Groups 1, 2, and 3 were made using analysis of variance. Groups 1, 2, and 3 correspond to patients for whom the add-on therapies to metformin are rosiglitazone, glimepiride, and gliptins, respectively.
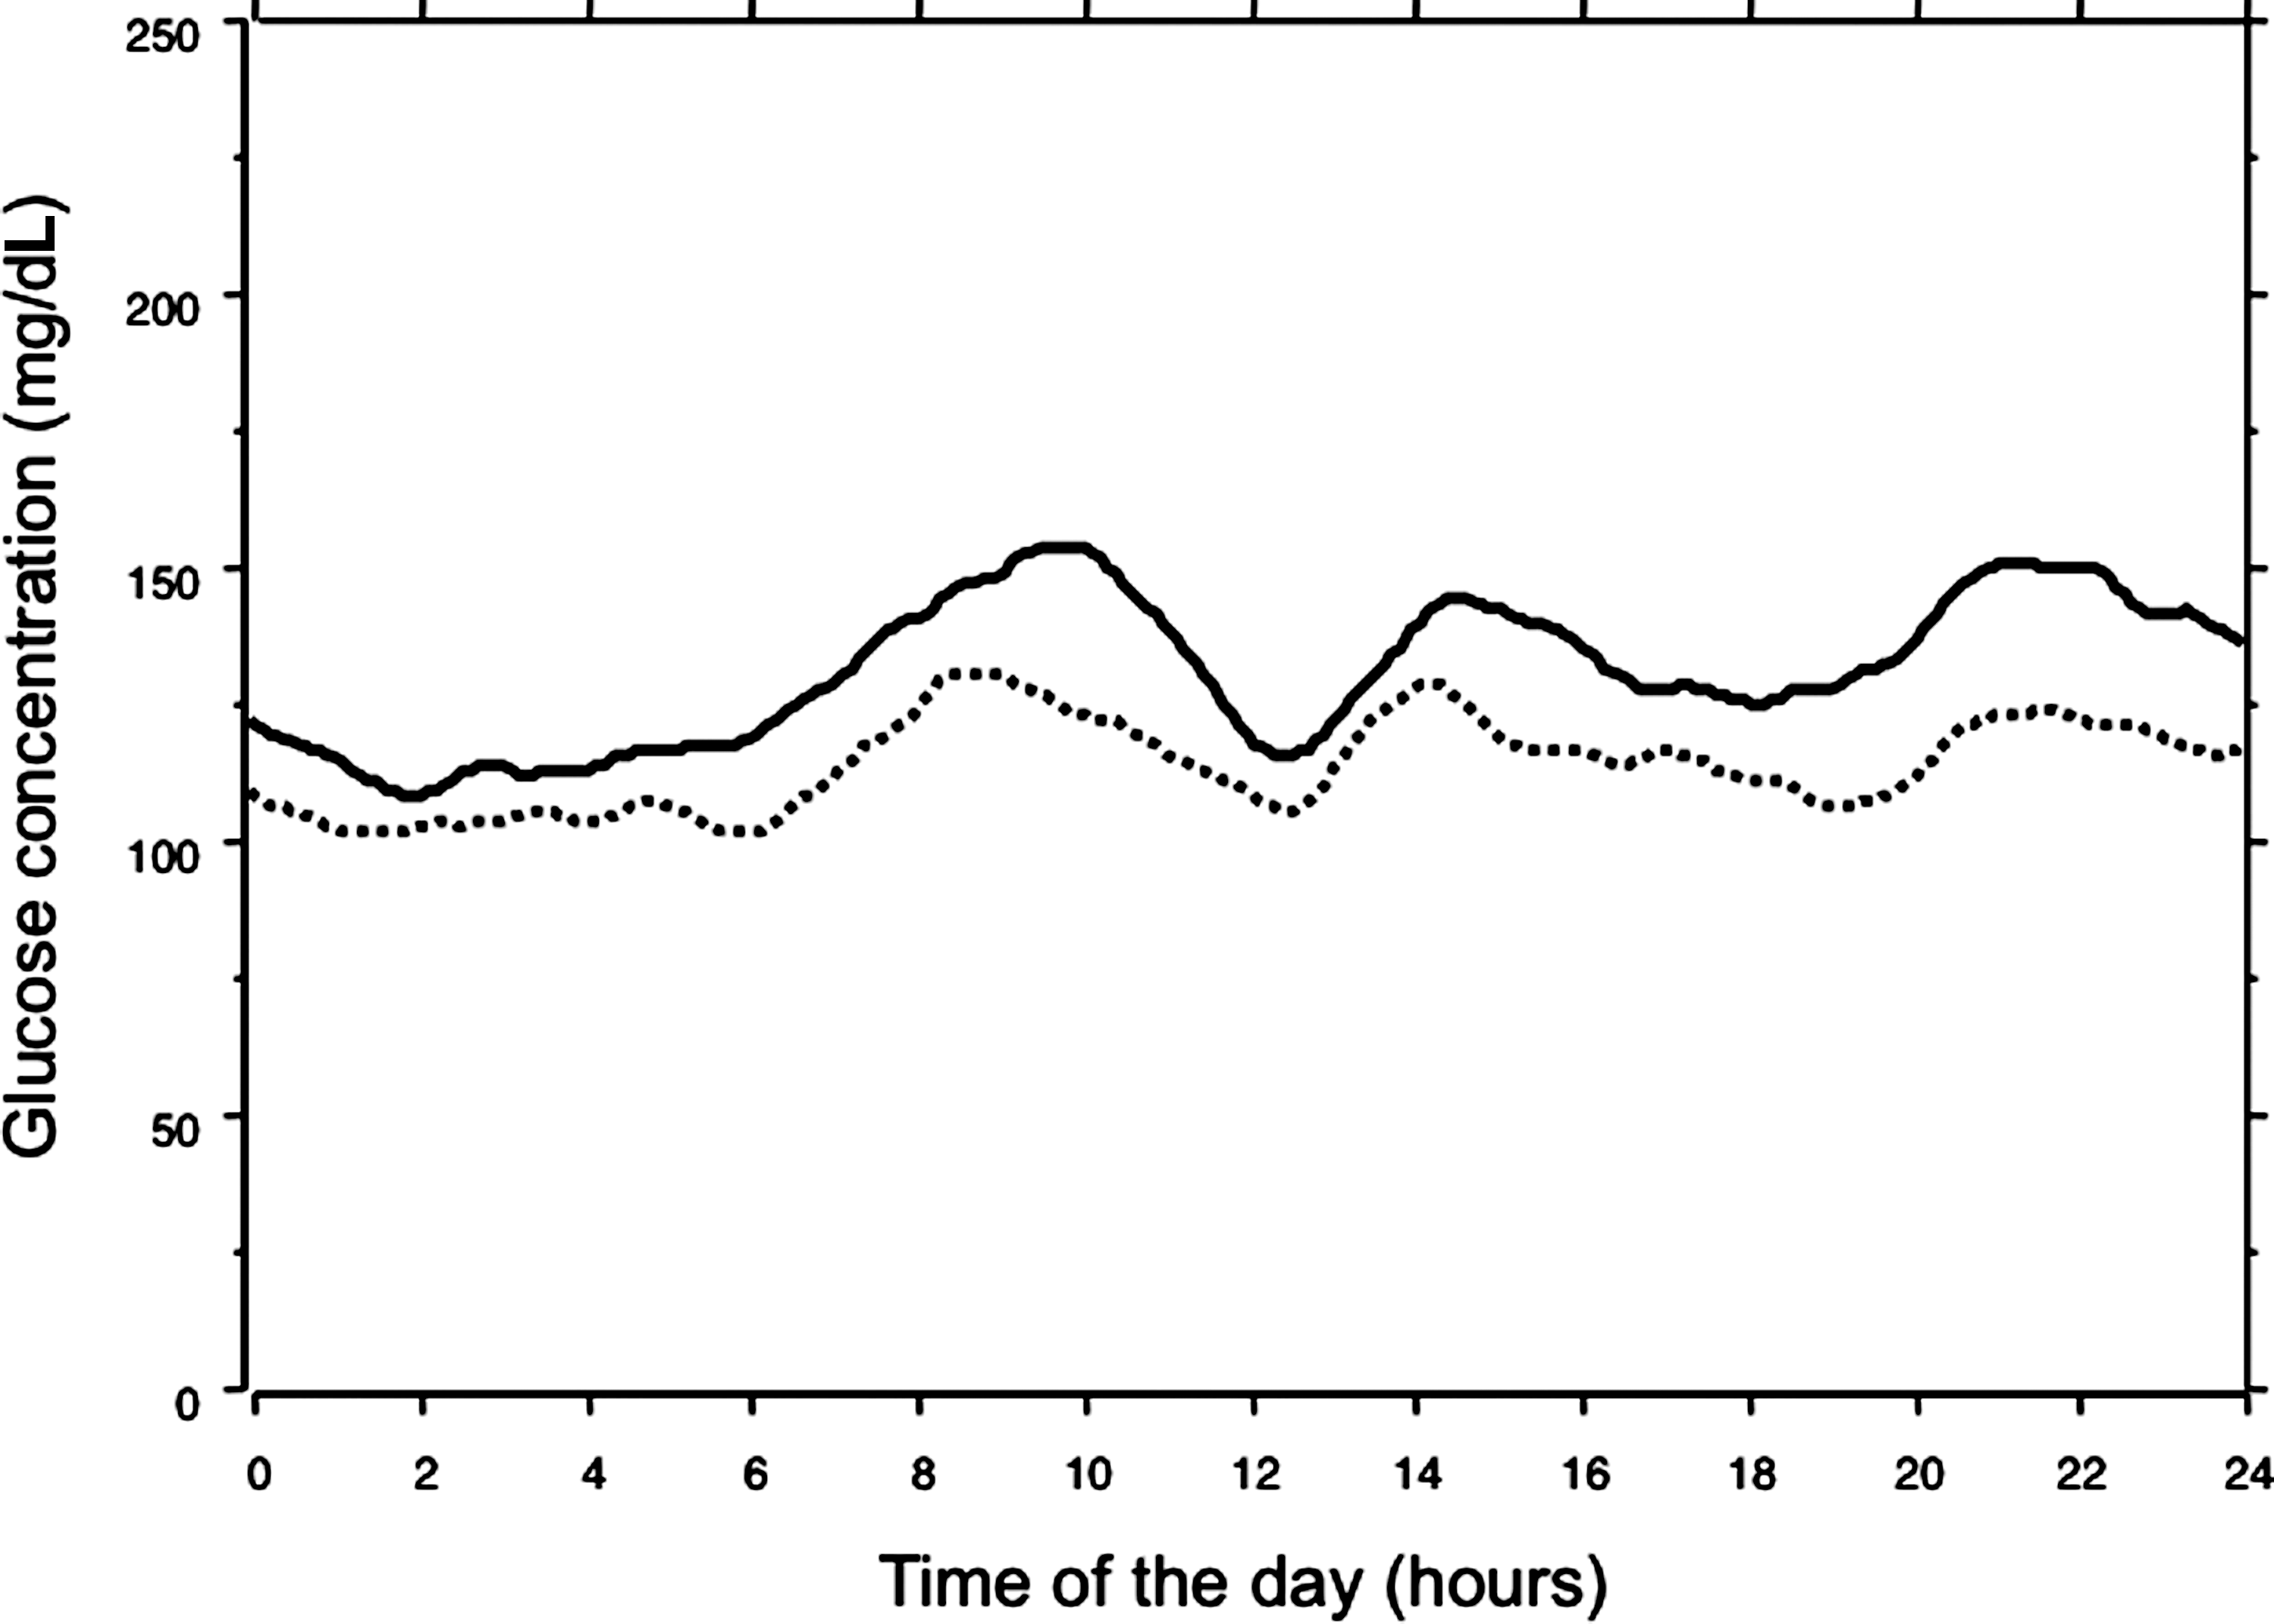
Mean glycemic profiles in the 16 patients of Group 3 treated on add-on therapy with either sitagliptin or vildagliptin after all exclusion criteria had been applied. Solid line, before the add-on therapy. Dotted line, at the end of the add-on therapy.
Safety
Episodes of asymptomatic hypoglycemia were defined as an interstitial concentration <56 mg/dL based on three consecutive 5-min recording time points during the CGM. 22 Two, two, and five episodes were recorded in the rosiglitazone, glimepiride, and gliptin groups, respectively.
Discussion
Three main conclusions can be drawn from the present data. First, OHAs such as DPP-4 inhibitors, sulfonylureas, and glitazones exert a dual effect upon postprandial and basal hyperglycemia when added to an ongoing metformin therapy. Second, in the overall study population, HbA1c levels at baseline are negatively correlated with the relative contribution of postprandial glucose decrements. This result is in agreement with the higher contribution ratio of postprandial glucose decrement to the overall glucose decrement observed in patients exhibiting mild failure to metformin at baseline (HbA1c <7.3%) than in those exhibiting a more marked failure (HbA1c ≥7.3%). It is interesting that this median value of 7.3% observed in the present work happens to be the same as the threshold below which the postprandial hyperglycemia becomes the major contributor (70%) to the overall hyperglycemia as previously reported. 8 Third, DPP4-inhibitors are more effective than glitazones and sulfonylureas in reducing postprandial glucose for the same level of glucose control (HbA1c) as the contribution ratio of postprandial glucose decrement to the overall glucose decrement (∂AUCpp/∂AUCtotal) was found to be greater in gliptin-treated patients than in those who were treated with either rosiglitazone or glimepiride.
All these observations outline the difficulties to define the algorithm for choosing the more appropriate OHA among those proposed as second-line therapy in patients who fail to achieve a satisfactory glycemic control on metformin alone. According to our results, it seems that the choice could be easily based on HbA1c levels even though other parameters can be used in the decision-making process. At present the guidelines and algorithms that are usually recommended for choosing the most appropriate interventions remain relatively complex. 23 For instance, the two tiers of preferred agents proposed by the consensus statement of the American Diabetes Association and the European Association for the Study of Diabetes do not seem to be sufficiently helpful for clarifying which OHA to use among glitazones, 23 sulfonylureas, 23 and DPP-4 inhibitors. 24,25
Reverting to the pathogenesis of glycemic disorders in type 2 diabetes, the choice can be made by using two options. First, the choice of an insulin sensitizer versus an insulin secretagogue can be based on the expected contribution of the insulin resistance compared with the endogenous insulin secretory deficiency. This choice usually depends on either the patient's body weight or the crude estimation of the duration of the disease because it has been demonstrated that the residual insulin secretion is subject to a progressive but steady decline along the diabetes continuum. 26 The alternative methods that could be used for the assessment of both insulin sensitivity and secretion are generally too difficult to implement (the euglycemic hyperinsulinemic clamp 27 ) or not sufficiently reliable at an individual level (homeostasis model assessment 28 ) to be routinely used in clinical practice. Using the second option, the choice can be made between a medication aimed at preferentially reducing either the basal or postprandial hyperglycemia. Previous observational studies 8,9 have reported that postprandial glucose is the major contributor to overall hyperglycemia in patients who have a relatively satisfactory glycemic control, whereas basal hyperglycemia becomes more predominant with poorer glycemic control. Such observations could be of interest in clinical practice. For instance, when metformin alone fails to reduce HbA1c below a threshold of between 7.5% and 8.0%, it seems more appropriate to introduce an add-on therapy of either a DPP-4 inhibitor 10 –12 or to a lesser degree an α-glucosidase inhibitor, 29 with both categories of drugs being normally and preferentially aimed at reducing postprandial glucose. In contrast, patients on metformin alone with an HbA1c above this threshold could be administered an add-on therapy of a sulfonylurea 14 or a glitazone 13 that exerts its main effect on basal glucose. This position is supported by the results of the present study, which indicate that DPP-4 inhibitors have more effect on postprandial hyperglycemia compared with either rosiglitazone or glimepiride. Furthermore, our data show that the relative contribution to postprandial glucose reduction of all treatments, independent of the pharmacological agent and its mechanism of action, is greater (more than 50%) when HbA1c is lower than 7.3% but accessory (less than 30%) in patients with an HbA1c above this threshold.
In summary, in the case of mild metformin failure, an OHA such as a DPP-4 inhibitor that stimulates insulin secretion in a glucose-dependent manner should be recommended to prevent excessive postmeal glucose excursions 10 –12 and reduce the risk of hypoglycemia, which is higher in patients with a lower HbA1c. 30 At this stage of the disease, the mean lowering effect of DPP-4 inhibitors is between approximately −0.6% and −0.9% of HbA1c, a value that still permits the target to be reached (<6.5% or 7%). In contrast, in patients with a more marked failure and who exhibit HbA1c levels greater than 8.0%, either a glitazone or a potent insulin secretagogue such as a sulfonylurea that acts mainly on basal hyperglycemia could be more appropriate.
In conclusion, HbA1c appears to be a reliable marker for predicting the respective decrements of either basal or prandial hyperglycemia after addition of a new drug in type 2 diabetes patients with secondary failure to metformin. This might be helpful to guide the choice of the second-line therapy, which should be personalized rather than being arbitrarily chosen among several possible options. 23,31,32 Furthermore, despite the small size of each study group and the limitation due to the fact that the patients were enrolled in two separate randomized trials, our results suggest that, when HbA1c is mildly or moderately altered, a DPP-4 inhibitor is more effective on postprandial glucose than sulfonylureas and glitazones, even though all these drugs exert a dual effect on postprandial and basal glucose.
Footnotes
Acknowledgments
This study was supported by funds provided by Novartis Pharma and GSK Laboratories. However, the authors declare that they are fully responsible for all content of this article and that they did not receive any additional financial support from Novartis Pharma and GSK Laboratories than those related to the development of this article. In addition, the authors gratefully acknowledge Drs. Hafid Belhadj-Tahar (Toulouse), Catherine Boegner (Montpellier), Bruno Guerci (Nancy), Dominique Huet (Paris), Marie-Françoise Gras-Vidal (Montpellier), Catherine Petit (Corbeil Essones), Denis Raccah (Marseille), Jean Ségalas (Béziers), Pierre Serusclat (Venissieu), and Paul Valensi (Paris), who participated in the inclusion and follow-up of the patients.
Author Disclosure Statement
L.M. and C.C. declare no conflict of interest with the content of this article. A.C. and D.V. are or were employees of GSK Laboratories. S.D. is an employee of Novartis Pharma. L.M. contributed to the design of the studies and wrote the manuscript. C.C. contributed to the analysis of data and reviewed the manuscript. A.C., D.V., and S.D. contributed to the design of the studies and reviewed the manuscript.