
Abstract
Background:
We present a pilot study on the feasibility of the application and advantages of online, noninvasive breath gas analysis (BGA) by proton transfer reaction quadrupole mass spectrometry for the screening of gestational diabetes mellitus (GDM) in 52 pregnant women by means of an oral glucose tolerance test (OGTT).
Subjects and Methods:
We collected and identified samples of end-tidal breath gas from patients during OGTT. Time evolution parameters of challenge-responsive volatile organic compounds (VOCs) in human breath gas were estimated. Multivariate analysis of variance and permutation analysis were used to assess feasibility of BGA as a diagnostic tool for GDM.
Results:
Standard OGTT diagnosis identified pregnant women as having GDM (n=8), impaired glucose tolerance (n=12), and normal glucose tolerance (n=32); a part of this latter group was further subdivided into a “marginal” group (n=9) because of a marginal high 1-h or 2-h OGTT value. We observed that OGTT diagnosis (four metabolic groups) could be mapped into breath gas data. The time evolution of oxidation products of glucose and lipids, acetone metabolites, and thiols in breath gas after a glucose challenge was correlated with GDM diagnosis (P=0.035). Furthermore, basal (fasting) values of dimethyl sulfide and values of methanol in breath gas were inversely correlated with phenotype characteristics such as homeostasis model assessment of insulin resistance index (R=−0.538; P=0.0002, P corrected=0.0034) and pregestational body mass index (R=−0.433; P=0.0013, P corrected=0.022).
Conclusions:
Noninvasive BGA in challenge response studies was successfully applied to GDM diagnosis and offered an insight into metabolic pathways involved. We propose a new approach to the identification of diagnosis thresholds for GDM screening.
Introduction
The aims of our study were to demonstrate the feasibility and diagnostic possibility of BGA in GDM screening and to identify breath-based GDM characteristics with a focus on early detection and prevention. To these ends, we analyzed the properties of breath gas data collected during OGTTs in 52 consecutive women undergoing GDM screening and related them to standard OGTT-based diagnosis. Furthermore, we analyzed the VOCs in relation to phenotype characteristics of the pregnant women such as pregestational body mass index (BMI) or insulin resistance (homeostasis model assessment of insulin resistance [HOMA-IR]).
Subjects and Methods
Study design
We conducted GDM screening by means of a 75-g glucose OGTT over a 120-min period according to guidelines of the German Diabetes Association. 17 Women were considered to have GDM if two of three capillary blood glucose values exceeded the following limits: >90 mg/dL (fasting) before OGTT, >180 mg/dL after 60 min, and >155 mg/dL after 120 min. Exceeding one of these values was defined as impaired glucose tolerance (IGT). The study was performed on 52 pregnant women referred to our outpatient clinic for GDM screening in 2010 because they were identified to be at increased risk for GDM by their gynecologist or general practitioner and had consented to participate in the BGA study. All women were tested negative for islet autoantibodies (glutamic acid decarboxylase antibodies, insulinoma antigen 2 antibodies, and ZnT8A). Weight, height, and BMI were recorded, and venous blood samples were collected to measure lipids and glycosylated hemoglobin (HbA1c) and fasting and postchallenge insulin. Fasting blood glucose was determined locally by the laboratory at the outpatient department. Fasting insulin was determined using the Mercodia (Uppsala, Sweden) ultrasensitive insulin enzyme-linked immunosorbent assay, a solid-phase two-site enzyme immunosorbent assay, as described in the manufacturer's instructions. Insulin resistance was estimated by HOMA-IR. 18
HbA1c was measured by high-performance liquid chromatography using the Bio-Rad (Hercules, CA) hemoglobin testing system. Glucose, low-density lipoprotein, high-density lipoprotein, and triglycerides were determined by photometry using the Roche Hitachi Cobas Mira Plus system (Roche Diagnostics, Mannheim, Germany). Fasting and stimulated insulin were determined using an automated immunoassay analyzer (model AIA 360; Tosoh, San Francisco, CA).
We performed BGA by means of a standard proton transfer reaction quadrupole mass spectrometry (PTR-MS) device (Ionicon GmbH, Innsbruck, Austria) 19 with a typical count rate for H3O+ precursor ions of at least 3 million. PTR-MS has a response time of only 100 ms and is therefore suited to online scans and tracking of multiple breath gas signals (ion counts). Sample donors breathed at 6–10-min intervals in a buffered end-tidal sampler (Ionicon GmbH) connected to the PTR-MS device with a heated flexible tube. This set-up allowed the controlled measurement of end-tidal breath fraction, 20,21 but free tidal breathing still underestimated the alveolar concentration of highly soluble, bloodborne VOCs. 22 The dynamics of low and highly soluble bloodborne VOCs have been thoroughly studied by King et al. 22 –24 The relative ease of BGA sampling enabled effortless integration of the acquisition of breath gas samples and blood samples required by the standard OGTT. We measured a broad spectrum of 142 signals (mass-to-charge [m/z] ratio from 18 to 174).
All clinical investigation concerning this study was conducted according to the principles of the Declaration of Helsinki, under ethical authorization of the relevant review boards (Technical University Munich, Munich, Germany, Ethical Commission Number 1522/06, 2009), and with patients' written consent.
Data analysis and statistics
VOC signals (m/z) were categorized into signals that changed after the 75-g glucose challenge and into signals that remained unchanged (Fig. 1). Only the responsive signals (n=55) were subsequently further considered for the analysis. Two response patterns were observed between time 0 min and 120 min of the OGTT: a peaked, impulsive response (“kinetic”; 19 signals) and a linear change response (“linear”; eight signals) (Fig. 1) (examples are shown in Fig. 2). The remaining responsive signals were badly fitted by the two models proposed and therefore discarded. For each type of VOC response curve (kinetic or linear), signals were fitted to mathematical functions derived from chemical reaction models: either the kinetic function
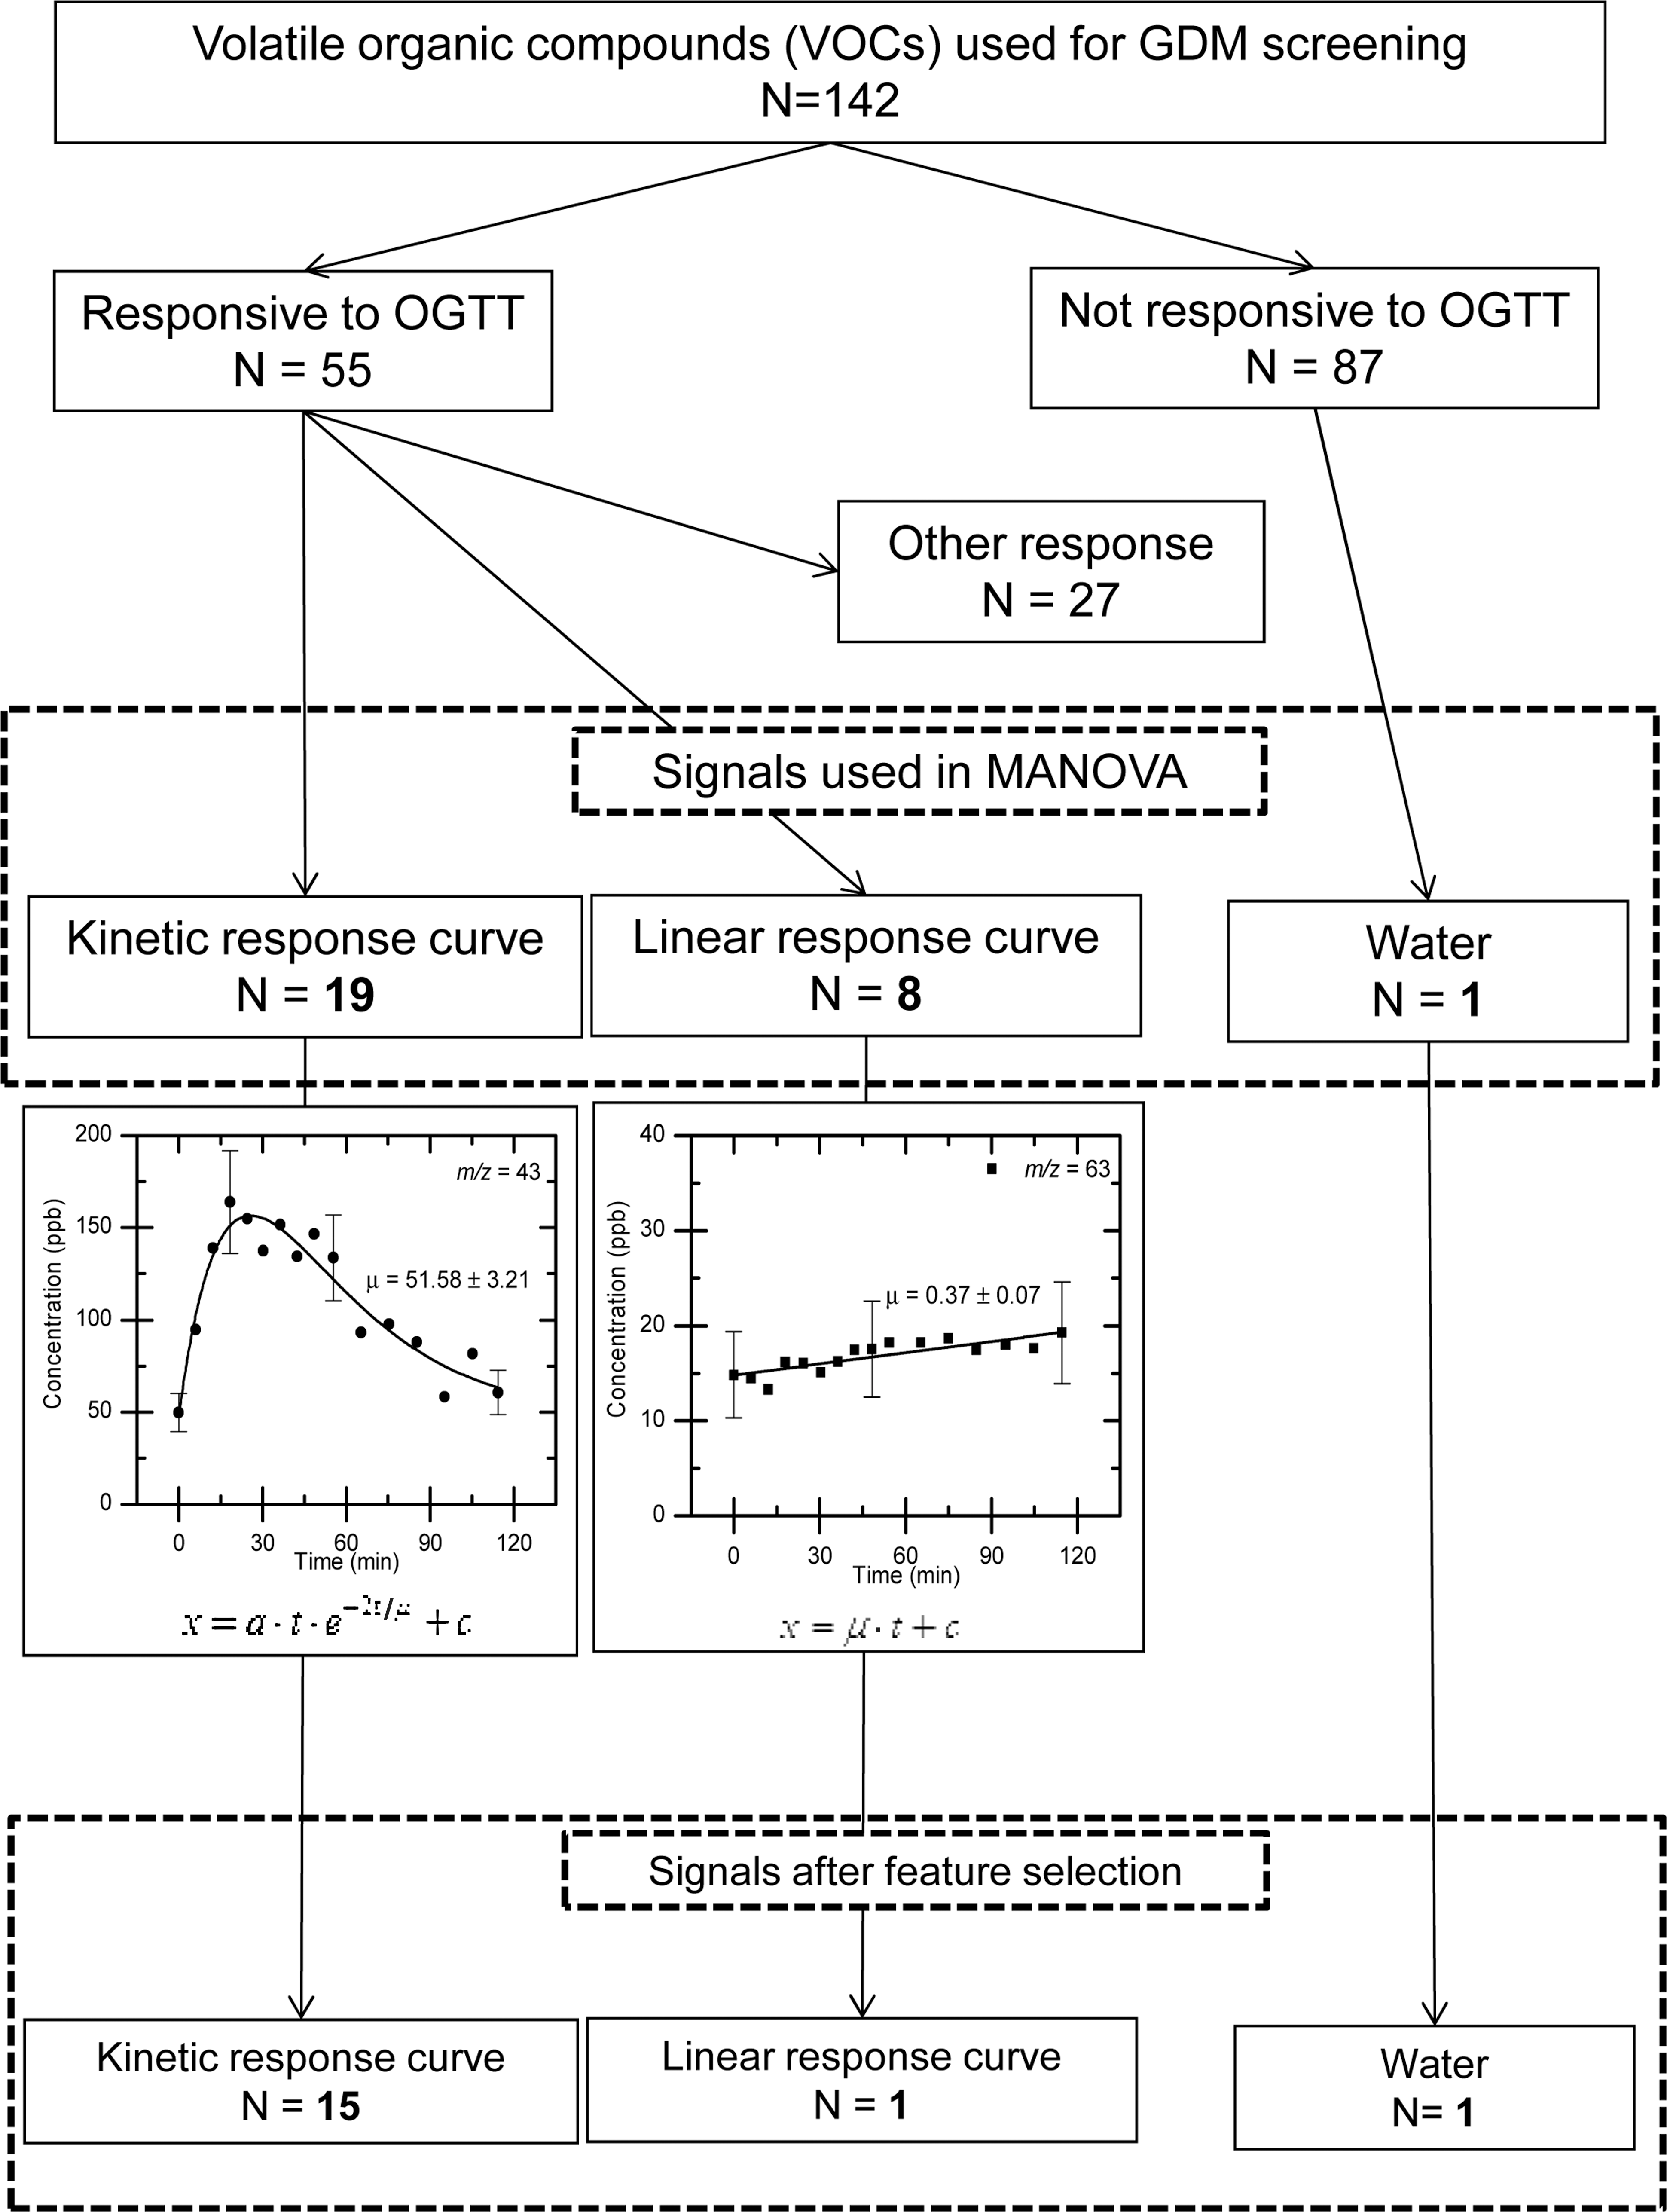
Flow chart of optimization process for the analysis of volatile organic compounds (VOCs). GDM, gestational diabetes mellitus; MANOVA, multivariate analysis of variance; OGTT, oral glucose tolerance test.
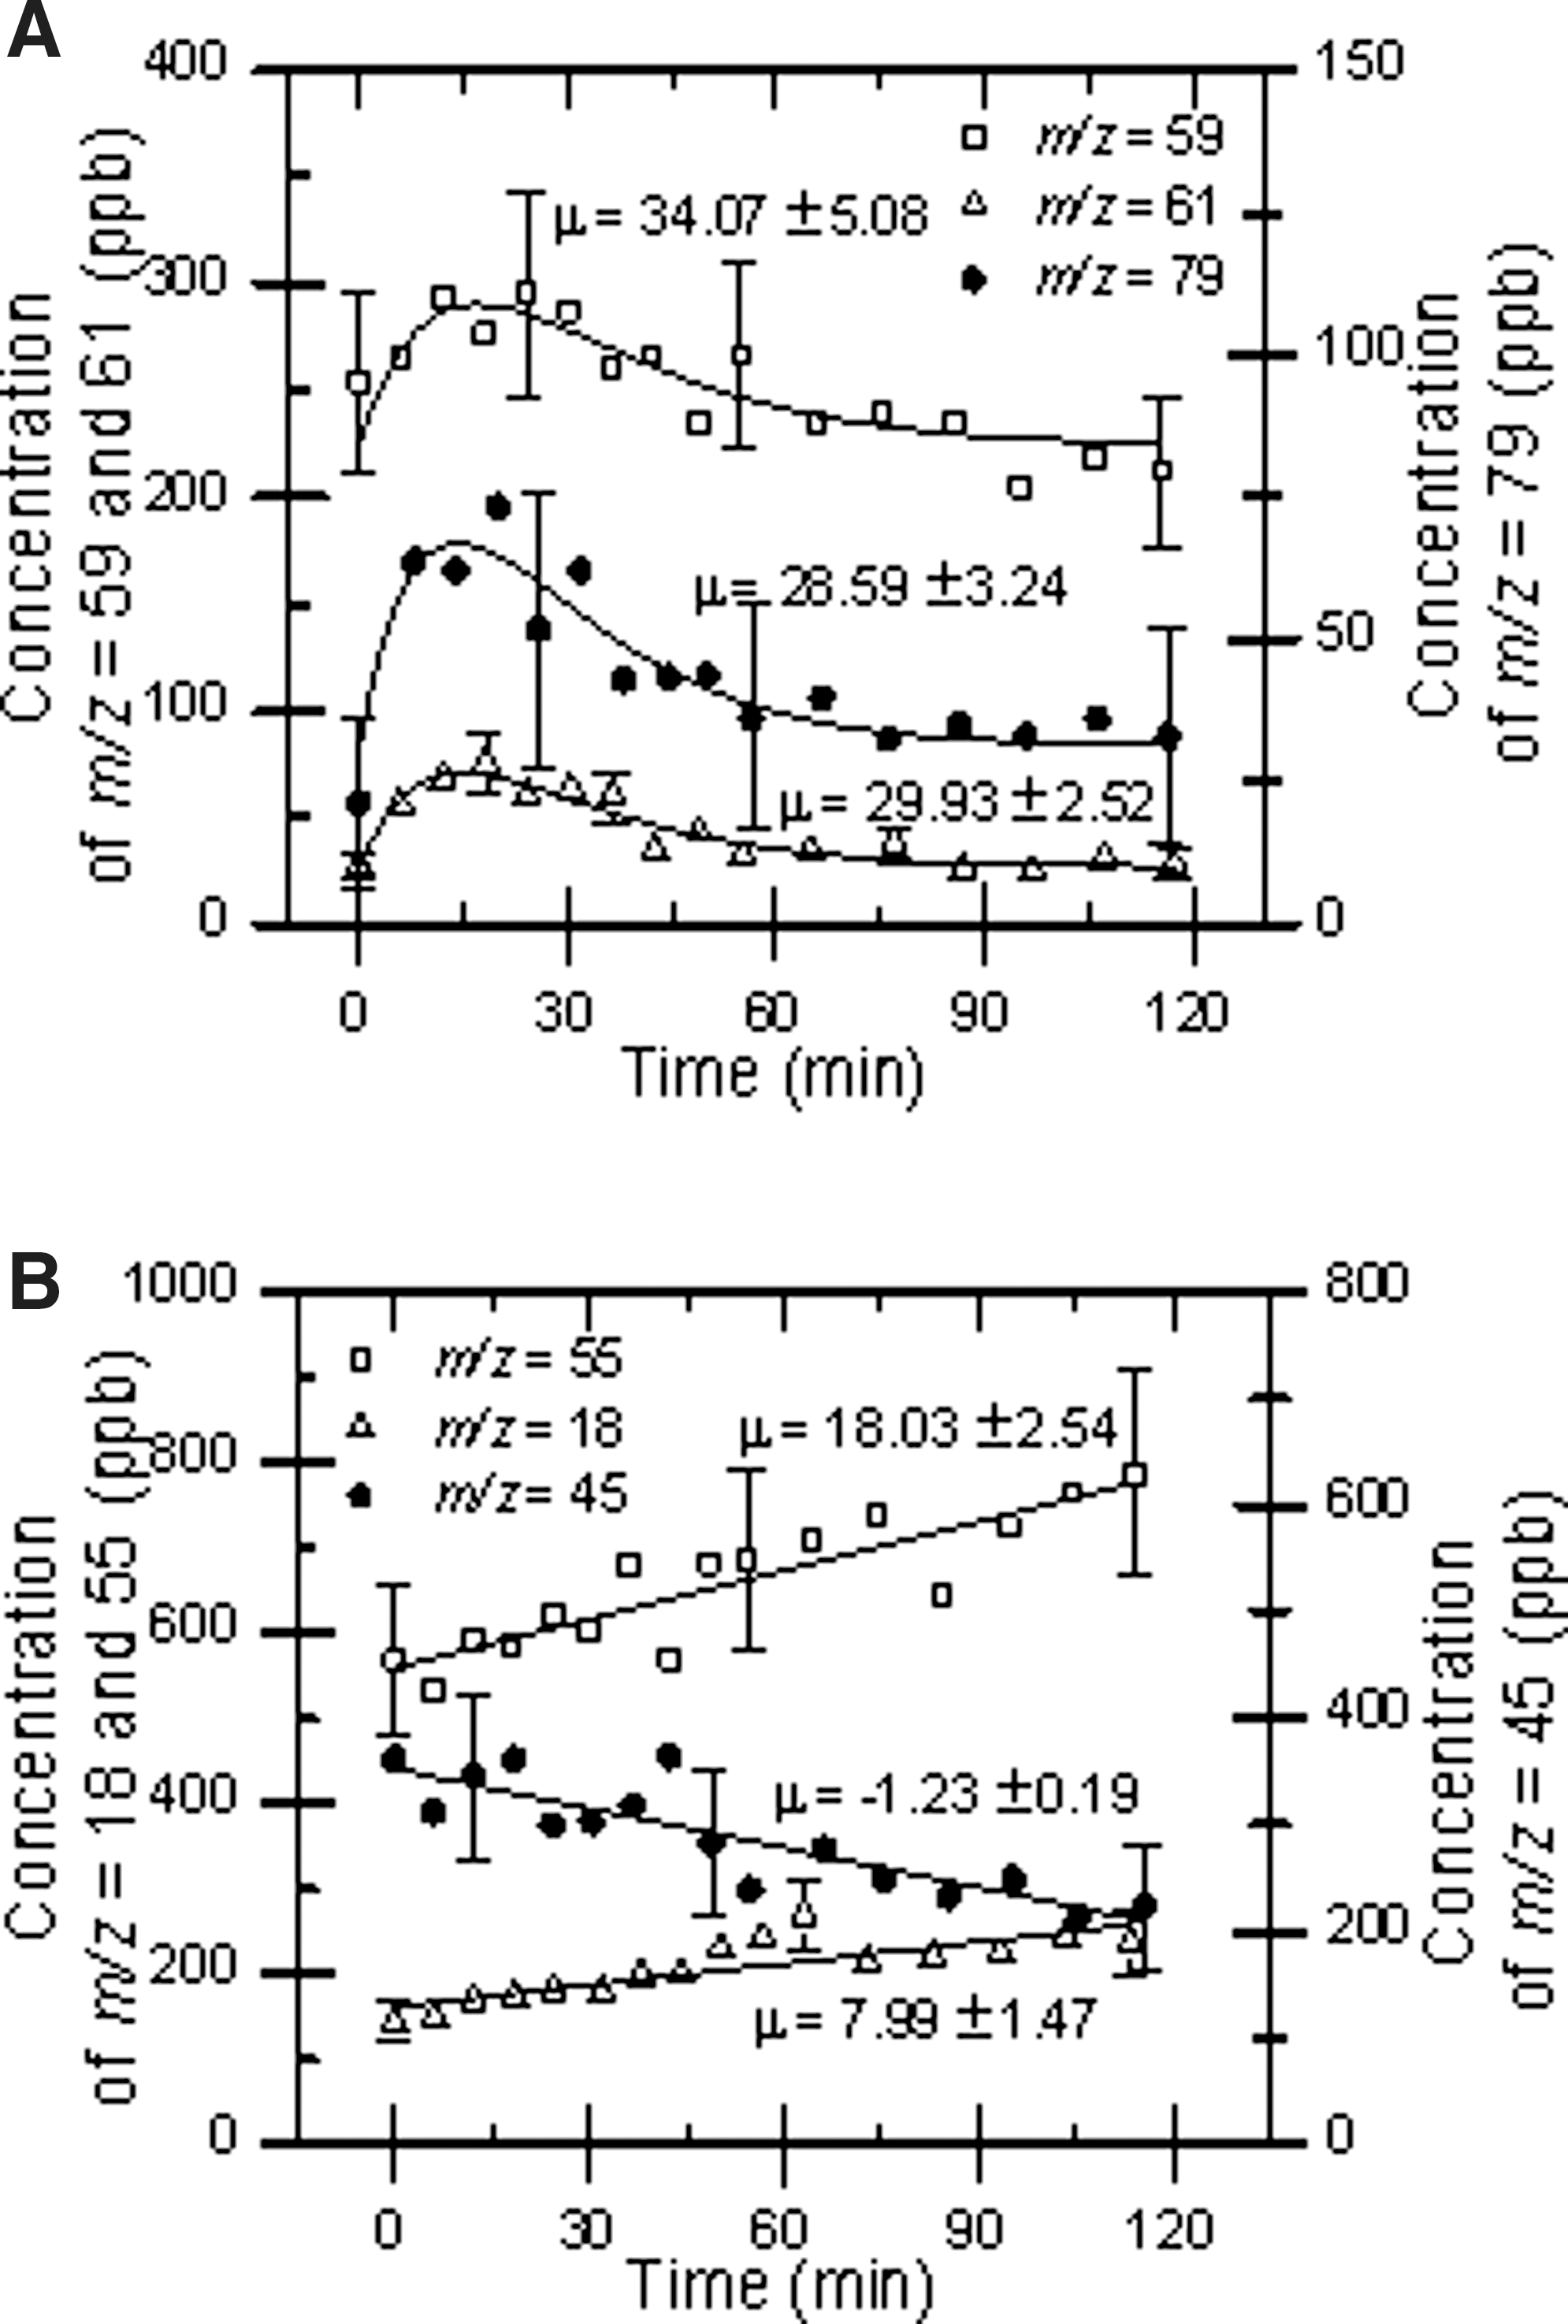
Examples of
or the linear function
Examples are given in Figure 2. The time evolution parameters μ obtained by fitting the above equations to the 27 measured signals (and of the water concentration included for technical reasons) as well as the fasting and peak level of measured signals were used to compare patients with GDM, IGT, normal glucose tolerance (NGT) (controls), and “marginal glucose tolerance” (marginal group).
A first approach with unsupervised methods like principal component analysis did not achieve subgroup separation. Subsequently we applied a supervised multivariate analysis of variance (MANOVA) technique, with the false-positive risk estimated by permutation analysis. “Supervised” here means that we provided blood-based subgrouping to the otherwise purely breath-based MANOVA.
We chose the number of classification errors on the subspace defined by the three most significant components as a quality-of-match score between the a priori given, blood-based grouping and the a posteriori computed, breath-based clustering (minimal error Voronoi regions around the centroids of blood-based groups). We performed permutation analysis using the number of classification errors as the randomized score.
Our twofold aim was to observe a high spatial separation in reduced parameter space (low number of classification errors [i.e., good match between blood- and breath-based data]) and low permutation P value (small chance of the good match being a result of randomness). Figure 3 illustrates the results when feeding MANOVA three different sets of breath-based data: Figure 3A corresponds to the time-evolution parameters μ, Figure 3B to the basal values (point measurements at time 0 min, before the challenge), and Figure 3C to the peak values (point measurements 15 min after the assumption of the challenge). All three sets achieve good spatial separation, as one could expect from high-dimensional data, but only Figure 3A has an acceptably small P value. This validates a posteriori our choice of working with time evolution parameters.
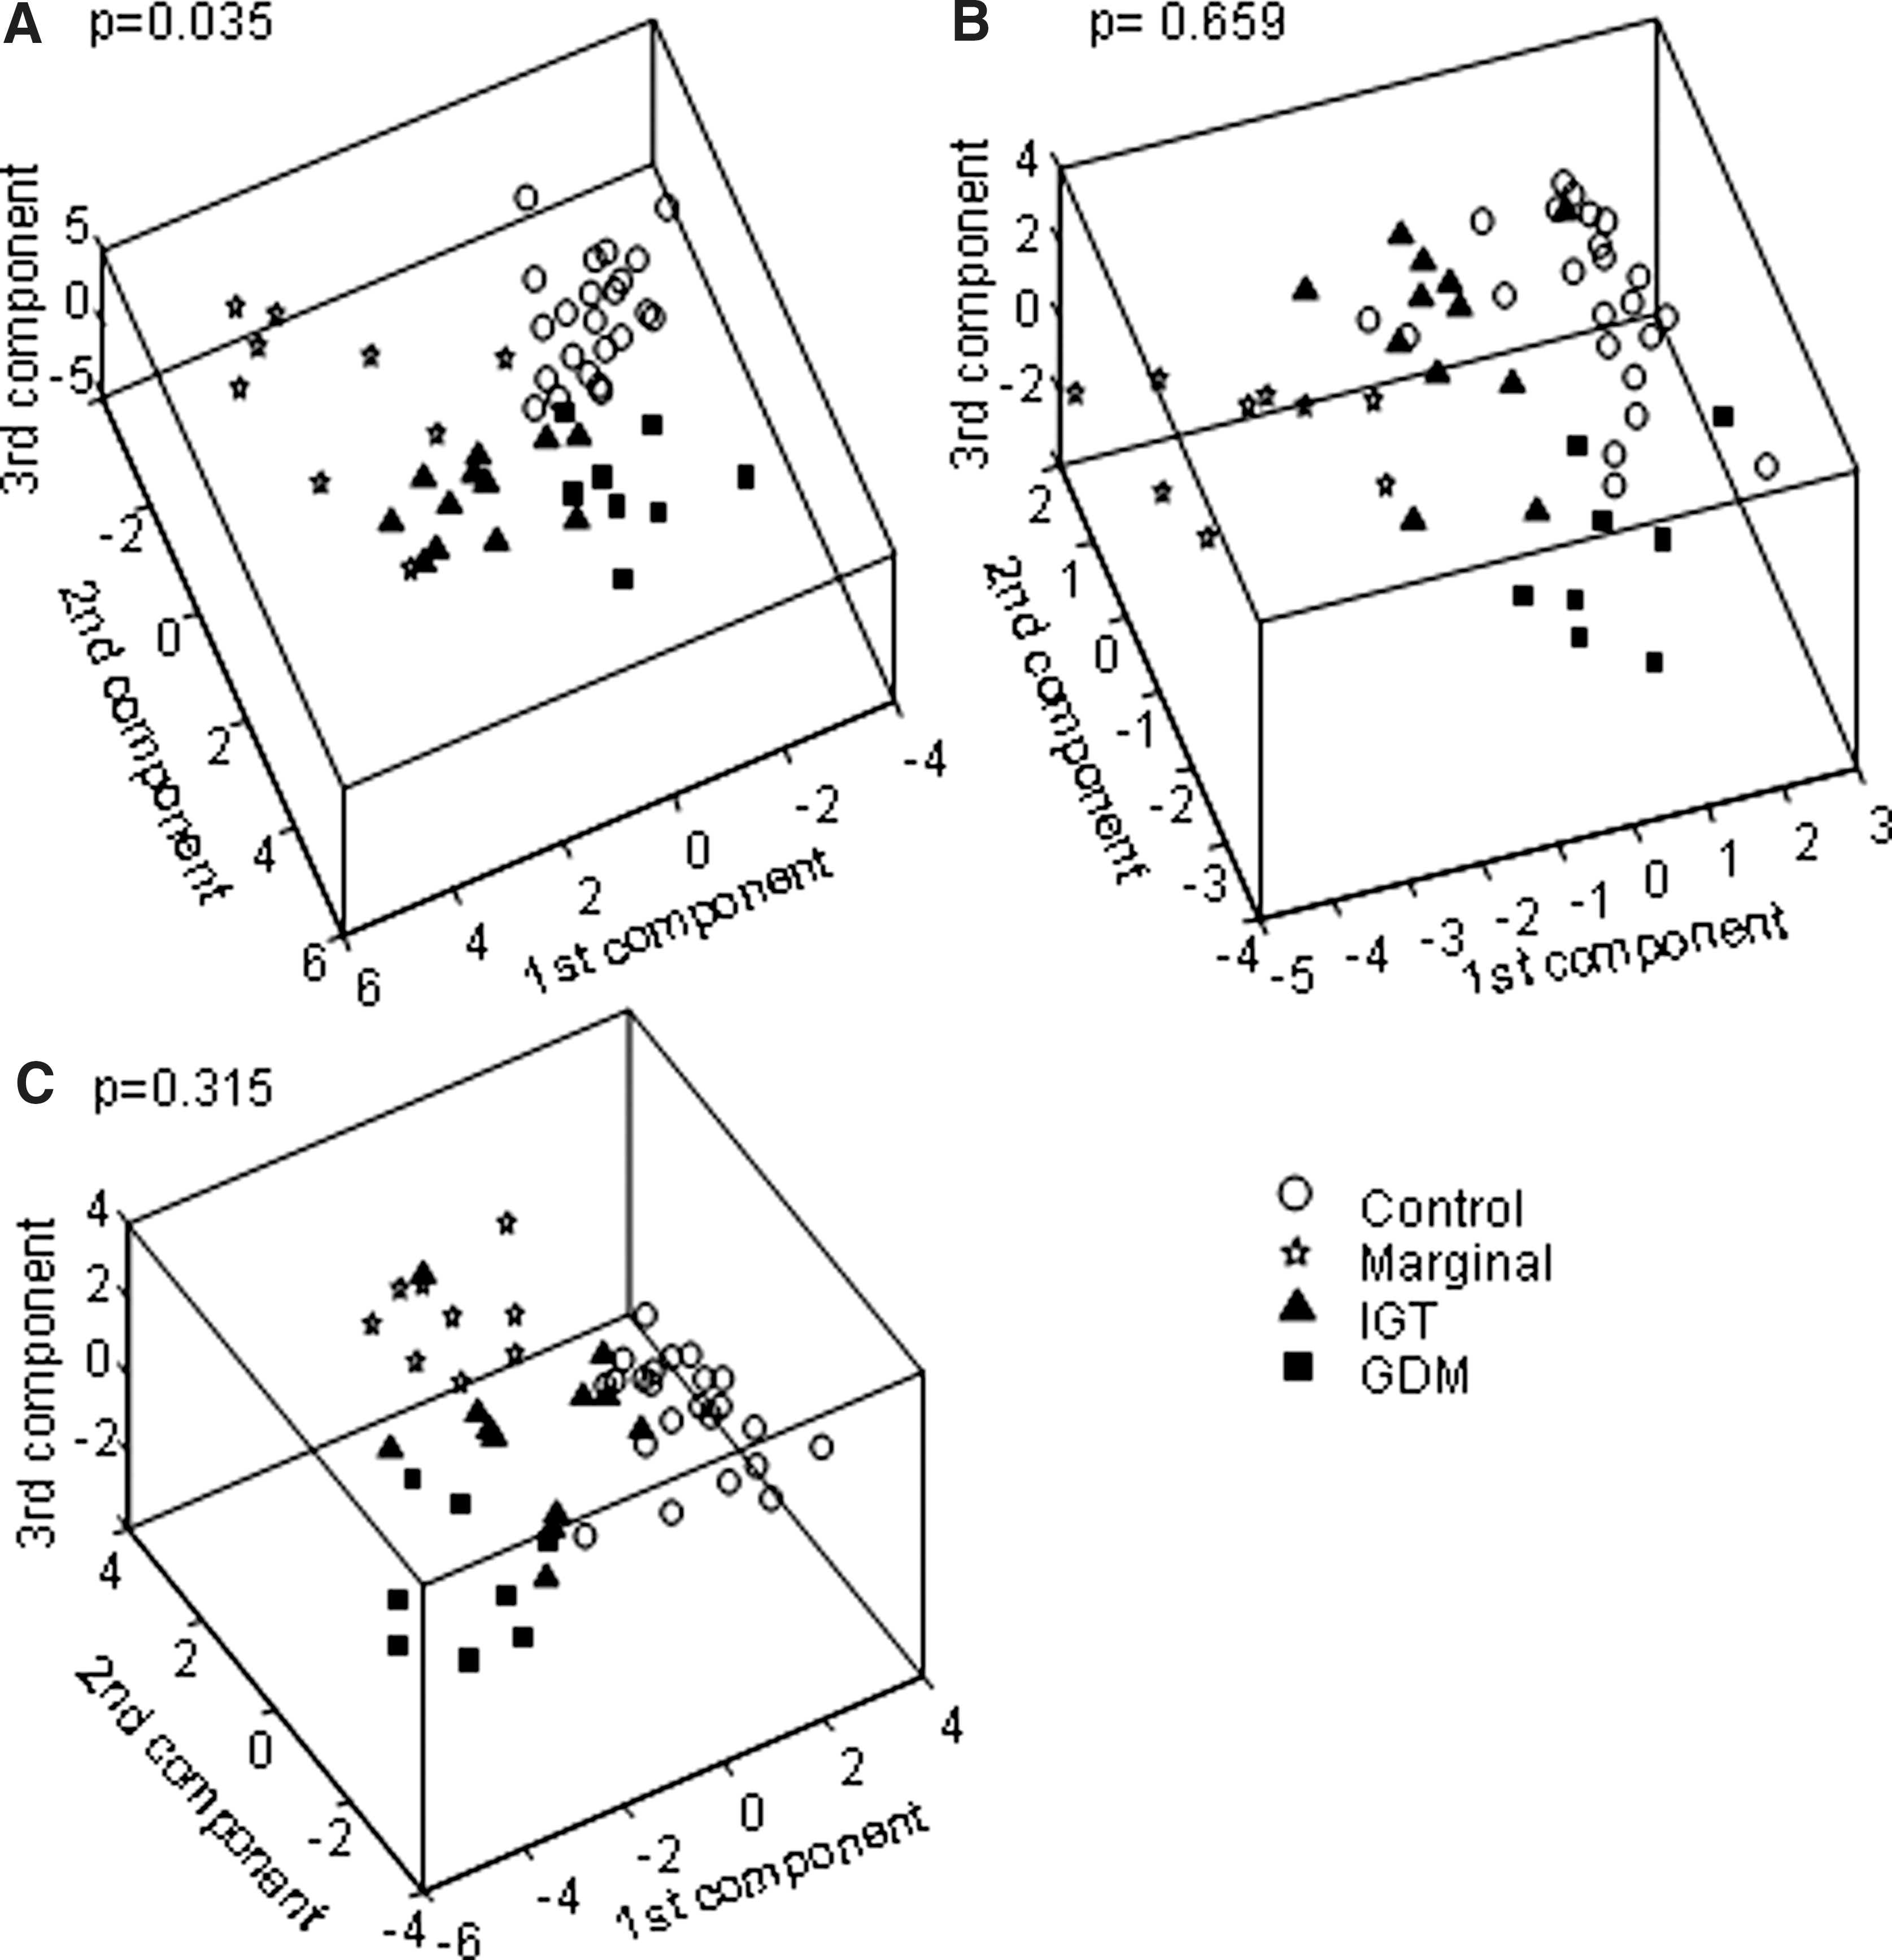
Comparison between the results of multivariate analysis of variance and permutation analysis on three different datasets associated with the oral glucose tolerance test patients:
Fasting and peak concentrations of measured VOC signals were correlated with pregestational BMI and insulin resistance (HOMA-IR) by linear regression analysis.
In order to identify those VOC signals out of the 27 that discriminated best between the four patient groups, we defined a criterion to identify a least informative signal under the assumptions of linearity, independence, and gaussianity, and we performed feature selection by iteratively excluding such signals. The computation of the OGTT score and P value at every step allowed us to choose a trade-off between quality and complexity of our results. By iteratively selecting out the m/z signals with the smallest weighted variance and repeating a MANOVA with the remainder, we obtained an “inverted order of signal importance.” At every selection step, the comparison of the breath-based grouping of patients with the blood-based one allows computation of the number of classification errors. This was used as a quality parameter to identify the trade-off between the reduction of dimensionality and the reduction of quality. The randomization score is the generalization of the P value for the reduced mass selection. It was interpreted as a quality-of-fit parameter, indicating with its decrease that the reduced mass selection is progressively better matched to the tasked classification. These parameters led to the elimination of 11 of the 28 signals.
PTR-MS does not directly distinguish between different ionized molecules with the same nominal m/z ratio. However, in the specific application of BGA the limited possible candidates have been studied extensively. 25 –28 A VOC can contribute to different PTR-MS signals because VOC–water clusters and fragments have different m/z ratios. This phenomenon allows interpretation of the tentative associations between VOC and signals with the statistical correlations between the signals themselves. We performed a cluster analysis on the time evolution parameters and identified some closely related groups: m/z signals 59:60, 45:91, 33:51, 57:72, 43:79, 89:90, and 61:62:75:76. Most groups could be explained with isotopic (m/z 59:60, 89:90, 61:62, 75:76) or water–cluster (m/z 33:51, 43:79) correlations. For the remaining m/z signal pairs (45:91, 57:72, and 61:75) we have proposed identification based on metabolic pathway correlations of the tentatively associated VOCs.
Results
OGTT-based GDM diagnosis
Standard OGTT diagnoses on the basis of blood glucose identified eight of the 52 women as having GDM, 12 as having IGT, and 32 with NGT. Within the NGT group nine women had borderline postprandial glucose levels between 170 mg/dL to 179 mg/dL after 60 min and/or between 150 mg/dL to 154 mg/dL after 120 min and were classified as the “marginal group” (Table 1). Women within this marginal group had higher 1-h postprandial glucose values compared with controls (P<0.001). Similarly, women with GDM or IGT had higher postprandial glucose levels (P<0.001). No difference in BMI was seen between groups. HOMA-IR was lower in the 23 women with NGT compared with the 29 women with non-normal values (1.28 vs. 2.29; P<0.001).
Data are median values (25th; 75th quartiles).
P<0.05, b P<0.01, c P<0.001 for comparison with the control group by Mann–Whitney U test.
BMI, body mass index; GDM, gestational diabetes mellitus; HbA1c, glycosylated hemoglobin; HOMA-IR, homeostasis model assessment of insulin resistance; IGT, impaired glucose tolerance; NGT, normal glucose tolerance; OGTT, oral glucose tolerance test.
Separation of patient groups by BGA analysis
In a first step, the time evolution parameter μ of all 27 VOC signals together with the water signal were fed to a supervised MANOVA, producing only one classification error in the separation of the GDM, IGT, marginal, and control groups (Fig. 3A). We performed a permutation analysis with the classification error as score, obtaining a P value of 0.035. Therefore we concluded—and this is the main result of our study—that breath gas data could indeed identify women with a GDM diagnosis. In a second step, we performed feature selection to identify a smaller subset of 17 masses out of the 28 signals (Fig. 1), which produced only three classification errors. The subset of 17 signals was identified as providing a good compromise between feature selection and errors in mimicking blood-based diagnosis.
As an alternative to the time evolution parameter μ, we also used basal signals (time point 0 min before the glucose challenge) in our MANOVA but found that the principal component analysis did not produce a clear separation of the subgroups of interest (GDM, IGT, marginal, and control groups; P=0.659; Fig. 3B). Similarly, point measurements at 15 min after the glucose challenge, when most kinetic-fitted m/z signals reach their peak (Fig. 3C), did not produce a statistically significant separation of the four subgroups (P=0.315).
Identification of masses in breath gas responsible for discrimination
Focusing on the specific masses in the air breath probes measured during the OGTT, we identified three groups of candidate VOCs on the basis of diabetes-related metabolic functionality: acetone and its metabolites, oxidation products of glucose and lipids, and thiols and sulfides. Table 2 shows the mass table with these different molecules. The cluster analysis of the breath gas data suggested correlations among the m/z signal pairs 45:91, 57:72, and 61:75.
L signifies linear as opposed to kinetic fitting. A subset of 17 mass-to-charge (m/z) signals (given in bold) was identified as providing a good compromise between feature selection and errors in mimicking blood-based diagnosis.
VOC, volatile organic compound.
Correlation of BGA with clinical patient characteristics
The 17 VOC signals that discriminated best among the four patient groups were correlated with two important clinical characteristics, BMI and HOMA-IR. We found an inverse correlation between m/z signal 63 (assigned to dimethyl sulfide) and HOMA-IR (Fig. 4A) (R=−0.538; P=0.0002, P corrected=0.0034) as well as between m/z signal 33 (assigned as methanol) with the pregestational BMI (Fig. 4B) (R=−0.433; P=0.0013, P corrected=0.022).

Correlation of
Discussion
BGA resulted in an evident differentiation among the GDM, IGT, marginal, and control groups. Further studies with larger number of participants will be required to reduce uncertainty in the estimated parameters and to build a clinical usable test. However, the glucose load (OGTT) will remain necessary as only the use of the time evolution parameters after the glucose challenge, and not the basal breath gas values after fasting, can achieve the differentiation into the metabolic groups. The use of time evolution parameters only, independently of the absolute values of the signals, is one important novelty of our BGA method. This approach reduced noise factors like the presence of disinfectants, inherent human variability, or changing operative conditions of the PTR-MS device.
Another observation was related to the blood value thresholds used in standard medical practice for OGTT-based GDM diagnosis. 29 Recent studies in GDM and healthy pregnant women 30 suggest a linear correlation of blood glucose values and outcome risk. The marginal group defined above not only had higher level of postprandial glucose (60 min), higher HbA1c, and higher insulin resistance (HOMA-IR) compared with the control group (Table 1), but interestingly was distinguishable from the control group by means of BGA as well (Fig. 3). These data suggest that VOCs in breath gas may identify pathways relevant for the pathology of GDM as well as for classification and diagnosis.
The focus of our study was on VOCs that responded to the challenge of OGTT and that are likely to reflect changes of blood metabolites related to the glucose load. The metabolites that were found to be associated with the VOC signals (masses) included acetone and its metabolites and sulfur compounds (thiols and sulfides), derived from methionine. Indeed, alterations in the acetone metabolism are known in diabetes. 31 Several studies on the use of BGA parallel to the monitoring of blood glucose after oral or intravenous glucose tolerance studies have been published showing, for example, changes of exhaled acetone, ethanol, or ethyl benzene 13 –15 ; here, it is stated that the metabolism of (ethyl) benzene by liver enzymes can be affected by hyperglycemia. The m/z signal 79 assigned to the VOC benzene was also a striking m/z signal found in our study. Recently, disturbances of the methionine cycle and in particular its transsulfuration pathway were connected with diabetes. 32
Other metabolites that were found to be associated with GDM were endogenous aldehydes. Concerning the signal pairs identified by cluster analysis, we interpreted the m/z signal pairs 57:72 or 61:75 as various low-molecular-weight aldehydes (e.g., acrolein and methacrolein) or carbonyl compounds (e.g., glycolaldehyde and hydroxyacetone) (Table 2). It is known that these aldehydes can be produced by diabetes-related reactions of lipid peroxidation, glucose autooxidation, and/or oxidative stress. 33 –35 The main fragment of other aldehydes (butanal, hexanal, etc.) at m/z 5525 interfered with the water cluster (H3O)2H3O+, which was not separable with the PTR-MS. The m/z signal pair 61:75 could be related to acetic acid and its esters (m/z 61) or methyl acetate (m/z 75); in parallel, the m/z signal pair 45:91 could be acetaldehyde and its metabolite 1,3-butanediol. 36 Both VOC pairs can be metabolized to the ketone body precursor β-hydroxybutyrate, whose increased formation is well known in diabetes.
It is interesting that we found a correlation of clinical characteristics and single breath gas compounds. We suggest that the less known transamination pathway of methionine 37 leading to degradation products such as methanethiol or dimethyl sulfide might be altered in people with insulin resistance, leading to a decrease of mass 63 (dimethyl sulfide) coupled with an increase of HOMA-IR index in the pregnant women. In this specific pathway, a large enzyme complex is present. 38 This enzyme complex (branched-chain 2-keto acid dehydrogenase) usually regulates the catabolism of the branched-chain amino acids and can be inhibited by insulin. 39 Assuming that the activity of this enzyme complex can be also decreased by insulin in the transamination pathway of methionine, one can speculate that also the production of substances like dimethyl sulfide (derived from methionine) is reduced in conditions with, for example, hyperinsulinemia. The observed correlation between methanol concentrations in breath gas and pregestational BMI has been previously suggested 21 and related to dietary factors and intestinal microbiota. Intestinal bacteria also produce volatile metabolites (VOCs), which can be absorbed into the human blood circulation and cannot be differentiated from the VOCs produced in the human metabolism.
The diagnostic classification by BGA presented in this study has still several limitations. First, the glucose challenge is still necessary to produce the time evolution parameters. Furthermore, the quantitative information given by the amount of the blood glucose value is missed by BGA. As this is a pilot study, the potential of the technique must be developed in further investigations. One future advantage could be the identification of associated signature metabolic pathways. Potentially, the technique can reveal dynamics and metabolic mechanisms behind OGTT. In addition, innovative sampling and preconcentration of breath gas with very sensitive and selective offline chromatographic techniques coupled to high-resolution mass spectrometers will allow the depiction of individual personalized breath gas pattern. Electronic noses may simplify the diagnostic procedure. Finally, a larger sample set might enable the identification of non-random correlations between time evolution parameters and the basal values, allowing disposing of the OGTT altogether. Recall that, with the presently collected samples, basal values can also produce a good mirroring of blood-based grouping. It is the permutation value that is too high, meaning that one cannot rule out yet a random spurious result.
In summary, we suggest that BGA has the potential to improve and possibly replace GDM screening as well as offer new insights in metabolic pathways in diabetes. Future studies include improvement of sampling and measurement of VOCs by performing nasal breath sampling by using a new spectrometer, the proton transfer reaction–time of flight mass spectrometer, and by extending our patient cohort.
Footnotes
Acknowledgments
This study was supported by the German Competence Net for Diabetes (grant 01GI0805). M.H. was supported by the Forschergruppe Diabetes e.V., Munich, Germany. This study is part of the diploma thesis of S.H. (Munich Technical University, Germany, 2011) and the medical thesis of J.M.M. (Ludwig-Maximilians University of Munich, Germany). We thank Ionimed GmbH for providing us with a buffered end-tidal sampler and Melanie Bunk and Marina Zwilling for technical assistance. The authors thank the pregnant women for their participation in the study.
Author Disclosure Statement
No competing financial interests exist. W.S., A.-G.Z., and M.H. designed the study. S.H., M.F., W.S., J.M., and M.H. researched the data. V.H. contributed to metabolic data interpretation. M.F., W.S., V.H., A.-G.Z., and M.H. wrote the manuscript. A.-G.Z. reviewed/edited the manuscript.