
Abstract
Background:
Advanced glycation end products (AGEs) accumulate with age and in diabetes mellitus (DM). AGEs can be measured by the AGE Reader (DiagnOptics Technologies BV, Groningen, The Netherlands) using skin autofluorescence (SAF). SAF is related to chronic diabetes complications. In a previous study we reported that SAF is comparable in patients with gestational DM (GDM) and controls at 27 weeks of gestation. In the current study we investigated SAF at multiple time points during pregnancy in pregnancies complicated by DM (type 1 or type 2) or GDM and in controls. Furthermore, the relation between SAF levels and adverse pregnancy outcomes was investigated.
Subjects and Methods:
In this single-center prospective observational study SAF was measured during pregnancy from 26 gestational weeks onward in 79 GDM patients, 21 patients with preexistent DM (type 1 or type 2), and 55 women without diabetes. Adverse pregnancy outcomes were recorded.
Results:
SAF decreased slightly but significantly (β=−0.018) during normal pregnancy but not in pregnancies complicated with hyperglycemia. At the end of pregnancy SAF was higher in patients with preexistent DM (1.91 arbitrary [AU] units) compared with patients with GDM (1.71 AU) or normal pregnancy (1.66 AU) but did not differ between the latter two groups. SAF was not related to adverse pregnancy outcomes.
Conclusions:
The decrease in SAF during normal pregnancy could be the result of physiological changes. Because SAF was not related to adverse pregnancy outcomes, it is unlikely that the AGE Reader will be of use in daily clinical practice for GDM patients as a marker for identifying high-risk pregnancy outcomes.
Introduction
In a previous study we reported that there are no differences between SAF levels in gestational diabetes mellitus (GDM) patients and control patients in midpregnancy (27 weeks), which indicates that the AGE Reader is not useful as a screening method for GDM 13 ; however, our prior study does not rule out any differences later in pregnancy. Nor does it describe if SAF changes during pregnancy and if differences in changes exist between normal pregnancies and pregnancies complicated by hyperglycemia. Furthermore, literature in nonpregnant diabetes patients shows that AGE levels are strong predictors of future diabetes complications. 11,14 We hypothesized that SAF, measured during or at the end of pregnancy, could predict adverse pregnancy outcomes specific for pregnancies complicated by hyperglycemia. Therefore in this study we investigated whether SAF levels measured during pregnancy are related to adverse pregnancy outcomes. Because no data exist on SAF levels in pregnant patients with preexistent DM (T1DM or T2DM), we planned to compare data from GDM and control patients with this group.
Patients and Methods
Study design
This single-center prospective observational study was conducted at the combined outpatient clinic for pregnant women with diabetes of the Departments of Obstetrics and Internal Medicine of the University Medical Center Utrecht, Utrecht, The Netherlands. In this outpatient clinic, pregnant patients are seen by an obstetrician or midwife in a primary-, secondary-, or tertiary-care setting. Patients with T1DM, T2DM, or GDM are also treated by a diabetes specialist (internal medicine) and diabetes nurse educator. Patients were included from April 2010 until December 2011. The study was approved by the local ethics committee, and all subjects gave written informed consent before measurements.
Patients
For this study patients were included if diagnosed with preexistent DM (T1DM or T2DM) or with GDM (two or more values above the threshold in a 100-g oral glucose tolerance test [OGTT]). Screening and diagnostic tests for GDM had to be performed between weeks 20 and 32 of pregnancy for patients to be included in the study. The control group of pregnant women without diabetes consisted of two subpopulations. One group consisted of pregnant women in whom an OGTT or glucose challenge test was performed because of maternal risk factors or clinical suspicion of GDM, but in whom testing was negative. These women were included if all glucose values of the OGTT were below the cutoff points or if the challenge test was negative. The other group consisted of pregnant women without any risk factor for GDM, in whom an OGTT or challenge test was not performed.
Exclusion criteria in all three different groups were as follows: renal failure (glomerular filtration rate, <30 mL/min); preeclampsia at the time of inclusion or in a previous pregnancy; serious infection or hospital admission during the last 6 months; active autoimmune disease; current use of corticosteroids; smoking; or skin reflectance <6% (because measurement by the AGE Reader is not reliable if the reflectance is <6% [usually in patients with dark brown or black skin]). For the analysis of adverse pregnancy outcome with SAF only patients with a singleton pregnancy were included.
All patients with GDM or T1DM or T2DM were treated by a diabetes specialist and diabetes nurse educator following standard protocol consisting of glucose monitoring, diet, and if necessary insulin for GDM and insulin treatment for T1DM or T2DM patients. Pregnant women without diabetes were treated by their midwife or obstetrician, following standard protocol.
SAF (AGE Reader)
The level of AGEs in the skin was measured noninvasively by the AGE Reader. The AGE Reader is a desktop unit on which the patient positions the volar side of the right lower arm on a light source. The excitation light source is an ultraviolet-A black light tube, with a wavelength between 350 and 420 nm (peak wavelength, 370 nm), which illuminates around 2 cm2 of the skin. A spectrometer detects the reflected light from the skin in the 420–600 nm range. SAF is calculated as the ratio of the total emission intensity and the total excitation intensity and expressed in arbitrary units (AU). The measurements of SAF were validated against AGE levels (pentosidine, carboxymethyllysine, and carboxyethyllysine) in skin biopsy specimens in healthy controls, in patients with diabetes, and in patients on hemodialysis. 2,4 Prior reproducibility studies of repeated measurements in 25 healthy volunteers have shown a mean relative error (coefficient of variance [COV]) of 5%. 15 Calculations of within-subject reproducibility from our own results using four consecutive measurements of 37 patients (during OGTT) showed the same COV (4.9%). 13 The AGE Reader has been validated in patients with skin reflectance ≥6%. A correction is made to the SAF value if the reflectance is between 6% and 12%. If the reflectance is below 6%, measurement with the AGE Reader is not possible. Patients were measured in predefined time windows during pregnancy: weeks 26–29, weeks 30–33, weeks 34–37, and week >38 and at their first visit postpartum (approximately 8 weeks postpartum).
Clinical data
At the first visit a questionnaire was completed, including baseline characteristics such as age, ethnicity, body mass index, obstetric history, medical history, medication, and family history. Using standard laboratory techniques, blood was analyzed for glycated hemoglobin (HbA1c) (reference value, 20–42 mmol/mol [4.0–6.0%]) at diagnosis. Data for adverse pregnancy outcomes were retrieved from patients' records. Primary end point was large for gestational age (LGA), and secondary end points included preeclampsia, preterm delivery, cesarean section, fetal death (>20 weeks), hypoglycemia, neonatal jaundice, and birth trauma. LGA was defined as >90th percentile, corrected for gestational age, sex, and parity, according to the new Dutch reference curves. 16 Preterm delivery was defined as delivery before 37 completed weeks, neonatal hypoglycemia was defined as glucose <2.0 mmol/L in the first 24 h or need for glucose infusion, and neonatal jaundice was defined as requirement of phototherapy and shoulder dystocia as reported in the patient record. Finally, a composite end point was defined including one or more of the abovementioned adverse pregnancy outcomes.
Statistics
Results are presented as mean and SD values. Differences in baseline characteristics were tested using a Student's t test for continuous variables and using a χ2 test for categorical variables. A value of P<0.05 was considered significant.
First, whether SAF changes during pregnancy differed among the three groups was analyzed using analysis of variance for repeated measurements with time point during pregnancy, pregnancy group, and the interaction between time and pregnancy group in the model. In case the interaction term was significant, changes over time among the three groups were considered different. Patients with three or more values were included in this analysis, and missing values were imputed. Imputation was carried out as follows: when the first or the fourth value was missing, the data were copied from the second or the third value, respectively. When the second or the third measurement was missing, the average of the first and third or of the second and fourth was taken, respectively. To assess reliability of this method of imputation, an alternative method of imputation was used as well, using the last observation carried forward.
Next, the relation between pregnancy week and SAF was assessed in all three groups separately using linear regression. Finally, differences among SAF in GDM, control, and preexistent DM patients at a certain time point (cross-sectional) during pregnancy were analyzed using one-way analysis of variance with Bonferroni's correction. Differences between SAF before delivery and SAF postpartum within one group were analyzed with a paired t test. All differences found above were adjusted for prespecified factors (age and ethnicity) using a linear regression mode because these factors were identified as the most important confounders in a previous study. 13
A logistic regression model was used to investigate the relation of SAF with adverse pregnancy outcomes. This analysis of relation of SAF with adverse pregnancy outcomes was carried out in all three groups together (GDM, control, and preexistent DM), with preexistent DM (yes/no) as a factor in the logistic regression analysis. This analysis was performed for the primary end point (LGA) and for the other two end points with the most cases (cesarean section and the composite end point).
The sample size necessary to investigate any differences between SAF in different groups was calculated based on a study in recently preeclamptic women, which showed a difference in SAF of 0.4 AU (SD 0.5). 17 If the expected AGE accumulation in GDM patients or patients with preexistent DM would be comparable to that in patients with preeclampsia, then at least 26 patients per group (α of 0.05 and a power of 80%) were required.
The sample size necessary to investigate a relation between SAF and adverse pregnancy outcomes was also calculated using previous studies showing odds ratios ranging from 3 to 4 for adverse pregnancy outcome with hyperglycemia during pregnancy. 18,19 Historical (authors' unpublished) data from our own clinic were used to estimate the percentage of patients who would suffer adverse pregnancy outcomes, such as LGA (26%). Assuming that the risk of adverse pregnancy outcomes is of the same magnitude with increased SAF, a sample size of 100 GDM patients would be sufficient to detect a relative risk of 2.15 for the primary end point (LGA) (assuming that LGA would occur in 26% of the patients, power 80%, α=0.05). And, 2.15 is well below the odds ratio (3–4) previously found.
Results
In total, 197 patients signed informed consent. We included 79 GDM patients and 21 patients with preexistent DM (13 with T1DM and eight with T2DM). The control group consisted of 55 pregnant women without diabetes, including 38 women who had a negative OGTT or negative challenge test and 17 pregnant women without risk factors for GDM. We excluded 42 women because of smoking (n=17), gestational age <20 or >32 weeks (n=7), skin reflectance <6% (n=3), withdrawal of consent (n=2), active autoimmune disease (n=1), current use of corticosteroids (n=1), serious infection or hospital admission during the last 6 months (n=1), preeclampsia (n=3), control patients with risk factors in whom no challenge test or OGTT was performed (n=2), or incorrect interpretation of OGTT (n=5). During the study 24 patients were lost to follow-up (six GDM patients, 15 control patients, and three preexistent DM patients).
Baseline characteristics of GDM patients, patients with preexistent DM, and control patients are presented in Table 1. Body mass index was significantly lower in pregnant women without diabetes, compared with patients with GDM or preexistent DM. HbA1c in the second trimester was higher in patients with preexistent DM compared with patients with GDM. HbA1c was not measured in control patients.
Data are mean (SD) values or percentages.
Significantly elevated compared with pregnant women without diabetes.
Significantly elevated compared with gestational diabetes mellitus (GDM) patients. BMI, body mass index;
DM, diabetes mellitus; HbA1c, glycated hemoglobin.
The changes of SAF levels during pregnancy in different groups are shown in Figure 1. Direction and course of SAF changes during pregnancy were comparable between the groups (time×group not significant). We did find a significant difference in mean SAF between the groups (group; P=0.045) (mean SAF of preexistent DM during pregnancy was elevated compared with the other groups). Changes of SAF during pregnancy were also significant (time; P<0.05), showing an overall decrease of SAF over time during pregnancy. Results were comparable when using two different ways of imputation of data.
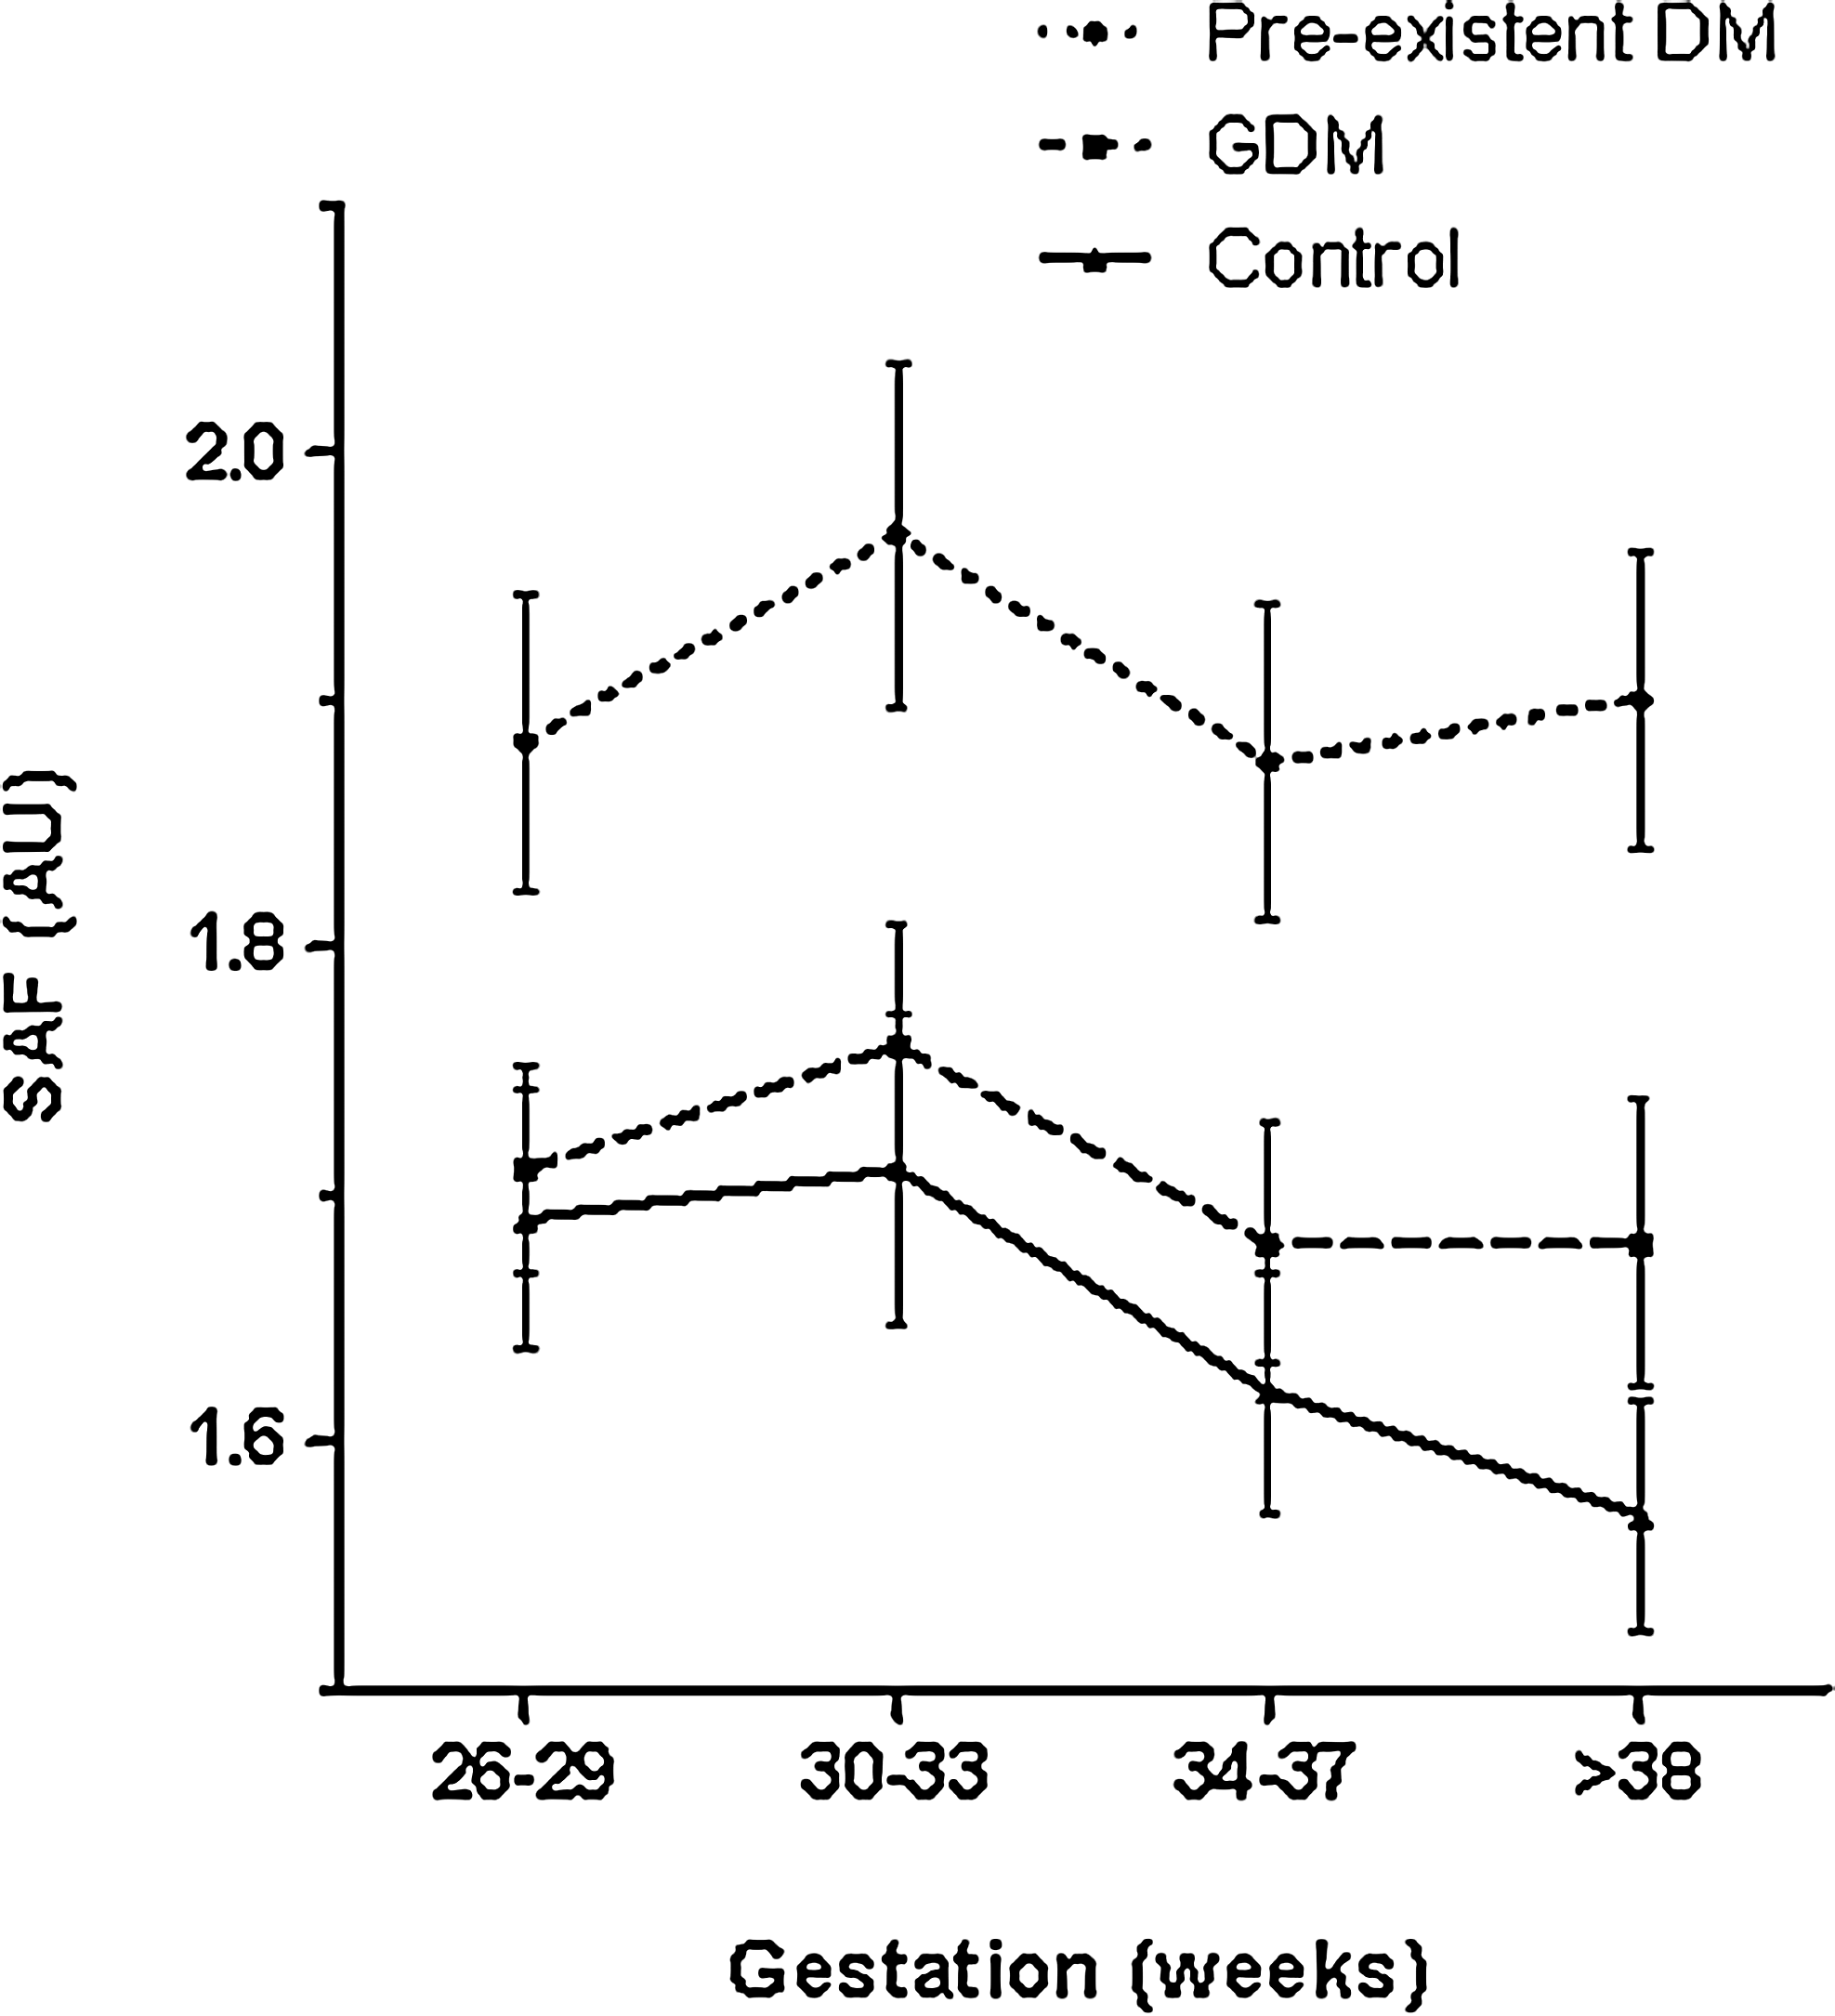
Skin autofluorescence (SAF) levels during pregnancy in patients with preexistent diabetes mellitus (DM), gestational diabetes mellitus (GDM), and control patients. AU, arbitrary units.
SAF decreased over time in all three groups together with a significant effect of time in the repeated-measurements analysis. Therefore weeks of gestation as a factor was investigated in a linear model in the three different patient groups separately (control, GDM, and preexistent DM) adjusting for age and ethnicity (white European or other) (Table 2). This showed that the decrease in SAF during pregnancy was significant in control patients only, showing a decrease of 11% during pregnancy.
Data are β values and 95% confidence intervals (CIs). Statistically significant findings are indicated in bold type.
DM, diabetes mellitus; GDM, gestational diabetes mellitus; NS, not significant.
Differences in SAF were also analyzed cross-sectionally among the groups at 26–29 weeks and later in pregnancy. SAF was elevated in patients with preexistent DM, compared with pregnant women without diabetes in weeks 26–29 (preexistent DM, 1.93 AU [0.21]; controls, 1.75 AU [0.33]), but this difference was not significant. A significant difference was shown later in pregnancy (weeks 34–37 [P=0.025] or week >38 [P=0.026]) (preexistent DM, 1.91 [0.24]; controls, 1.66 [0.28]; P=0.025 [weeks 34–37]). These results did not change when corrected for age and ethnicity in a linear regression model. No significant differences were seen between GDM and control patients.
As can be seen from Figure 2), SAF increased significantly again 8 weeks postpartum in the control patients: SAF before delivery, 1.59 (0.20); postpartum, 1.72 (0.21) (P<0.001).

Skin autofluorescence (SAF) levels during pregnancy and postpartum in patients with preexistent diabetes mellitus (DM), gestational diabetes mellitus (GDM), and control patients. AU, arbitrary units.
The incidence of adverse pregnancy outcomes was lower than expected (Table 3). Complication rates in GDM patients and control patients were comparable, but patients with preexistent DM had significantly more complications (composite end point) and more LGA neonates. SAF was not associated with any of the adverse outcomes or the composite end point, but HbA1c and diagnosis of preexistent DM were associated with an increased risk of adverse pregnancy outcome (Table 4). Preexistent DM was, as expected, the strongest factor. However, HbA1c was also independently associated with adverse pregnancy outcome when investigated in the GDM group only.
Data are percentages.
Significant difference compared with the other groups.
DM, diabetes mellitus; GDM, gestational diabetes mellitus.
Data are odds ratios (confidence interval). Significant odds ratios are indicated in bold type.
BMI, body mass index; DM, diabetes mellitus; HbA1c, glycated hemoglobin; SAF, skin autofluorescence.
Discussion
This is the first study investigating tissue accumulation of AGEs, measured as SAF during pregnancy in GDM patients, in pregnant women without diabetes, and in patients with preexistent DM. SAF slightly, but significantly, decreased during pregnancy in control patients but not in pregnancies complicated by hyperglycemia. SAF was elevated in patients with preexistent DM compared with control and GDM patients. No associations of SAF levels with adverse pregnancy outcomes were found.
Differences in SAF between preexistent DM and GDM and control patients were more pronounced at the end of pregnancy than in midpregnancy. This was merely due to a decrease in SAF in control patients because this decrease was not seen in hyperglycemia-complicated pregnancies. It is unknown which factors could contribute to the decrease in SAF we found. Several physiological changes occur during pregnancy, such as increased glomerular filtration rate, peripheral vasodilation, and increased cardiac output. 20 Changes in renal physiology (increased glomerular filtration during pregnancy) could contribute to a higher clearance of AGEs because circulating AGEs are cleared by the kidney. 21 A decrease in SAF seems contradictory to the irreversible nature of AGE formation, but the lifetime of AGEs is determined not only by AGEs itself, but also by the turnover of the AGE-modified protein. 22 An acute rise, followed by a decrease, in SAF has been described before in patients after myocardial infarction, but never in a physiological state such as pregnancy. 23 Another possibility is that cardiovascular changes, such as peripheral vasodilation, influence SAF measurement itself. SAF has been reported to be decreased when vasodilation occurs (induced thermally or pharmacologically), possibly because of absorbent properties of hemoglobin. 24 However, this is less likely to be a significant factor in our study because vasodilation is usually more prominent earlier in pregnancy and was not induced externally and probably less profound. Apparently hyperglycemia (in GDM and preexistent DM) prevents the decrease in SAF.
In a prior study we found that SAF was comparable in GDM at diagnosis and control patients in the same week of pregnancy. 13 The relatively mild and short hyperglycemia could be the reason that SAF levels are not yet elevated in GDM pregnancies at diagnosis. In the present study we found that a difference in SAF between GDM and control patients later in pregnancy did not develop either, indicating that even with longer exposure to hyperglycemia, the hyperglycemia experienced in GDM is too mild to elevate SAF. We did see elevated SAF in patients with preexistent DM, in whom hyperglycemia is more explicit and of longer duration.
This study did not show any relation of SAF levels with adverse pregnancy outcomes. We did find the expected association between HbA1c and adverse pregnancy outcomes in patients with preexistent DM or GDM (HbA1c was not measured in control patients). Therefore HbA1c as a long-term parameter of glycation remains the parameter of interest.
A few methodological issues of the study have to be addressed. First, the sample size necessary to investigate differences in SAF between different groups was calculated at 26 patients per group. For the group of patients with preexistent DM this sample size was not met because of logistic reasons. However, because the other two groups were larger than 26 patients, the 21 patients in this group is sufficient. But for the analysis of relation of SAF with adverse pregnancy outcomes, the group of preexistent DM is rather small on which to base firm conclusions. For GDM patients the sample size necessary to investigate a relation between SAF and adverse pregnancy outcomes was estimated at 100. Because of logistic reasons 79 instead of 100 GDM patients could be included. With this sample size we did not find any relation between SAF and adverse pregnancy outcome, but of course very modest associations could have been missed.
Second, in this study without interference with usual care we had a relative high amount of loss to follow-up, mainly in the control group. This could be due to the fact that patients in the control group sometimes returned to the referring clinic or midwife after a negative OGTT. Therefore these patients could not be followed up in this study. However, we do not expect this loss to follow-up to have influenced our results because an analysis of both groups (lost to follow-up and patients followed during the whole study) did not show any statistical differences.
Third, results of SAF in pregnant women have to be interpreted with caution because it is a new group of patients to be explored. The AGE Reader only measures fluorescent AGEs, and some other fluorescent compounds in the skin could be confounders in this measurement. 15 However, the AGE Reader has been validated with skin biopsy specimens (including fluorescent and nonfluorescent AGEs) in healthy controls, in patients with diabetes, and in patients on hemodialysis, 2,4 and there is no a priori reason to assume that the technique would not be valid in pregnant women.
In conclusion, SAF decreases during normal pregnancy and increases again after delivery. This decrease appears to be overruled by hyperglycemia. SAF is higher in patients with preexistent DM but is comparable in GDM and control patients. SAF was not associated with adverse pregnancy outcome. It is therefore unlikely that the AGE Reader will be of use in daily clinical practice for GDM patients because data from our previous study 13 do not suggest that it can be used to screen for undetected GDM, nor do data from the present study show that it can be used to identify patients at risk for adverse pregnancy outcomes.
Footnotes
Author Disclosure Statement
No competing financial interests exist.