
Abstract
Background:
Balance is sensed through peripheral and central receptors and mediated by central control through the brain and spinal cord. Although some evidence exists as to the areas of the brain involved and how processing of data occurs in young individuals, nothing has been published on people with diabetes. The purpose of this study was to examine the electroencephalogram (EEG) during common sensorimotor and balance training tasks and to relate these to task difficulty.
Subjects and Methods:
Postural sway and EEG change of alpha, beta, and sigma wave bands were measured in 17 young subjects, 10 older subjects, and 10 subjects with diabetes during eight progressively more difficult balance tasks with eyes open and closed, feet in tandem or apart, and on foam or a firm surface.
Results:
EEG power of beta and sigma wave bands showed significant increases on the cortical and parietal areas of the brain relative to the control tasks when eyes were open (P<0.05). The cortical involvement decreased as the task became more difficult with vision and somatosensory information reduced, whereas that of the parietal area increased with task difficulty. The greatest increase was in subjects with diabetes, and the least was in younger people. Individuals with diabetes had increased sigma and beta EEG power in all regions of the brain examined with increased complexity of the balance task.
Conclusions:
This study demonstrated cortical and parietal involvement in static balance tasks commonly used in sensorimotor training. The results support the proposal that there was increased subcortical control with increase in task difficulty in the young subjects, but in subjects with diabetes, there was a major increase in activity across the brain.
Introduction
Muscle weakness in diabetes is common and is correlated to falls. 10 Muscle weakness in people with diabetes can occur globally or in the muscles of the lower limb. 11,12 Muscle weakness can be a predictor of mortality. 12 It is often seen clinically as slow gait and prolonged times in standing from sitting. 8,13 –16
Somatosensory information from the ankle and feet is also important in postural control. 17 It is diminished with aging and especially in diabetes. 8,18,19 Sensory neuropathies in themselves have been linked to not just balance abnormalities but also nonhealing wounds and amputations. 20,21
Numerous studies have related vision to balance. 22 In the elderly, for example, walking in dim light presents false visual cues that lead to poor balance. 8 However, an often overlooked part of the equation is central cortical processing of information. The brain is key as the area where sensory and motor integration takes place. In individuals with diabetes, it is known that central brain cognitive function can be impaired. 23 And yet, no study has examined the electroencephalogram (EEG) of the brain during balance in people with diabetes compared with age-matched or younger controls. It has been assumed that postural control is mediated through subcortical structures such as the vestibular nuclei in the pons and medulla, in the cerebellum, or in the spinal cord reflexes. 24 Studies with infrared imaging, magnetic resonance imaging, and EEG have shown considerable cortical activity in the prefrontal and parietal areas during balance activity. 25 –28 Much of this activity in the upper motor areas of the brain precedes loss of balance or perturbation of balance. 28 However, these data have been collected on older people or younger people with no impairments to gait and balance; studies have not examined patients with diabetes.
The purpose of the present investigation was to examine the EEG activity of the brain during eight standard balance testing and training activities, which ranged from easy to progressively harder to accomplish, and to see if the response in the brain was different in young compared with older people and individuals with diabetes. The sway, measured on a balance platform, 7,9 and the EEG were measured during these activities in young and older subjects and subjects with diabetes.
Subjects and Methods
Subjects
Seventeen healthy young subjects (nine males, eight females) free of headaches, diabetes, and orthopedic or neurological conditions were recruited. In addition, 10 older subjects and 10 subjects with diabetes were also recruited. The general characteristics of the younger subjects are given in Table 1, those of the older subjects in Table 2, and those of the subjects with diabetes in Table 3. Subjects were recruited from among the students and faculty and staff of Loma Linda University and a few people from the community. The diabetes subjects all had type 2 diabetes that had been diagnosed between 9 and 15 years ago. The small SD of the hemoglobin A1c level shows that subjects were similar in glycemic control. Subjects were sedentary individuals who did not participate in any regular balance exercises. Subjects were instructed not to take any medication or central nervous stimulants that might affect their balance the day before the study. All subjects were right dominant, and there was no statistical difference in weight or height, just in age. The experimental protocol, approved by the Institutional Review Board of Loma Linda University, was explained to each subject, and the subjects gave their written informed consent for the study.
Data are mean±SD values.
Data are mean±SD values.
Data are mean±SD values.
HbA1c, hemoglobin A1c.
Measurement of postural sway
The displacement of the subject's center of pressure was measured using a balance platform of 1 m×1 m in size and 0.1 m in height. Four stainless steel bars, each with four strain gauges, were mounted at the four corners under the platform (TML strain gauge FLA-6, 350-17; Tokyo Sokki Kenkyujo Co., Ltd., Tokyo, Japan). The output of the four Wheatstone strain gauge bridges was amplified with BioPac Systems (Goleta, CA) model 100C low-level biopotential amplifiers and recorded on a BioPac MP-150 system through a 24-bit A/D converter. The sampling rate was 2,000 samples per second. 7
To calculate the load and the center of the pressure of the force on the platform, the output of the four sensors was used to measure the x- and y-coordinates of the center of gravity of the subject. These data were converted to a movement vector giving a magnitude and angular displacement. By averaging the vector magnitude over 6 s, mean and SD values were obtained for this measure. From this, the coefficient of variation was calculated ([SD/mean]×100) as a measure of the postural sway. 29 The average coefficient of variation of each task was then determined by averaging the coefficients of variation of the three trials. Shoes were left on during the measurements.
Measurement of cortical response
The B-Alert® X10 wireless EEG nine-channel headset (Advanced Brain Monitoring Inc., Carlsbad, CA) integrated with the Acknowledge MP-150 acquisition software (BioPac Systems) was used to acquire the EEG data from three channels (Fz, Cz, and Pz). Linked mastoids were served as reference, and electrode impedance was kept below 40 kΩ. The sampling areas are shown in Figure 1.

Typical electrode positions for electroencephalography as per standard configurations. The electrodes sampled here were Cz, Fz, and Pz.
The data were sampled at a frequency of 256 samples per second and were filtered with a band-pass filter (0.5–65 Hz) before the 16-bit analog-to-digital conversion was used. Notch filters at 50, 60, 100, and 120 Hz were applied to remove environmental artifacts. Eye blinks and excessive muscle activity were identified and decontaminated by the system.
All uncontaminated EEG data for each task were epoched into 1-s blocks with B-Alert software version 2.90 (Advanced Brain Monitoring). The absolute power spectral densities of alpha (8–12 Hz), beta (13–19 Hz), and sigma (30–40 Hz) frequency bands were computed for each task using a fast Fourier transform with a 50% overlapping Kaiser window. This value was then divided by the absolute power spectral density of the corresponding frequency band in the control task. This provides the percentage of the power spectral density of each frequency band relative to the control task in each individual task. The average power spectral density was then computed using the data from the three trials.
Balance tasks
Eight quiet standing balance tasks, each lasting for 6 s, were included in this study.
30
To challenge the somatosensory input, two different feet positions (feet apart and tandem) and two different surface compliances (firm surface and foam) were used. To challenge the visual input, two levels of vision (eyes open and closed) were used in the balance tasks. An Aeromat balance block 16×19×2.5 inches (AGM Group, Aeromat Fitness Products, Fremont, CA) was placed on top of the balance platform and was used as the foam surface. The eight balance tasks were: • Standing with feet apart on a firm surface with eyes open and eyes closed • Standing with feet in tandem on a firm surface with eyes open and eyes closed • Standing with feet apart on a foam surface with eyes open and eyes closed • Standing with feet in tandem on a foam surface with eyes open and eyes closed
Procedures
Baseline demographic data including age, height, weight, and side of dominance were collected from each subject at the beginning of the study. The B-Alert X10 wireless EEG nine-channel headset was placed on the skull. Bilateral mastoids were linked as reference. Electrode impedance was then checked. Subjects started with the control task, in which they stood with feet apart on the balance platform for 6 s. Their feet were aligned with the centers of the calcaneus the same distance as that of the two anterior superior iliac spines. They were instructed to fix their eyes on a target on the wall with arms crossed in front of their chests. The task was repeated three times. Thereafter, the subject was randomized to the rest of the balance tasks on the firm surface. Then an Aeromat balance block was placed on top of the balance platform, and data were collected during the randomized balance tasks on the foam. The subjects all had type 2 diabetes that had been diagnosed between 9 and 15 years ago. The small SD of the hemoglobin A1c level shows that subjects were similar in glycemic control.
Data analysis
Data were summarized using descriptive statistics. For the data on postural sway, repeated-measures analysis of variance was used to examine the differences of the postural sway among the balance tasks, and Bonferroni's test was used to test for significant differences. For the EEG data, the Friedman test was used to examine the differences of the power of the brain waves among the eight balance tasks, and the Wilcoxon signed ranks test was used to assess for significant differences. The results were considered significant at P<0.05.
Results
The coefficient of variation of sway with the eight balance tasks is shown in Figure 2. There was little sway in the young subjects except for feet tandem eyes closed and foam feet tandem eyes closed. Although sway here was significantly higher than for the easiest condition, feet apart, firm surface, eyes open (P<0.05), the increase in sway, even under the worst condition, was just more than double that of the easiest position. In contrast, for the older subjects, sway was significantly higher at rest and under all conditions where they stood on foam compared with the younger subjects (P<0.05). For the subjects with diabetes, sway was greater than for the younger subjects for all eight conditions (P<0.05). It was greater in the subjects with diabetes for the closed eye condition on a firm surface and all foam conditions compared with the older subjects (P<0.05). Thus the eight balance tasks represent increasing sway and complexity of task from simple standing feet apart (control task) to the hardest task, standing on foam with feet tandem, eyes closed, as shown by the increased sway.
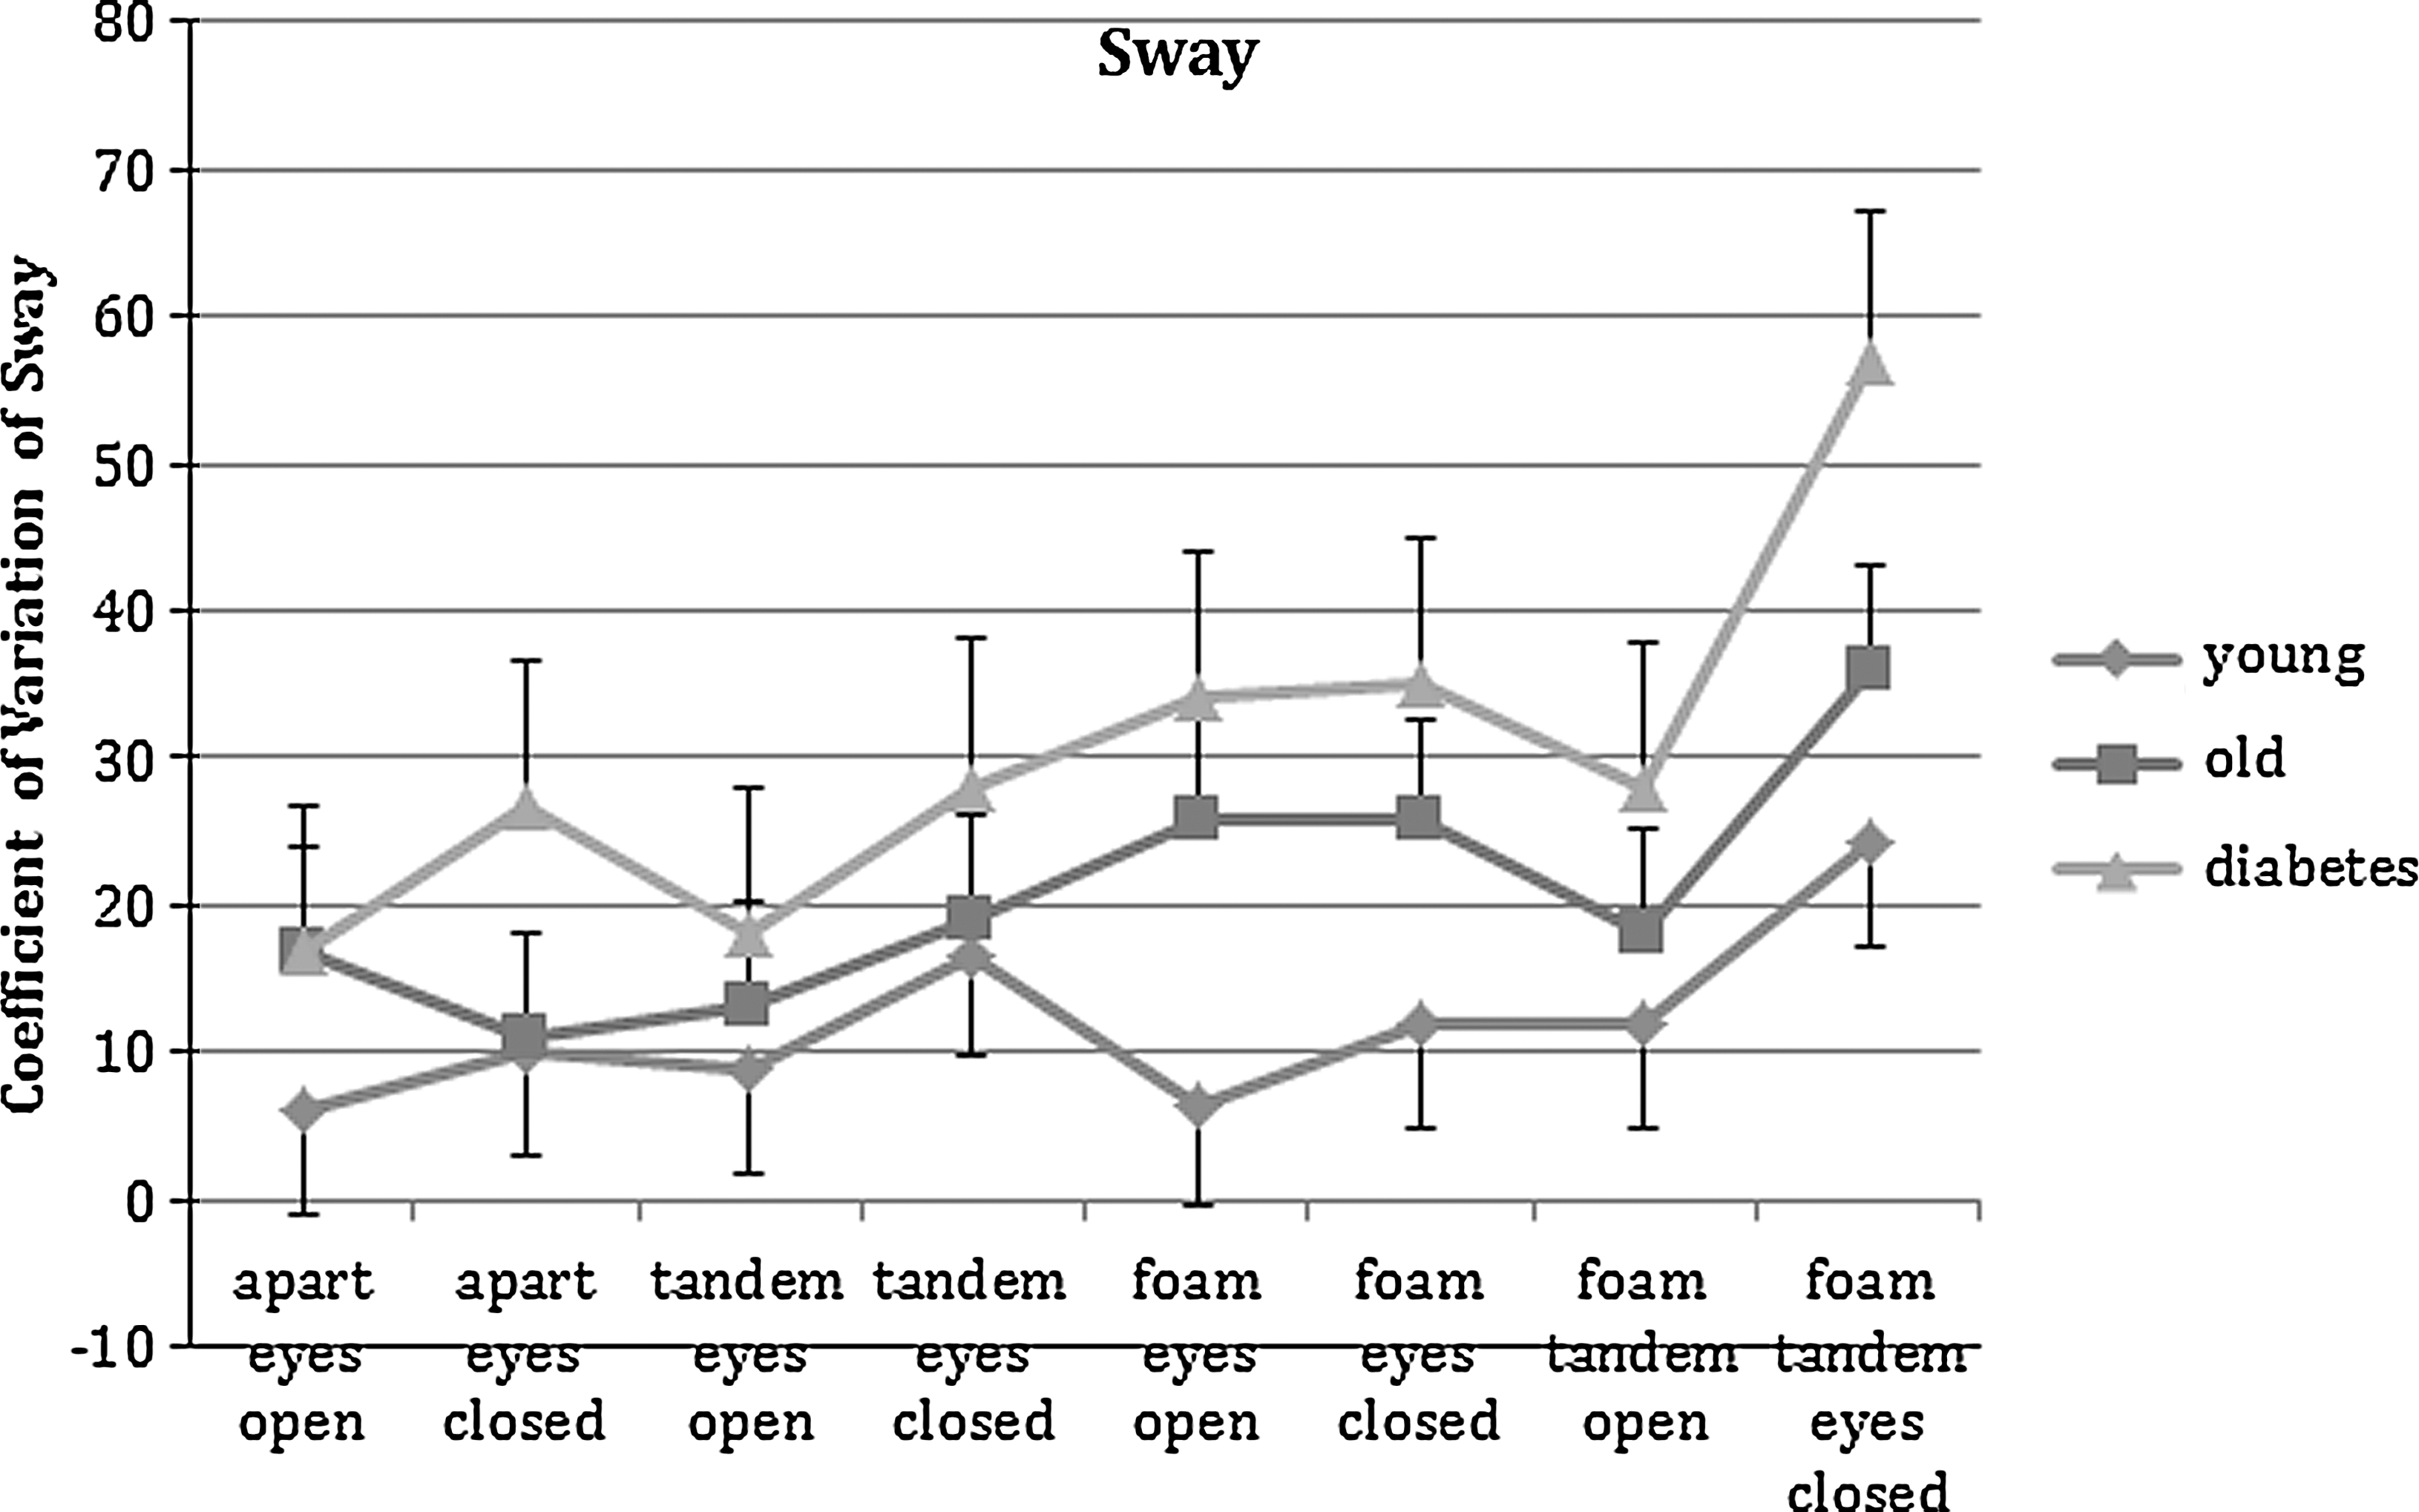
Coefficient of variation of postural sway for each of the eight balance tasks in the young group, the old group, and the group with diabetes. Data are mean±SD values.
Concerning the EEG activity, a typical record is shown in Figure 3. Looking at the easiest compared with the most difficult tasks, even in this young subject, a clear increase in EEG activity can be seen with the more difficult tasks. The three spectral components of each wave are shown on the right side of Figure 3. For the parietal areas of the brain, for older and younger subjects, there was no relationship between balance task complexity and the EEG power in the alpha and beta frequency bands. However, for the subjects with diabetes, power significantly increased in all parietal bands as described below with increased sway due to increased complexity of the balance tasks. The same was true of the cortical EEG where there was no significant difference in alpha and beta power in the young and older groups with increasing balance task complexity, whereas it did increase significantly for all bands with balance task complexity in the diabetes group. Cortical activity was not related to the complexity of the balance tasks in the younger and older subjects. To simplify the presentation of the data, Figures 4 –6 show characteristic group results only where EEG power was related to balance.
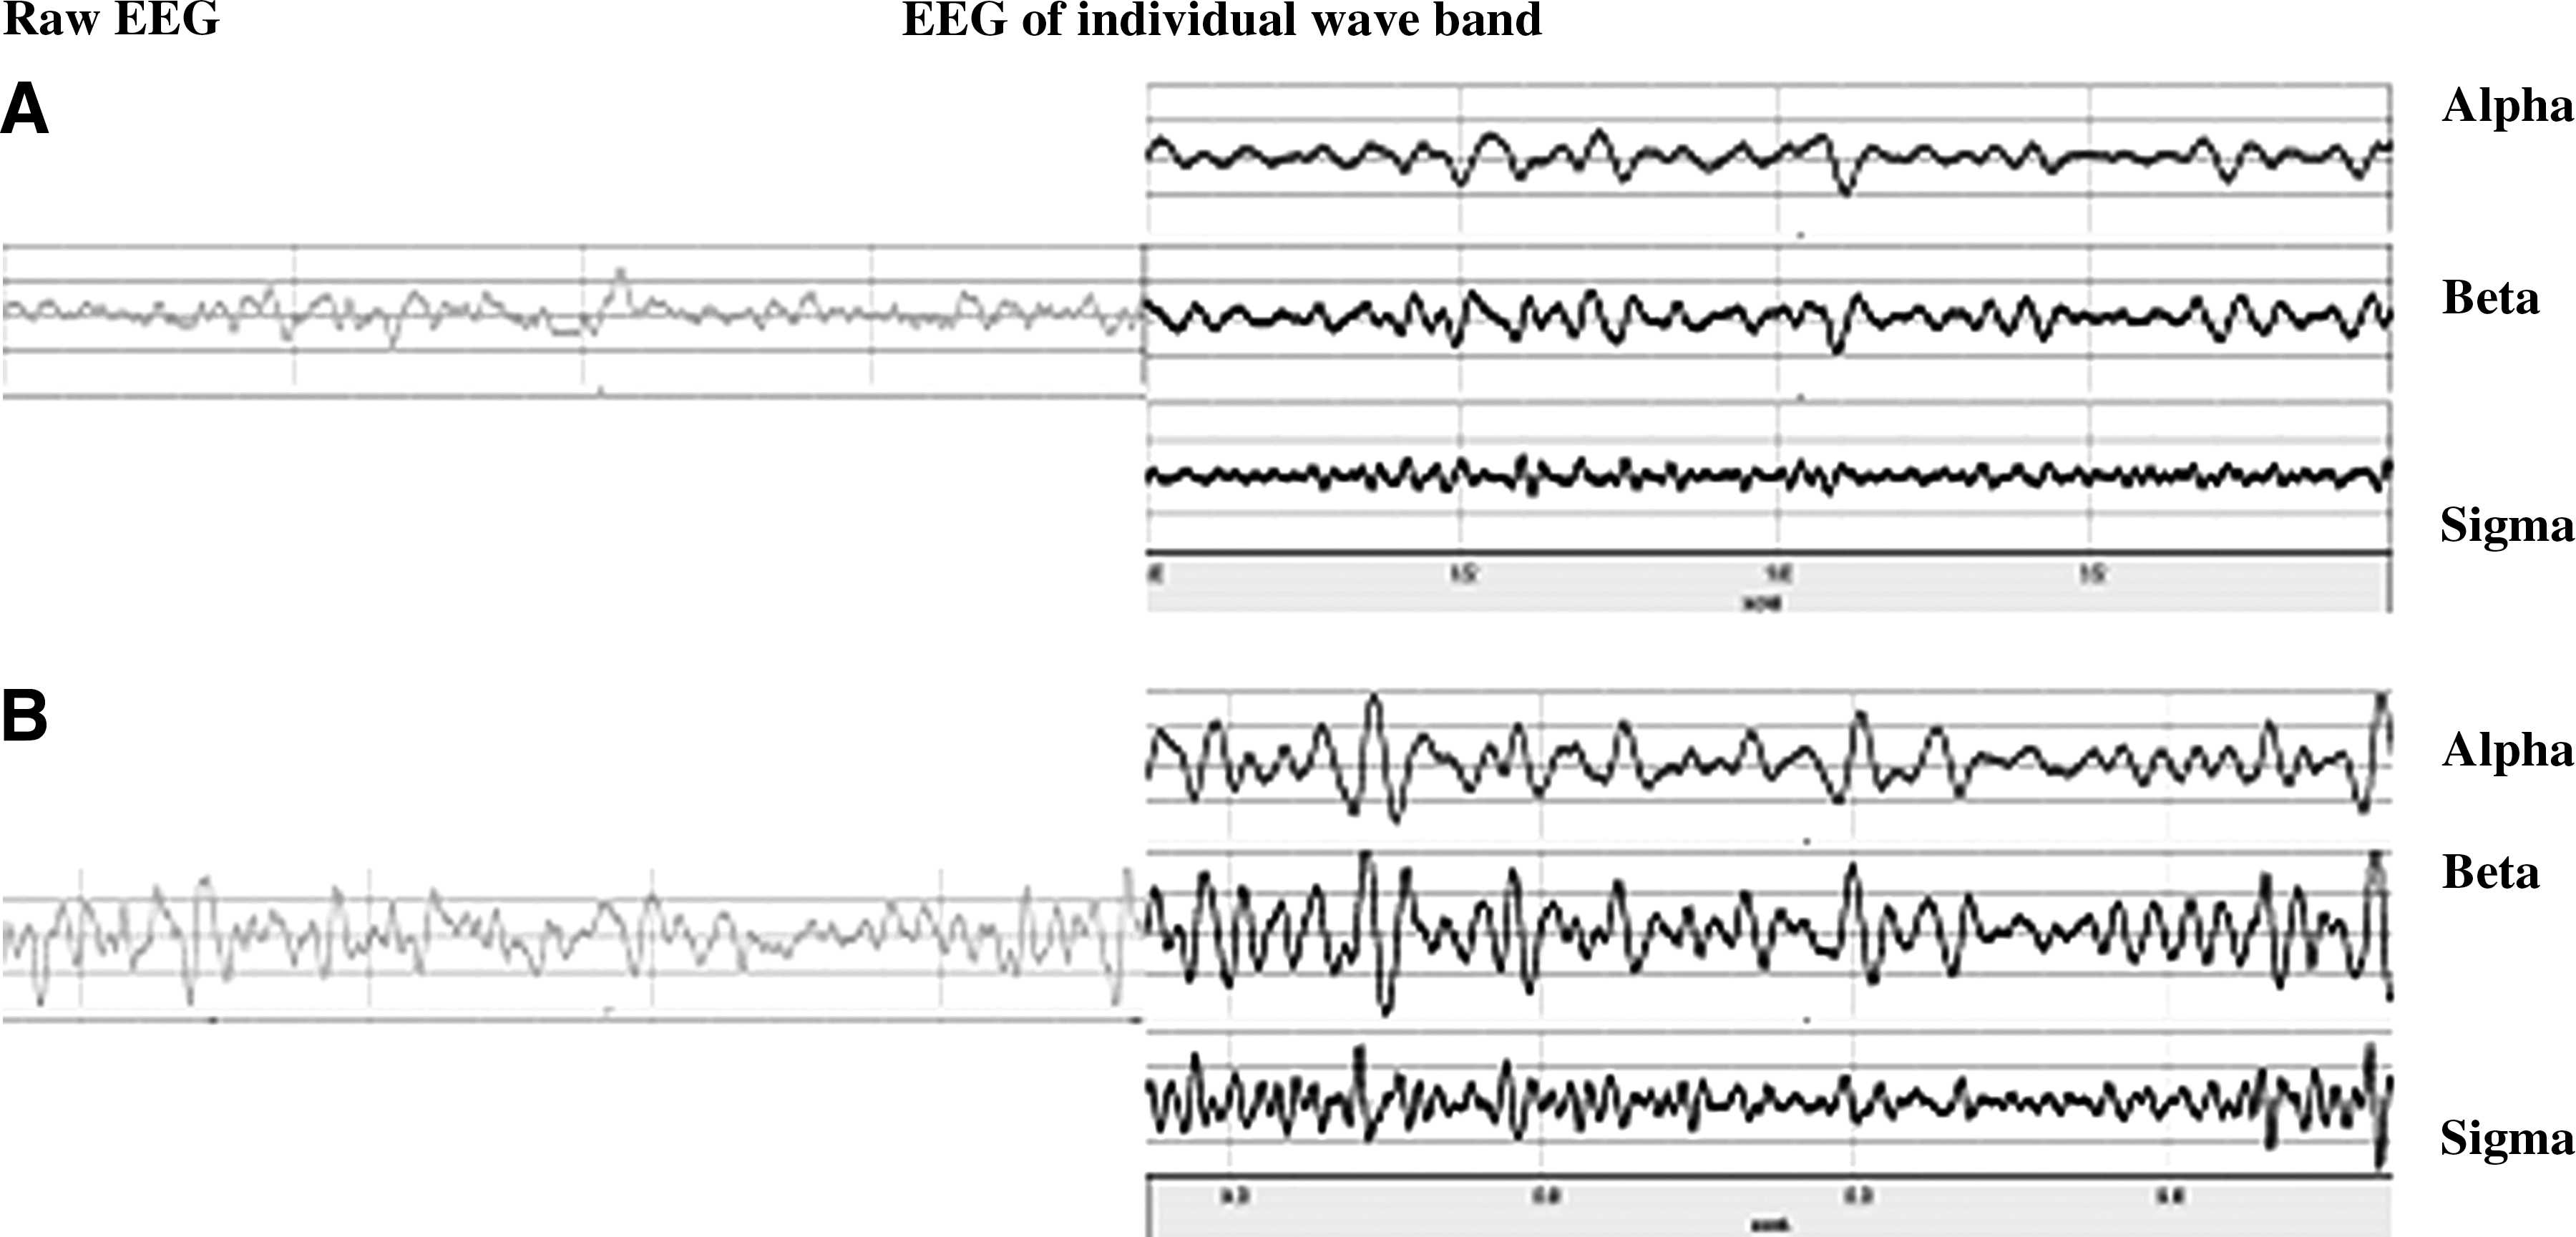
Electroencephalogram (EEG) activity at Pz during the least difficult balance task,
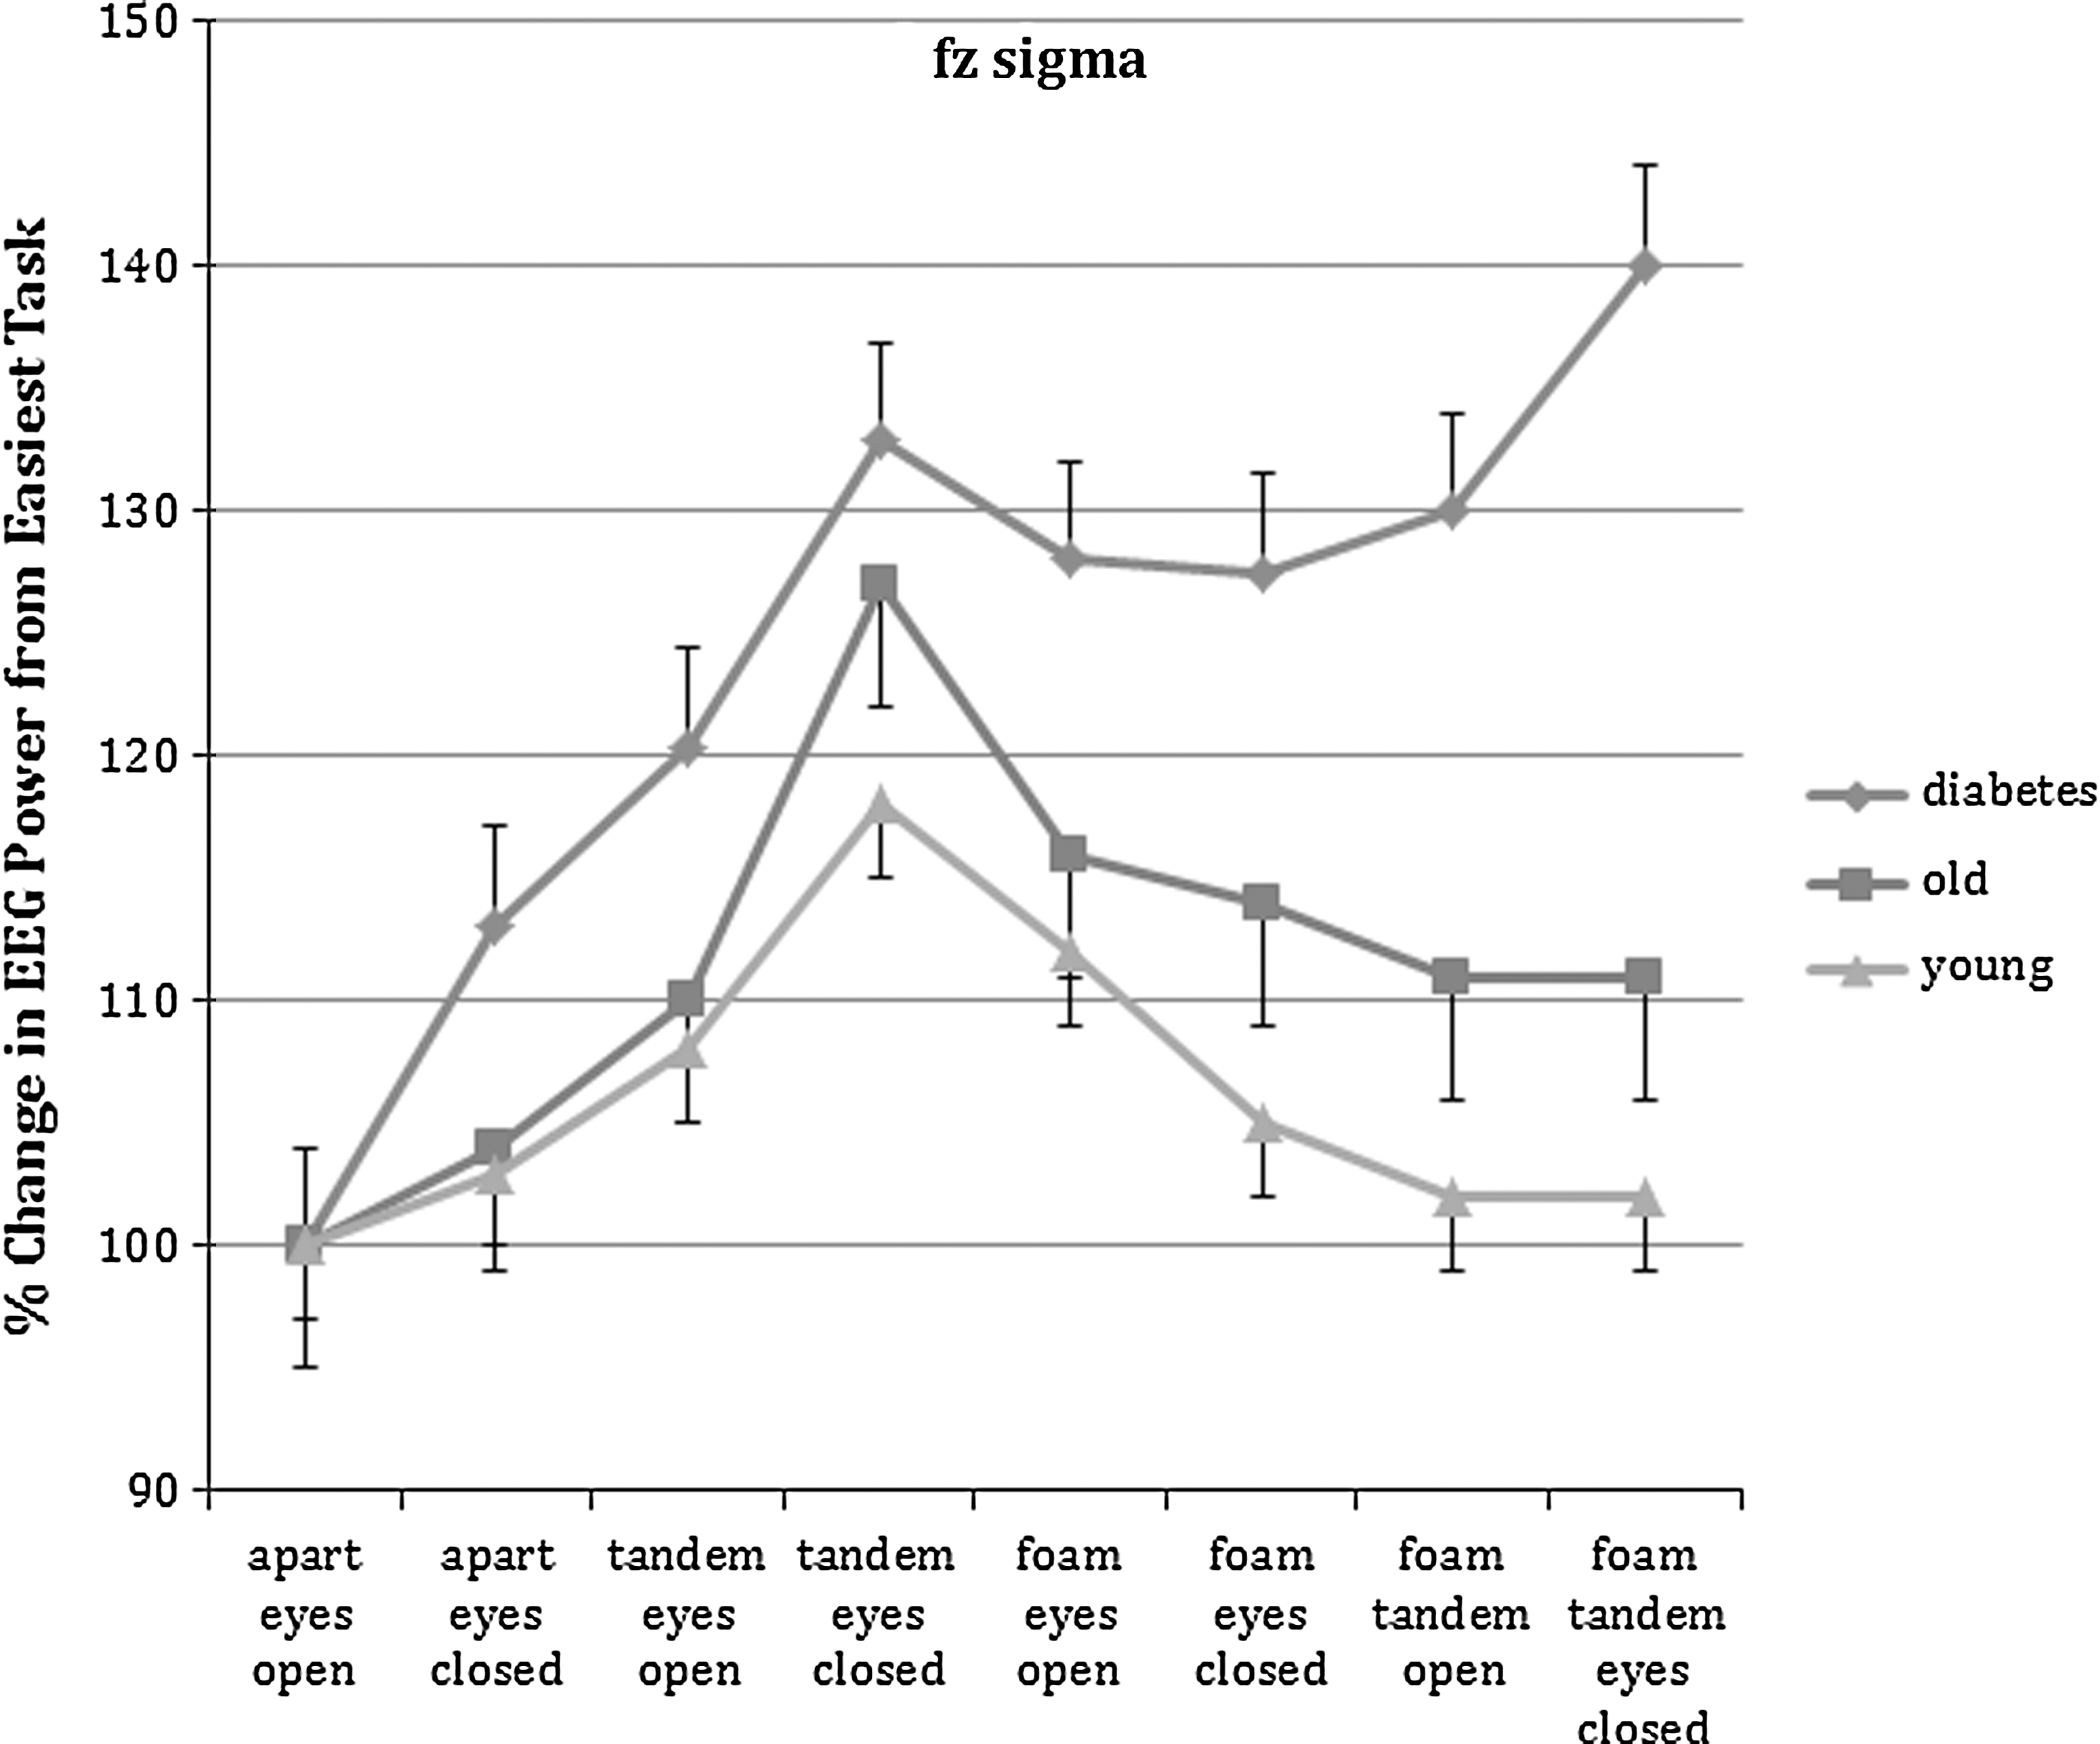
Results for all three groups of subjects for the sigma band of the frontal lobe during each of the eight balance tasks. Data are mean±SD values. EEG, electroencephalogram.
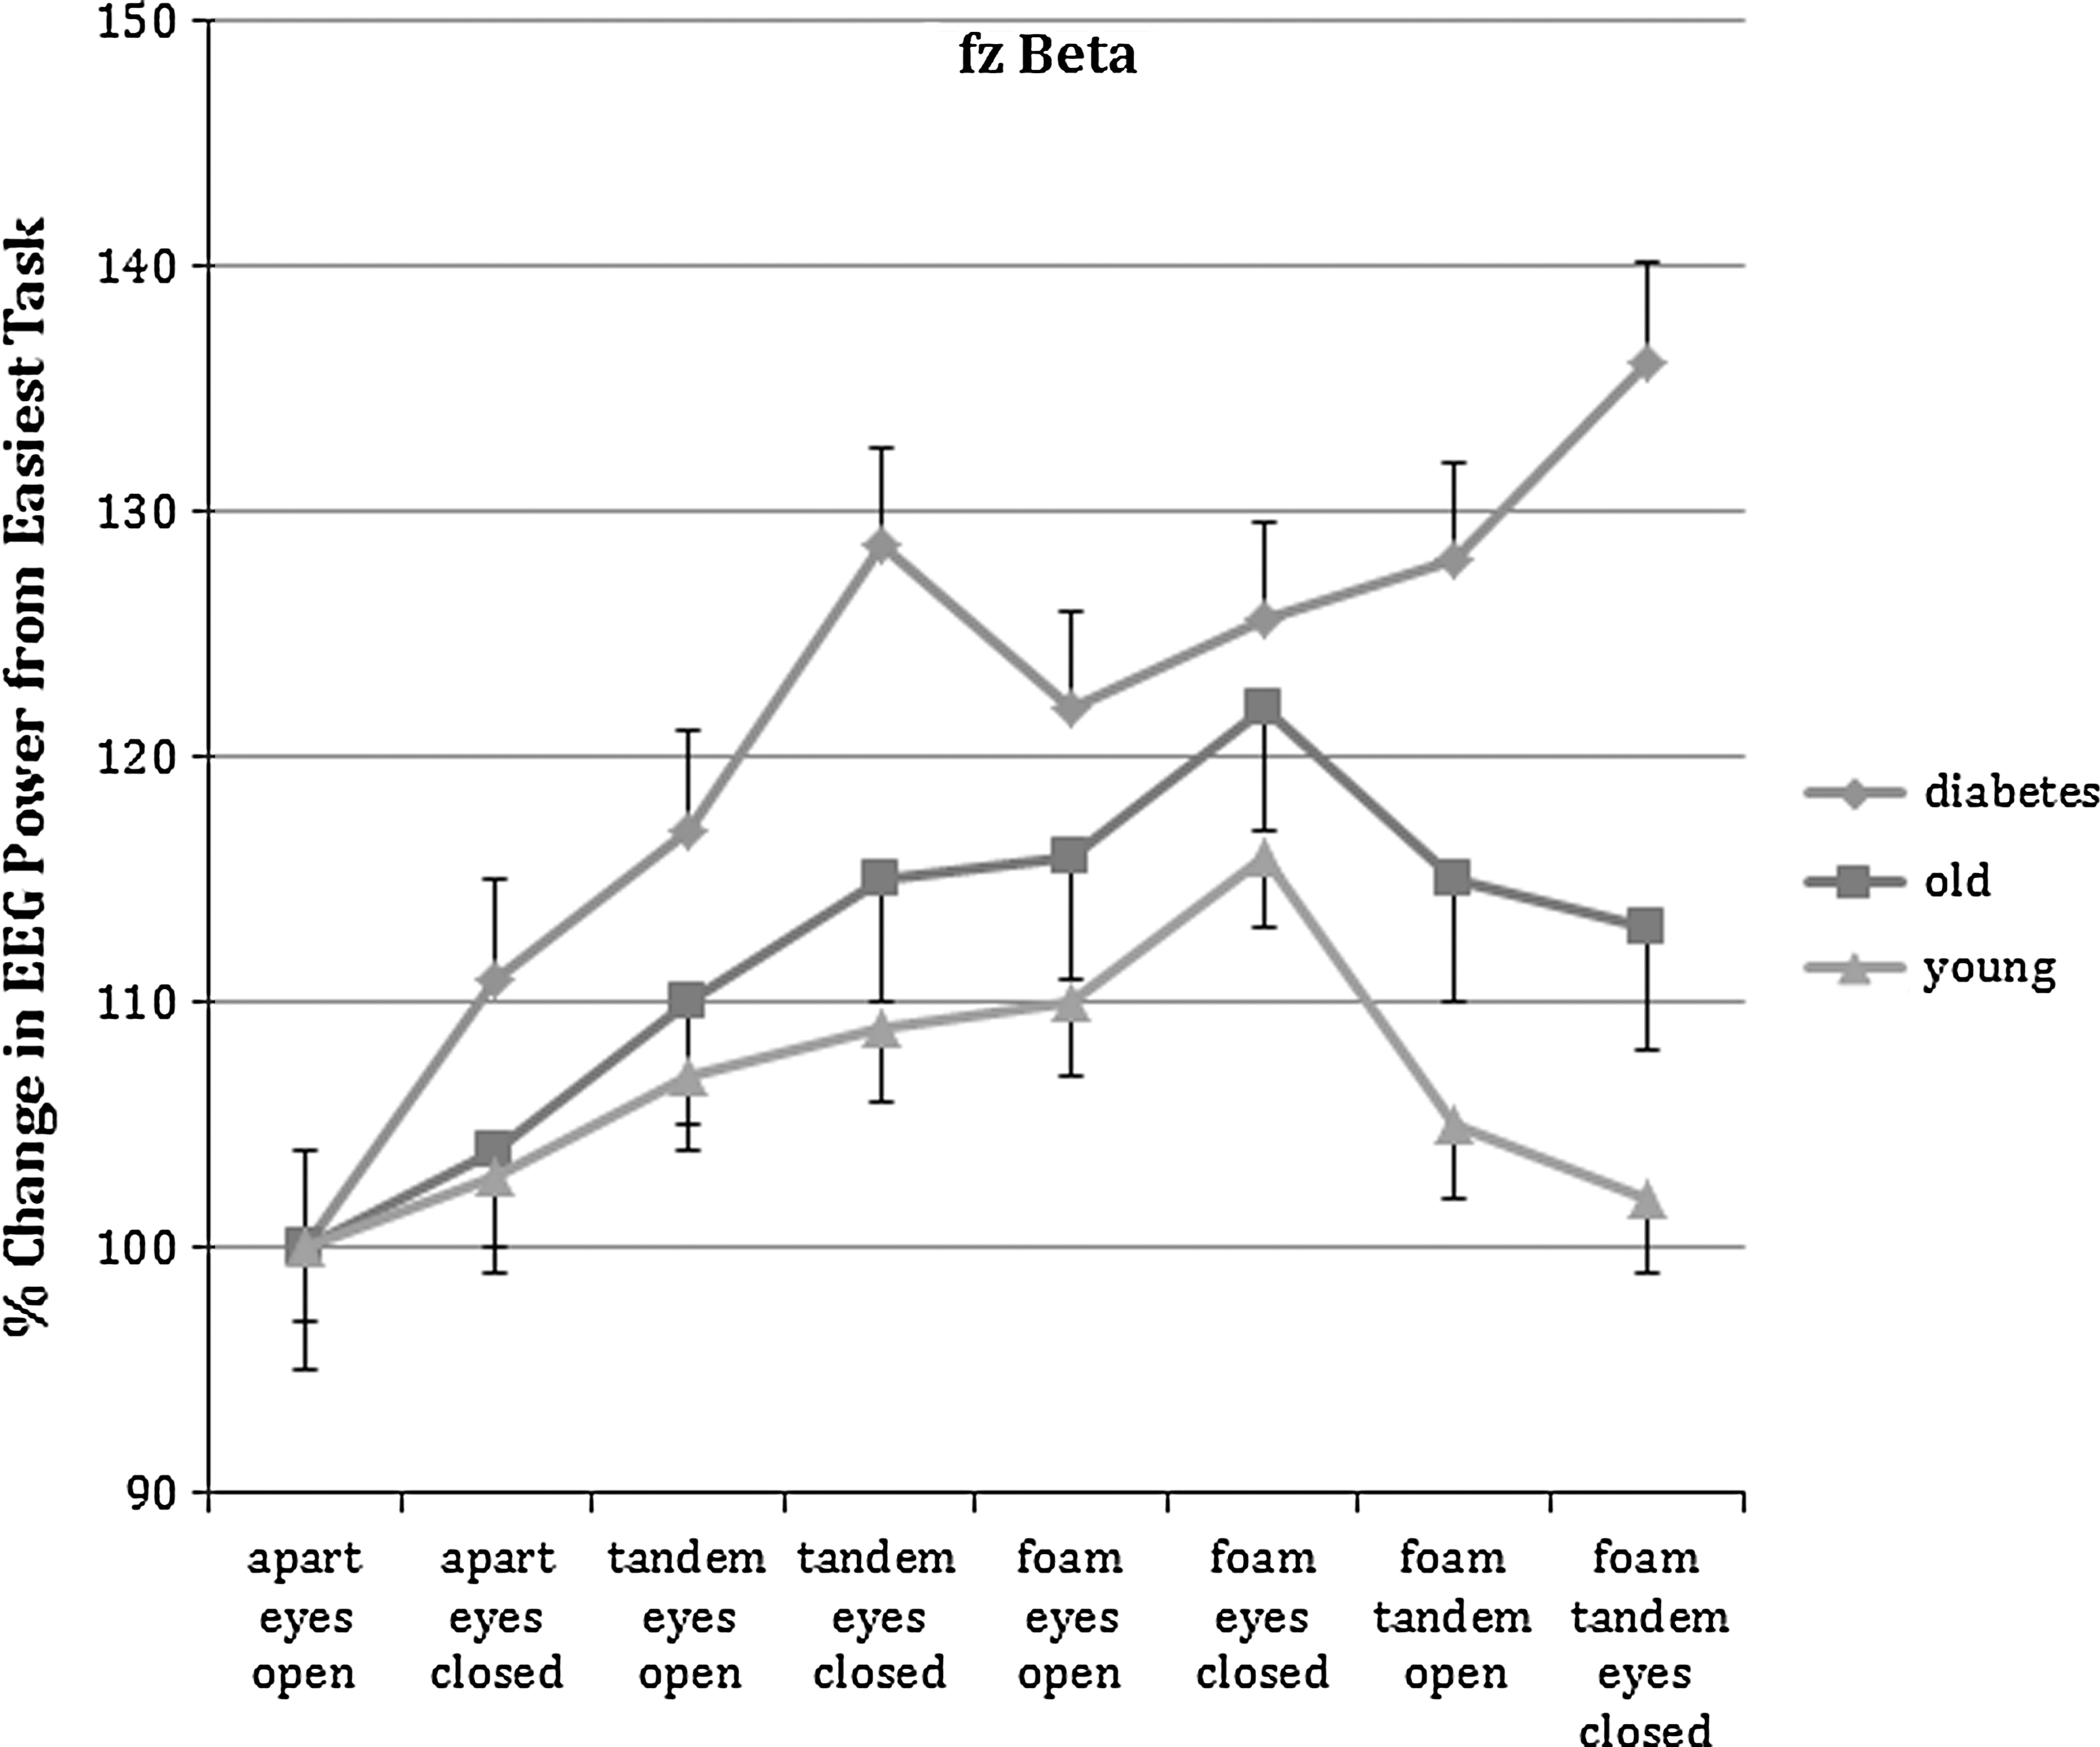
Results for all three groups of subjects for the beta band of the frontal lobe during each of the eight balance tasks. Data are mean±SD values. EEG, electroencephalogram.
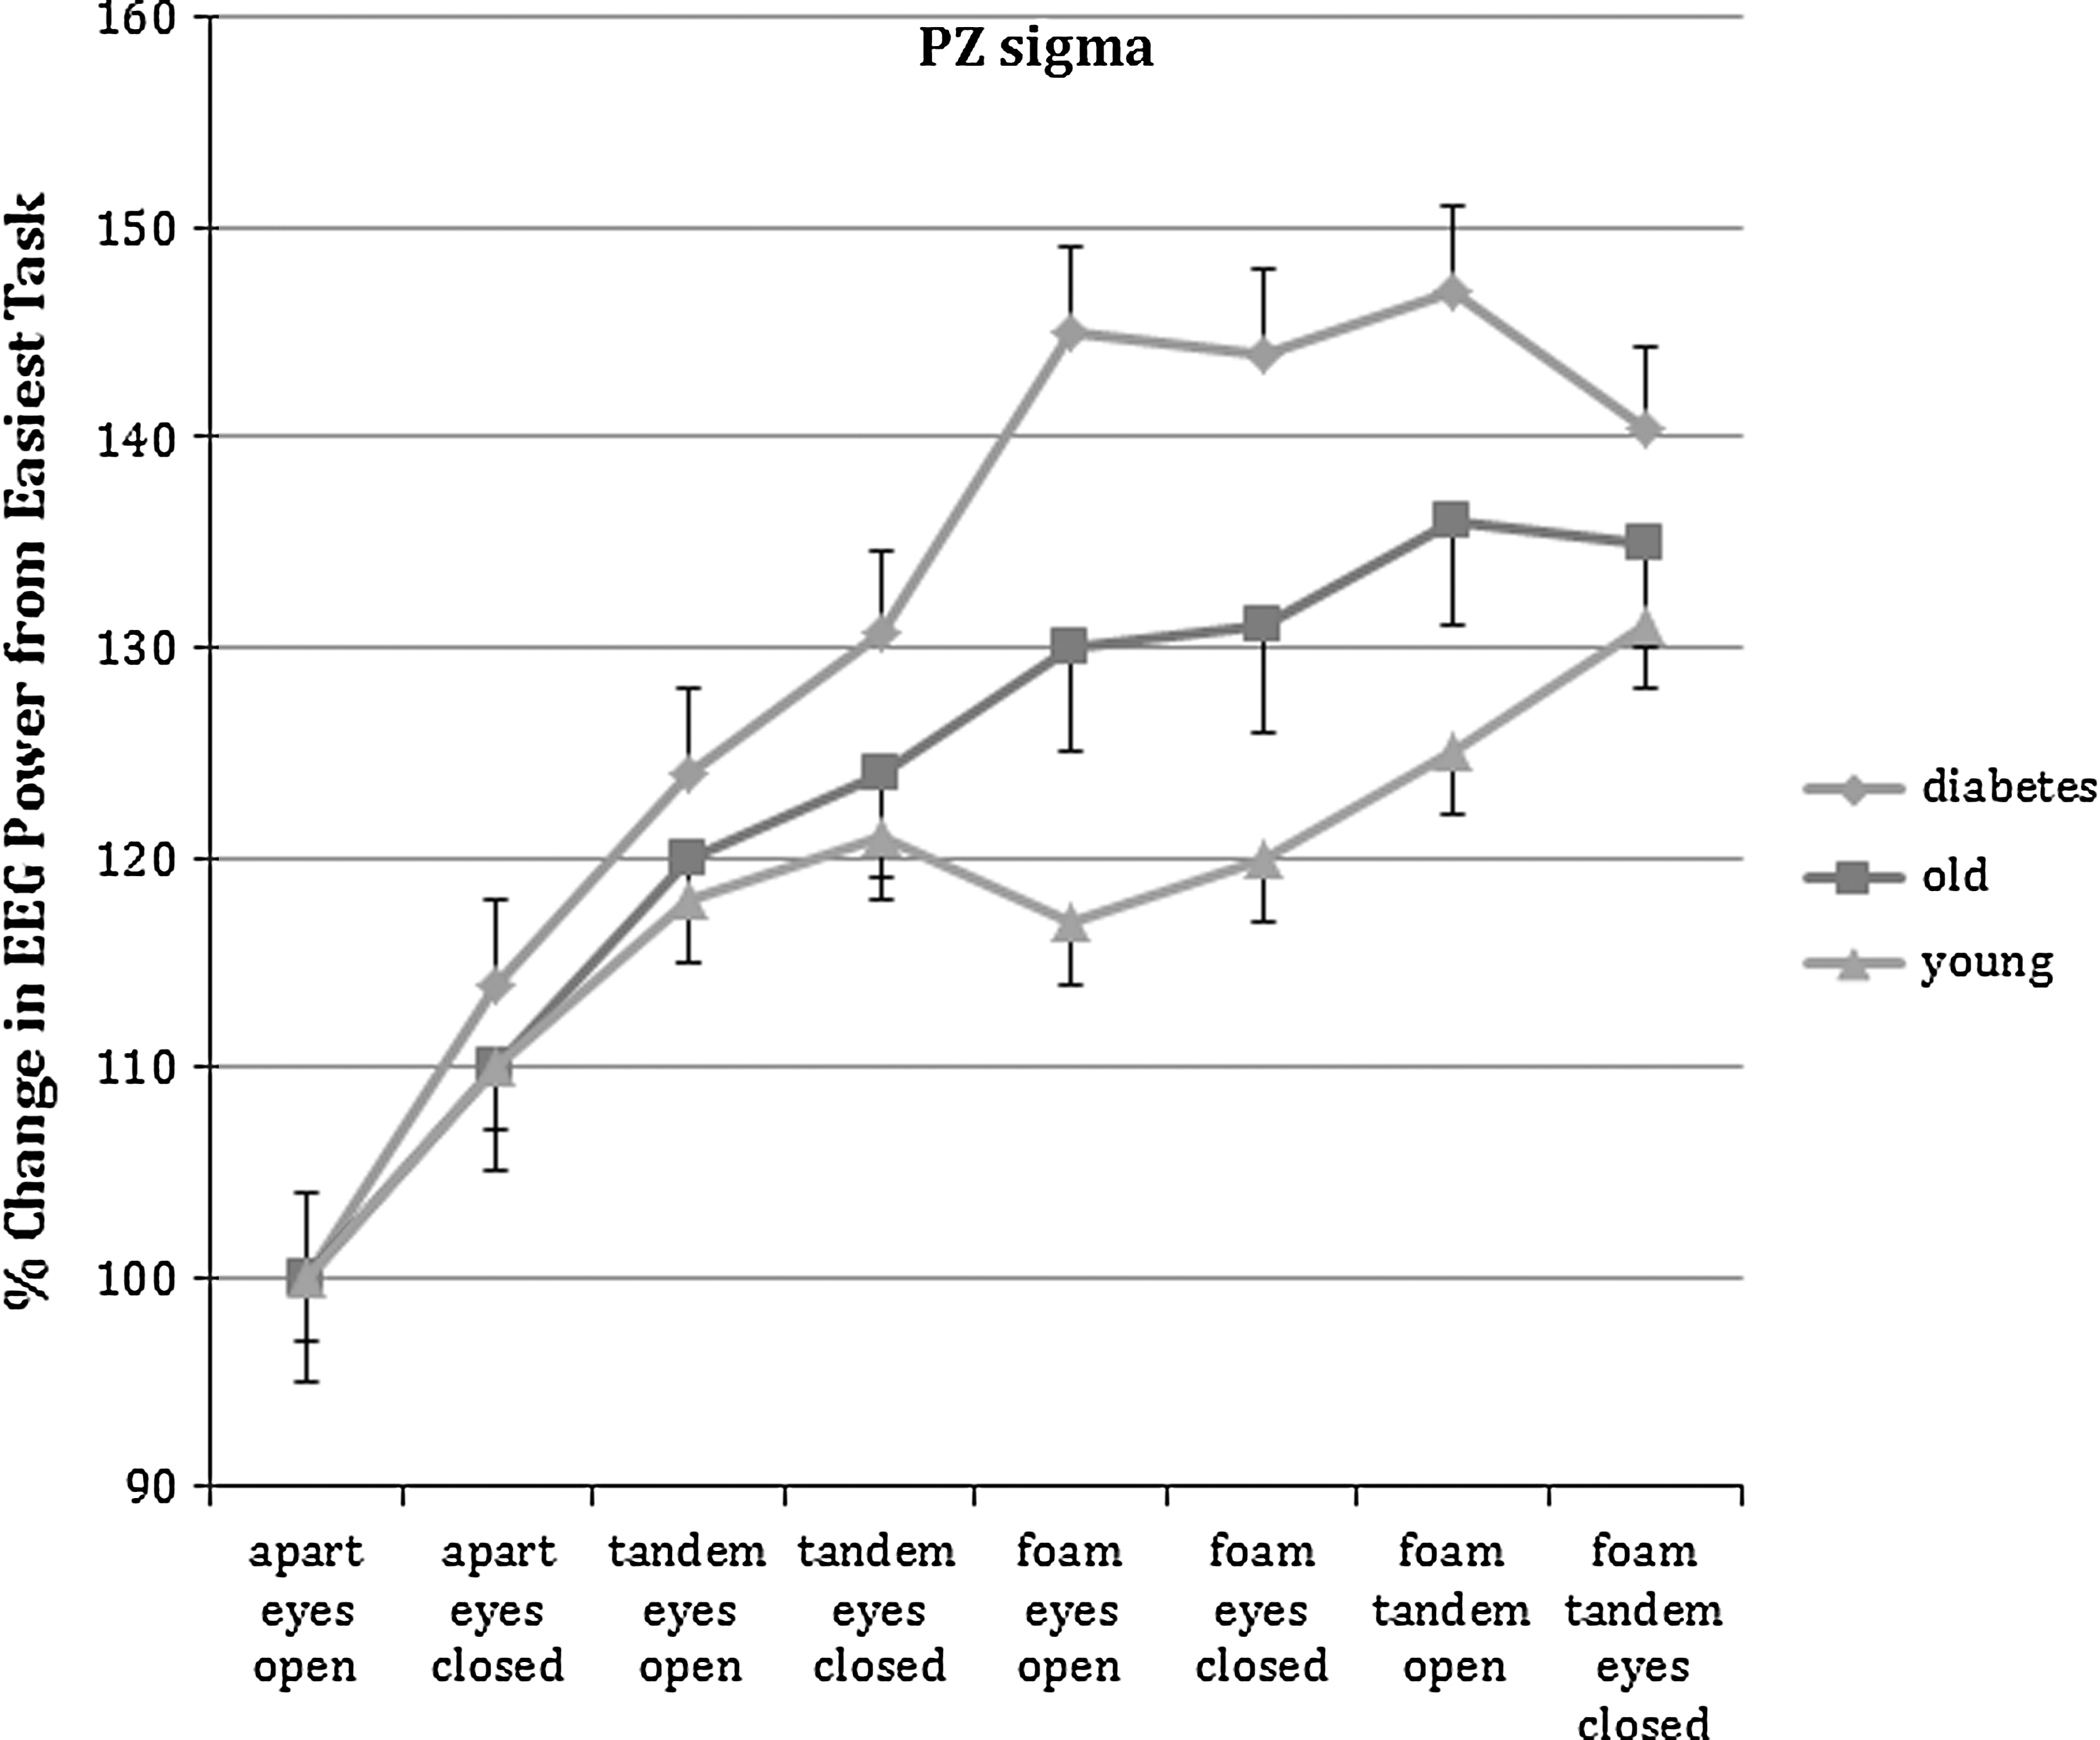
Results for all three groups of subjects for the sigma band of the parietal lobe during each of the eight balance tasks. Data are mean±SD values. EEG, electroencephalogram.
There is a strikingly similarity between Figures 4 and 5. For the young group, power for the beta and sigma bands of the EEG increased with the task complexity on a firm surface. However, the power was reduced on a foam surface even with the eyes closed. For the five most difficult tasks, EEG power was greater in the older than younger subjects (P<0.05). For the six most difficult tasks, power for both groups was significantly greater than for the baseline task, feet apart standing on a firm surface (P<0.05). But for the frontal area, for the subjects with diabetes, power was always higher for all tasks above the baseline balance task for all seven tasks than for the younger subjects (P<0.05), and for the four most difficult tasks (standing on foam, power for beta and sigma power bands actually increased and was significantly higher than in the other groups of subjects who showed a decrease in power (P<0.05).
For the parietal area of the brain (Fig. 6), alpha, beta, and sigma powers (sigma is shown in Fig. 6) increased with increased balance complexity. However, as cited above, the diabetes subjects showed significantly more power than the older and younger subjects (P<0.05).
Discussion
Balance is not just for standing, but it is an integral part of gait. 31 During gait, the visual fields are continually changing as well as the center of mass of the body relative to the base of support. 6,8,32 As such, impairment of the visual, vestibular, and somatosensory systems can result in increased postural sway and a loss of balance, resulting in falls. 33 –37 In the elderly, falls are a leading cause of morbidity and mortality. 1 In people with diabetes, the impairments in all three systems make the likelihood of falls even more extreme. 4,8,10
Visual impairment usually causes increased sway. 6,38 In the young, they are able to compensate for loss of a single stressor such as vision, but in the elderly or people with diabetes, vision is critical. 24,31,39,40 Even walking or standing in dim light, for people with diabetes, increases sway. 8 The data in the present investigation, then, agree with previous data in that under conditions of eyes closed, sway was greater in the older group and even greater in the group with diabetes. 22 In a recent review by Allum, 41 when two stressors were changed (e.g., standing on foam and with eyes closed), it was progressively harder for all three groups of subjects, but the worst group was the group with diabetes. When standing tandem on foam with eyes closed, the younger subjects could still maintain balance but with greater postural sway; the subjects with diabetes only lasted less than 3 s before they fell. This also agrees with earlier studies showing the fact that people with diabetes have impairment in the visual, vestibular, and visual systems making balance tenuous. 42,43
Although the results presented here on sway confirm findings of other studies on balance in the elderly and people with diabetes, what is new here is the EEG analysis from the brain during balance in these three groups of subjects. For the younger subjects, EEG power spectral density increased as the complexity of the task increased above the parietal area of the brain. However, the increase was significantly smaller than that seen in the older and subjects with diabetes, showing more complex data processing in this area of the brain. In contrast, for the younger subjects and older subjects, in the frontal area, there was an increase when one variable was changed (eyes closed or tandem standing), but when the tasks involved more complex stressors standing on foam, EEG power decreased for the beta and sigma bands. This probably shows a shift to lower areas of the brain such as the vestibular areas in the brainstem for these complex balance tasks and reliance on these vestibular centers and the cerebellum to maintain balance. 44 Because the secondary locomotor center in the pons and medulla control the core muscles in the body, 45 this would make sense to increase core activity to stabilize the body. For the parietal area of the brain, power continued to increase with the complexity of the balance tasks for all spectral bands.
This was not true for the subjects with diabetes. Here the EEG power increased in all areas of the brain that were measured as balance tasks were more complex. This may show a lack of ability to data process in the upper brain and shift to the lower brain centers due to lack of sensory input, simply confusion on how to balance, or damage to the vestibular centers as has been shown with diabetes. 46 There appears to be increased dependence on the eyes for balance in individuals with diabetes such that in low light or no light conditions balance becomes very difficult. 8 This incorrect data processing with diabetes resulted in an ability of <3 s to stand for the most complex balance task, leading in real life to falls.
The increase in EEG across the brain during increased complexity of balance tasks may be related to central impairment of cognition due to poor glycemic control. 47 Studies have shown that better glycemic control causes changes in the EEG and cognitive ability in people with diabetes. 48 In particular, hypoglycemic episodes alters the alpha and beta frequency components of the EEG. 48 It is probably no surprise then to see these major differences in the EEG response to balance tasks.
One possible cause of the reduced ability to process data in the brain and achieve balance in people with diabetes is the increase in free radicals found in older people and people with diabetes. 49 Oxidative stress associated with aging and diabetes causes impairment in cognitive ability in the brain. 50,51 Thus, the use of antioxidants has been shown to increase cognitive ability in older subjects. 52 It is possible that some of the impaired balance data processing may be due to high oxidative stress. This might be helped by taking antioxidants. Vitamin D administration has been shown to also increase brain cognitive ability and may also alter balance in older people and people with diabetes. 53 Vitamin D has been shown to be inversely related to the incidence of falls. 54 –56 Part of the reduction in falls with vitamin D supplementation may be related to reduced loss of muscle mass with vitamin D supplements. 57 The vitamin D receptor is found in muscle tissue. 54 The effects of nutritional supplements on EEG and balance in older people and people with diabetes need to be investigated.
In summary, although previous studies have identified the balance risk for people with diabetes, the contribution of central brain data processing has never been shown. It is possible that EEG may provide a useful paradigm for balance training in people with diabetes or be used to identify people at high risks of falls; further investigation of this is warranted, as is the effect of glycemic control or lack thereof on central data processing.
Footnotes
Author Disclosure Statement
No competing financial interests exist.