
Abstract
Background:
Skin changes in diabetes mellitus (DM) include possible increases in foot skin water content as interpreted from altered echogenicity in high-frequency ultrasound images. The present goal was to investigate the possibility of undetected increased local skin water in persons with DM using a handheld portable rapid measuring device that measures the tissue dielectric constant (TDC) as an indicator of skin tissue water.
Subjects and Methods:
TDC measurements were done bilaterally on 18 persons with DM and 18 persons without DM (NODM) at foot dorsum and anterior forearm to tissue depths of 0.5, 1.5, and 2.5 mm. DM duration was 11.1±10.9 years. Age, body mass index, and blood pressures were not significantly different between groups.
Results:
NODM and DM TDC values decreased with increasing depth at forearm but were depth independent at foot dorsum. All DM foot TDC values were significantly (P<0.05) greater than for NODM, with foot TDC values at 2.5 mm depth being 14.8% greater than in NODM. DM forearm TDC values were not significantly greater than NODM.
Conclusions:
A technology that characterizes local skin water in a rapid and noninvasive way has been used for the first time in persons with DM. The greater TDC value at the foot dorsum of the DM group is consistent with the presence of previously unrecognized increased fluid content. This suggests that there may be benefit utilizing this measurement method as a way to screen for early changes in foot skin features that may tend to cause DM-related edema.
Introduction
For this purpose skin tissue water was assessed using a noninvasive measurement of the skin tissue dielectric constant (TDC) at a frequency of 300 MHz at the foot dorsum of persons with and without DM. The skin TDC as an index of tissue water is well documented 11 –16 and has been extensively used in the assessment of edema and lymphedema and other aspects of skin water and its change 17 –21 but has never to our knowledge been used in persons with DM. In the present case the choice of this measurement method was in part guided by prior studies regarding the nature of water's structure within skin. In normal skin, near-infrared Raman spectroscopy has demonstrated that most skin water, perhaps as high as 90%, is considered to be bound water 22 in the sense that water molecules are hydrogen bonded to biomolecules, mainly proteins. This is true in skin of young 22 and older 23 healthy individuals. This bound water is to be distinguished from free water 24 in which water molecules are bound to each other and is significantly more mobile within the interstitium. Because TDC values measured at 300 MHz are sensitive to both free and bound water contained within the measured tissue volume, 15,25,26 its value is an excellent index of total tissue water.
Subjects and Methods
Subjects
Measurements were done on 36 volunteer subjects: 18 with DM (DM group) and 18 age-matched NODM subjects (NODM group). All participating subjects signed a university-approved informed consent prior to entry into the study. Because the current study was viewed as a pilot study the inclusion criteria were fairly broad. The criteria for inclusion of persons with diabetes were that they had been diagnosed as having either type 1 or type 2 diabetes not less than 5 years ago. The inclusion criterion for the control group was the absence of diabetes. Exclusion criteria for both groups were the presence of any implanted wires or electronic medical devices and the presence of any open wounds anywhere on the lower extremities. The number of subjects recruited for the study was limited by a 3-month experimental window based on availability of equipment and personnel. Entry of the patients into the study was not dependent on concomitant conditions or on their medications. However, subsequent to their evaluation patients who had a concomitant condition likely to cause edema or who were taking any medication known to have potential edema-producing effects were flagged. Of the 18 DM patients none had a co-morbidity with a likely edema-producing effect, but seven patients were taking medications that were potentially peripheral edema producing; three patients were taking pioglitazone (Actos®; Takeda Pharmaceuticals U.S.A., Deerfield, IL), two were taking amlodipine, one was taking diltiazem, and one was taking sitagliptin (Januvia®; Merck Sharp & Dohme, Whitehouse Station, NJ). On the day of the study, but prior to TDC measurements, patients were evaluated by their attending physician as to the presence of lower extremity edema. Edema assessment was done by checking for edema in the lower legs and rated for severity using the 1-2-3-4 rating system. Results of these assessments were at the time of TDC measurement unknown to the investigator making the TDC measurements. Two patients were rated as having 1+ edema.
The DM group comprised 16 persons with type 2 diabetes and two persons with type 1 diabetes with an average DM duration (mean±SD) of 11.1±10.9 years. At the time of measurements glycated hemoglobin values for the DM group were 7.29±1.47%, and fasting glucose levels on the morning of the measurements were 138±46 mg/dL. Other pertinent characteristics and comparisons of the DM and NODM groups are summarized in Table 1. There were no statistically significant between-group differences in age, body mass index, or blood pressures taken on the day of evaluation. Weight classifications between the two groups were similar, with each group having 50% of its participants being classified as obese (body mass index ≥30 kg/m2) and 28–33% classified as overweight (having body mass index values greater than 25 kg/m2 but less than 30 kg/m2).
Data are mean±SD values or number (% of total) for the diabetes mellitus (DM) group and the group without diabetes mellitus (NODM). There are no statistically significant differences between NODM and DM groups with respect to age, body mass index (BMI), or systolic and diastolic blood pressures.
TDC measurement method
TDC was measured with the MoistureMeter-D (Delfin Technologies Ltd., Kuopio, Finland). The device consists of a cylindrical probe connected to a control unit that displays the TDC value when the probe is placed in contact with the skin as illustrated in Figure 1, which illustrates a measurement on the foot dorsum. A single TDC measurement typically requires that the probe be in contact with the skin using light pressure for 10 s or less. Values obtained are dependent on the water and tissue composition in the region below the probe surface to depths ranging from 0.5 to 5.0 mm, depending on the probe used. The TDC values do not depend on skin pigmentation but do depend on the tissue type and probe used because water content of dermis is greater than that of deeper lying fat. The device operates using a 300-MHz signal because at this frequency the probe size is reasonably small and the dielectric constant of both free and bound water can be determined. The device has not yet been cleared for routine use in the United States, but the company indicates that application for such clearance has already been made. The physics and principle of operation have been well described. 11 –13,16,27,28 In brief, the 300-MHz signal is generated within the control unit and is transmitted to the tissue via the probe that is in contact with the skin. The probe acts as an open-ended coaxial transmission line. 11,12 A portion of the incident electromagnetic wave is reflected in an amount that depends on the dielectric constant of the tissue, which itself depends on the amount of free and bound water in the tissue volume through which the wave passes. Reflected wave information is processed within a control unit, and the dielectric constant is displayed. For reference, pure water has a value of about 78.5, and the display scale range is 1–80. The TDC value is dimensionless because it is in effect the ratio of the measured TDC to the value that would be measured in a vacuum. The effective measurement depth depends on the probe dimensions, with larger spacing between inner and outer conductors corresponding to greater penetration depths. In this study, three different-sized probes were used to achieve effective measurement depths of 0.5, 1.5, and 2.5 mm.
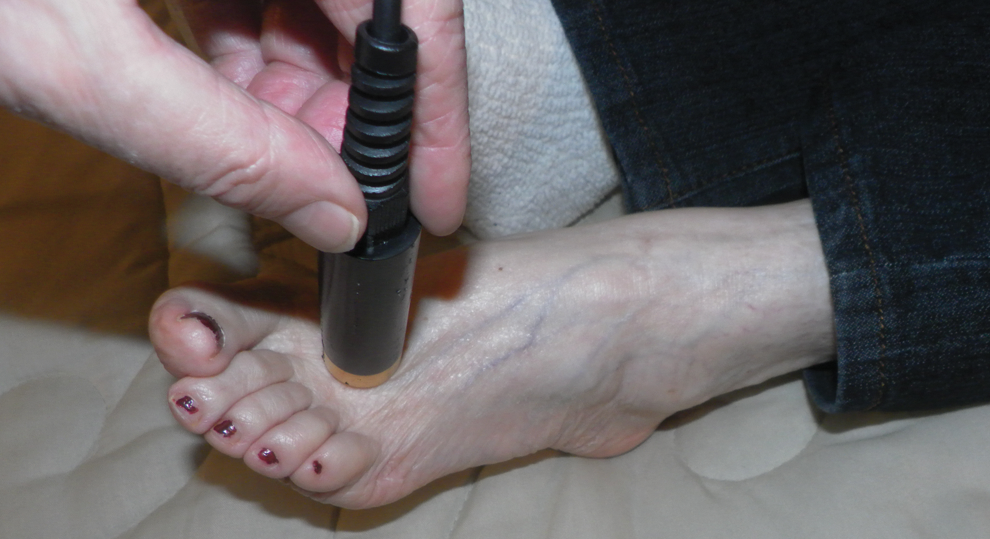
Tissue dielectric constant measurement with probe in contact with the foot dorsum. Measurements are achieved by contacting the skin for 10 s or less. Tissue dielectric constant values are displayed on a digital display of a portable control unit or when desired transferred directly to a computer. Color image available online at
Measurement procedure
All research-related measurements were done within a closed area designated for experimental research with each subject supine on a padded examination table. Room temperature was 23.3±1.5°C at the start of measurements (mean±SD) and 23.4±1.4°C at the end. Room relative humidity ranged from 44.9±11.6% at the start to 45.7±12.1% at the end. With the subject lying supine, target measurement sites were marked with a surgical pen on each anterior forearm (8 cm distal to the antecubital fossa) and the foot dorsum (on a flat area between the great and second toe). After the subject had been supine for at least 10 min and not longer than 15 min, TDC measurements were then done in triplicate at each site, starting with the 2.5 mm depth probe and progressing to 1.5 and 0.5 mm depths. Forearm measurements were done first followed by the dorsal foot measurements. After the TDC measurements were completed skin temperature at each site was determined using an infrared non-contact thermometer (Exergen, Watertown, MA). Finally, the girth values of the forearm and foot at the sites of TDC measurement were determined with a tape measure that had a calibrated tension gauge to provide for uniform pull-tension in all girth measurements.
Analysis and statistics
Triplicate TDC values obtained at each depth on each limb were averaged, yielding an average TDC value for each foot and each arm at each effective measurement depth. Corresponding left (L) and right (R) limb values were averaged to yield a single per-person average (R+L)/2 for the foot and the arm. In addition, the ratio of R/L values was calculated to determine R to L side symmetry. Prior to a further detailed analysis, these data, together with all other measured parameters, were assessed for normal distributions using the Shapiro–Wilk test. These test results indicated that foot TDC values and systolic blood pressures were significantly different from a normal distribution (P<0.05). Thus for systolic pressures, comparisons between groups were made using the nonparametric Mann–Whitney test. Comparisons of absolute TDC values among the three different effective measurement depths for foot and forearm sites were done using the nonparametric Friedman test for related samples for each group separately. Evaluation of possible group differences (NODM vs. DM) in absolute TDC values was done using the nonparametric Kruskal–Wallis test in which the analysis was done for each site (foot and forearm) separately. Comparisons of all other parameters, including the R/L ratios, which were normally distributed, were based on corresponding parametric analyses. Comparison of ratios was done using a general linear model for repeated measures with depth as the repeated-and group the between-subjects factor. For all tests a value of P<0.05 was taken as evidence of statistical significance.
Results
Arm and foot girths and skin temperatures
There were no significant differences in arm or foot absolute girths or skin temperatures between groups as summarized in Table 2. Furthermore, there was no significant difference between groups in R/L limb ratios for girths or skin temperatures.
Data are mean±SD values with associated P values for comparisons between groups without (NODM) and with (DM) diabetes mellitus. All subjects were right hand dominant so the right to left limb ratio is also the dominant to nondominant limb ratio. There are no between-group significant differences in arm or foot absolute girths or skin temperatures or in right to left limb ratios.
TDC values
For both the NODM and DM groups absolute TDC values significantly decreased with increasing depth at the forearm (Table 3). Absolute values at each depth at the forearm differed from each other depth (P<0.001). For the forearm, the average TDC value at a depth of 2.5 mm was about 17.8% less (P<0.001) than that measured at a depth of 0.5 mm. In contrast, no depth dependency of foot TDC values was observed for either group. But, at each measured depth the foot TDC values of the DM group were significantly greater than for the NODM group as shown in Table 3. The average foot TDC value measured at a 2.5 mm depth in the DM group was 14.8% greater than that measured in the NODM group, with percentage differences at 1.5 and 0.5 mm being about 12.4%. The forearm TDC DM values were not significantly greater than NODM values at any depth. There was also no significant difference in TDC ratios among the three depths for either the NODM or DM group at the arm or foot, indicating a relative symmetry in limb TDC values for both groups.
Data are mean±SD values with associated P values for comparisons between groups without (NODM) and with (DM) diabetes mellitus. All subjects were right hand dominant so the right to left limb ratio is also the dominant to nondominant limb ratio.
P<0.001 for tissue dielectric constant (TDC) depth dependence compared with TDC values at all other depths. Foot absolute TDC values are significantly greater for the DM group at all depths, but there are no significant differences in any right to left limb ratio for either group.
P<0.05 for DM group versus NODM group.
Discussion
A main outcome of the present study was the finding of significantly greater skin tissue water at the foot dorsum of persons with DM compared with those with NODM who had similar age, body mass index, and foot girth. This result was based on measurements of significantly greater TDC values in foot dorsum skin of persons with DM, which were 12.4–14.8% greater than for persons with NODM depending on the depth to which TDC was measured. Although TDC values reflect contributions of several tissue components, TDC values are well accepted as comparative measures for assessing local skin tissue water content. 13,15,17,18,27,29,30
In 16 of the 18 diabetes patients this apparent increase in skin tissue water was present without any visible signs of edema or without any objective difference in foot girth between the DM and NODM groups. This may indicate that the DM group had previously unrecognized preclinical edema. Because the interstitial space may accommodate a near doubling of its fluid volume before visible signs are observable, it may be that the use of the TDC measurement represents a potentially useful way to identify this condition. However, the possibility that the higher level of foot dorsum water in the DM group was at least in part due to edema-producing medications needs to be considered. To this end an examination of all medications showed that seven patients were using medication that are known to have peripheral edema as a possible side effect. When these seven patients were taken as a subgroup and compared with the 11 patients who took no such medications, there was no statistical difference in TDC values between subgroups. In fact, the patients taking edema-related medications had lower average TDC values at all measured depths with the greatest difference at the 2.5 mm depth (30.4±3.9 vs. 33.8±5.6). This finding would be inconsistent with a significant effect of medications, at least in the studied group of patients.
The fact that a significant DM-related increase in TDC was seen in the foot dorsum and not the forearm may be due to the greater impact of gravitational forces at work on the lower extremities, venous insufficiency, or other structural or functional aspects not specifically measured in the present study. However, it is notable that although the forearm differential between NODM and DM TDC values was not statistically significant, there was a definite trend for the DM group to have greater values than the NODM group (about 6% greater at all depths). Thus it is unclear if the apparent subclinical edema apparently unmasked by the TDC measurement is restricted only to the feet. Perhaps a greater sample size might have also resulted in statistical significance between arm TDC values, thereby possibly demonstrating a broader manifestation of this condition. This aspect must remain open pending future investigations.
Because the present application of this TDC methodology to persons with DM has not to our knowledge be previously done, comparisons with the literature are restricted. However, there are certain features of the skin tissue water profile for which comparative data do exist. One aspect relates to the balance between corresponding anatomical sites. In the present study the parameter of interest was the ratio of dominant to nondominant side TDC values. These were determined to be very nearly unity (Table 3). The clinical significance of this parameter relates to its possible use to detect developing unilateral edema at an early stage by detecting departures of this ratio from unity. Measurements of this ratio at 2.5 mm depth at forearm sites similar to those used in the present study in two groups of 30 women 21 also had ratios near unity, ranging from 0.995±0.054 to 1.014±0.046, which is similar to the value range obtained for the present NODM (0.996±0.067) and DM (1.016±0.052) groups. The implication is that the presence of DM does not by itself alter the skin tissue water ratio balance between limbs. Thus the previously used strategy of trying to identify incipient unilateral limb lymphedema by measuring limb TDC ratios and examining their departure from unity 17,21,31 may also be applicable to persons with DM for both edema and possible lymphedema involvement. The necessary thresholds would need to be established by determining the variance of the normal TDC ratio in a larger group of persons with DM.
A second aspect relates to the observed decrease in TDC value with increasing depth observed at the forearm but not at the foot in both NODM and DM groups. The decrease with depth in the forearm is likely mainly attributable to inclusion of greater amounts of low water containing subcutaneous fat with increasing depth and has been consistently observed on the forearm. 20,32,33 The absence of a TDC depth dependence on the foot dorsum may be due to the low amount of subcutaneous fat usually present in this region. A similar pattern of non-depth dependence of TDC values on the foot dorsum has been previously observed. 34 Independent of the explanation of the difference in TDC depth dependence between foot dorsum and forearm, the fact is that there is no difference in the pattern between persons with and without DM. Detection of preclinical edema in persons with DM may be clinically important because this could be a precursor to diabetic foot complications. Increasing numbers of persons with diabetes are developing foot complications, and foot ulcers occur in 15% of these individuals. 35 TDC monitoring may thus be a useful approach to complement foot examinations on this patient population.
In conclusion, a technology that characterizes local skin water in a rapid and noninvasive way has been used for the first time in persons with DM. The small but statistically significant greater value of TDC value found at the foot dorsum of the DM group is consistent with the presence of previously unrecognized incipient edema. These novel findings suggest that there may be some benefit to using this measurement method as a way to screen for early changes in foot skin features that tend to cause DM-related edema. Further systematic evaluations on a larger group of well-defined diabetes patients are needed to clearly determine the clinical significance of the present TDC findings.
Footnotes
Author Disclosure Statement
No competing financial interests exist.