
Abstract
Background:
Hypoglycemia prevention is one of the major challenges in diabetes research. Recently, it has been suggested that continuous glucose monitoring (CGM)-based short-term glucose prediction algorithms could be exploited to generate alerts when hypoglycemia is forecasted, allowing the patient to take appropriate countermeasures to avoid/mitigate the event. However, quantifying the potential benefits of prediction in terms of reduction of number/duration of hypoglycemia requires an in silico assessment that is the object of the present article.
Materials and Methods:
Data for 50 virtual subjects were generated by using the University of Virginia/Padova type 1 diabetes simulator (54-h monitoring), made more credible by adding realistic measurement noise and perturbations of meals and insulin injections. CGM was assumed to be well calibrated. Occurrence and duration of hypoglycemic events were compared in three scenarios: (1) hypoglycemia was not recognized and not dealt with; (2) 15 g of carbohydrates was ingested when CGM crossed the hypoglycemia threshold; or (3) 15 g of carbohydrates was ingested when the 30-min ahead-of-time CGM prediction crossed the hypoglycemia threshold. The effectiveness of alerts was investigated also in the case of delayed/absent ingestion of carbohydrates.
Results:
In Scenario 1, each virtual subject spent 17.7% of the time in the hypoglycemic range, with a median of four events of 120 min in the 54-h period monitored. In Scenario 2, the time spent in hypoglycemia was reduced to 4.7% (four events of 40 min). In Scenario 3, the time spent in hypoglycemia was further reduced to 1.2% (one event of 15 min). Absent/delayed patient's responses to alerts slightly increase these percentages, but improvements remain significant.
Conclusions:
This in silico proof-of-concept study demonstrates that using predicted rather than measured CGM allows a significant reduction of the number of hypoglycemic events and the time spent in hypoglycemic range both by 75%, stimulating further research and clinical investigation on the generation of preventive hypoglycemic alerts exploiting glucose prediction methods.
Introduction
In the literature, the benefit deriving from prediction methods to prevent/mitigate hypoglycemia by soliciting appropriate treatments (e.g., sugar intake and/or pump basal suspension) has been assessed from real data. 14,16 –19 However, as better explained in Hypoglycemia Reduction Through Prediction-Based Preventive Treatment: State of the Art, it would be of interest to compare different scenarios occurring for the same patient and starting from the very same patient conditions, which is not possible in clinical studies, where every action has an effect on glycemia and, unavoidably, excludes the possibility of seeing what would have happened if different decisions were made. Thus, the aim of this article is to use an in silico environment to quantify the potential benefits, in terms of number and duration of hypoglycemia events, coming from the use of predicted, rather than measured, glucose, in 50 synthetic subjects. Virtual patients were created by the University of Virginia/Padova type 1 diabetes simulator, 20,21 which is approved by the Food and Drug Administration as a potential route to clinical testing as a substitute for trial on animals. The synthetic patients were virtually monitored in horizons of 54 h (including two lunch, two dinner, and three breakfast events per patient), in the presence of additive white noise with realistic variance corrupting CGM data and of sources of uncertainty on the quantity of ingested carbohydrates (CHOs) and injected insulin. Three parallel scenarios were considered: (1) the subject was unaware of hypoglycemia, no alert was generated, and no countermeasures were taken when the blood glucose concentration fell below the hypoglycemic threshold (worst case); (2) a hypoglycemia alarm was triggered based on CGM measurements and 15 g of CHO was ingested by the patient; and (3) a hypoglycemic alert was given on the basis of the 30-min ahead-of-time predicted glycemia, obtained via a recently published neural network algorithm, 12 and 15 g of CHO was ingested by the patient, as in Scenario 2. Results demonstrate that under Scenario 3 the number of hypoglycemic events and the time spent in hypoglycemic range are reduced by 75% and 93%, respectively, relative to Scenario 1. Even more remarkable is that comparison of Scenario 2 and Scenario 3 shows that generating alerts on the basis of predicted rather than measured CGM leads to a reduction of both number and duration of hypoglycemic events of 75%. A significant reduction of number and duration of hypoglycemic episodes (25% and 59%, respectively) is observed even in the presence of delayed/absent ingestion of CHO after hypoglycemia alerts.
Hypoglycemia Reduction Through Prediction-Based Preventive Treatment: State of the Art
The aim of this section is to illustrate some results recently obtained in the literature on the possibility of avoiding/mitigating hypoglycemic events by treating them in advance, on the basis of glucose values predicted ahead in time.
In the work of Buckingham et al., 16,17 nocturnal hypoglycemia was induced in 15 hospitalized subjects by increasing basal insulin infusion. Five different literature glucose prediction techniques (all solely based on past glycemic data measured by CGM) were simultaneously used to forecast hypoglycemia, and hypoglycemia alerts were generated on the basis of a predefined voting scheme. The triggering of a hypoglycemic alarm involved the suspension of basal insulin infusion, until recovering of blood glucose concentration to a safe value, either for a maximum of 90 min. This strategy allowed preventing the majority of the nocturnal induced hypoglycemia crisis.
A retrospective study, dealing with prediction of nocturnal hypoglycemia in children with type 1 diabetes, was conducted by Dassau et al. 14 Following a protocol similar to that of Buckingham et al., 16,17 low glucose concentration was induced by gradual increases in basal insulin infusion rate. Five different literature glucose prediction algorithms were individually run, and a hypoglycemia alarm was triggered if the cumulative number of alerts generated was above a preset voting threshold. The method was assessed, retrospectively, on the basis of the number of hypoglycemia events correctly forecasted, by evaluating and comparing the performance obtained with various prediction horizons, different voting thresholds, and different hypoglycemic thresholds. Harvey et al. 19 proposed a method to compare hypoglycemia prediction algorithms and to optimally tune their parameters for different applications, as pump suspension or alerting for rescue CHO ingestion. Eren-Oruklu et al. 8,18 proposed prediction algorithms based on autoregressive moving average models exploiting past CGM readings solely and also evaluated three methods for generating hypoglycemic preventive alerts on data collected in type 2 diabetes subjects. 9
From the above studies it emerges that glucose prediction methods allow prevention, or at least mitigation, of hypoglycemic events. However, all the studies above are done in vivo/on real data. A more comprehensive quantitative assessment would require comparison of different parallel scenarios for the same patient. In clinical studies, once an action on a patient is taken (e.g., administration of sugar at time X), there is no way of coming back to time X and evaluating what would have happened if different actions were adopted (e.g., administration of sugar at time X+Y or no administration at all). The simulation environment allows overcoming this limitation because, for the same subject and the same hypoglycemic event, we can run different simulations (corresponding to parallel alternative and mutually exclusive scenarios) and compare the effect of different actions, starting from the very same initial conditions. To clarify this concept, in Figure 1 we show a conceptual example obtained by creating, through the University of Virginia/Padova type 1 diabetes simulator, 20 a subject (#1) experiencing a nocturnal hypoglycemic situation. Given the purely conceptual purpose of this specific example, noise-free data are considered at the moment. At time 02:00, glucose concentration is 120 mg/dL and exhibits a descending trend (continuous black line), which ultimately leads to a hypoglycemia event that could be revealed at time 04:00 (blue alarm bell) when glucose concentration falls below the 70 mg/dL threshold (thin horizontal dashed black line). A short-term glucose prediction can be computed in real time, and in Figure 1 we report the 30-min ahead-of-time glucose prediction profile (continuous magenta line) until time 03:30 (for easy reading), when it falls below the 70 mg/dL threshold and a hypoglycemia alert may be generated (red alarm bell). The simulation environment allows us to consider three scenarios for the hypoglycemia event occurring in this virtual patient. In Scenario 1, no hypoglycemia alert is generated, and the subject is unaware of hypoglycemia; after threshold crossing at time 04:00, the glucose profile takes the shape of the green dotted line. The virtual subject has breakfast at 08:00 (black arrow) and returns within the euglycemic range only at time 08:20, after having spent 260 min (more than 4 h) in the hypoglycemic range, reaching a glycemic concentration as low as 54 mg/dL. In Scenario 2, a bolus of 15 g of CHO (blue arrow) is given at 04:00 (blue alarm bell) with the glucose profile shown by the blue dotted line. It is notable that this countermeasure allows re-entering the euglycemic range at 04:40, thus reducing the time spent below the hypoglycemic threshold to 40 min (horizontal blue line), with a lowest glucose concentration of 66 mg/dL. In Scenario 3, the 15-g CHO bolus for hypoglycemia treatment is administered immediately after the generation of the alert at 03:30 (red alarm bell) with the glucose profile shown by the red dotted line. It is notable that in this case the hypoglycemic event is totally avoided.
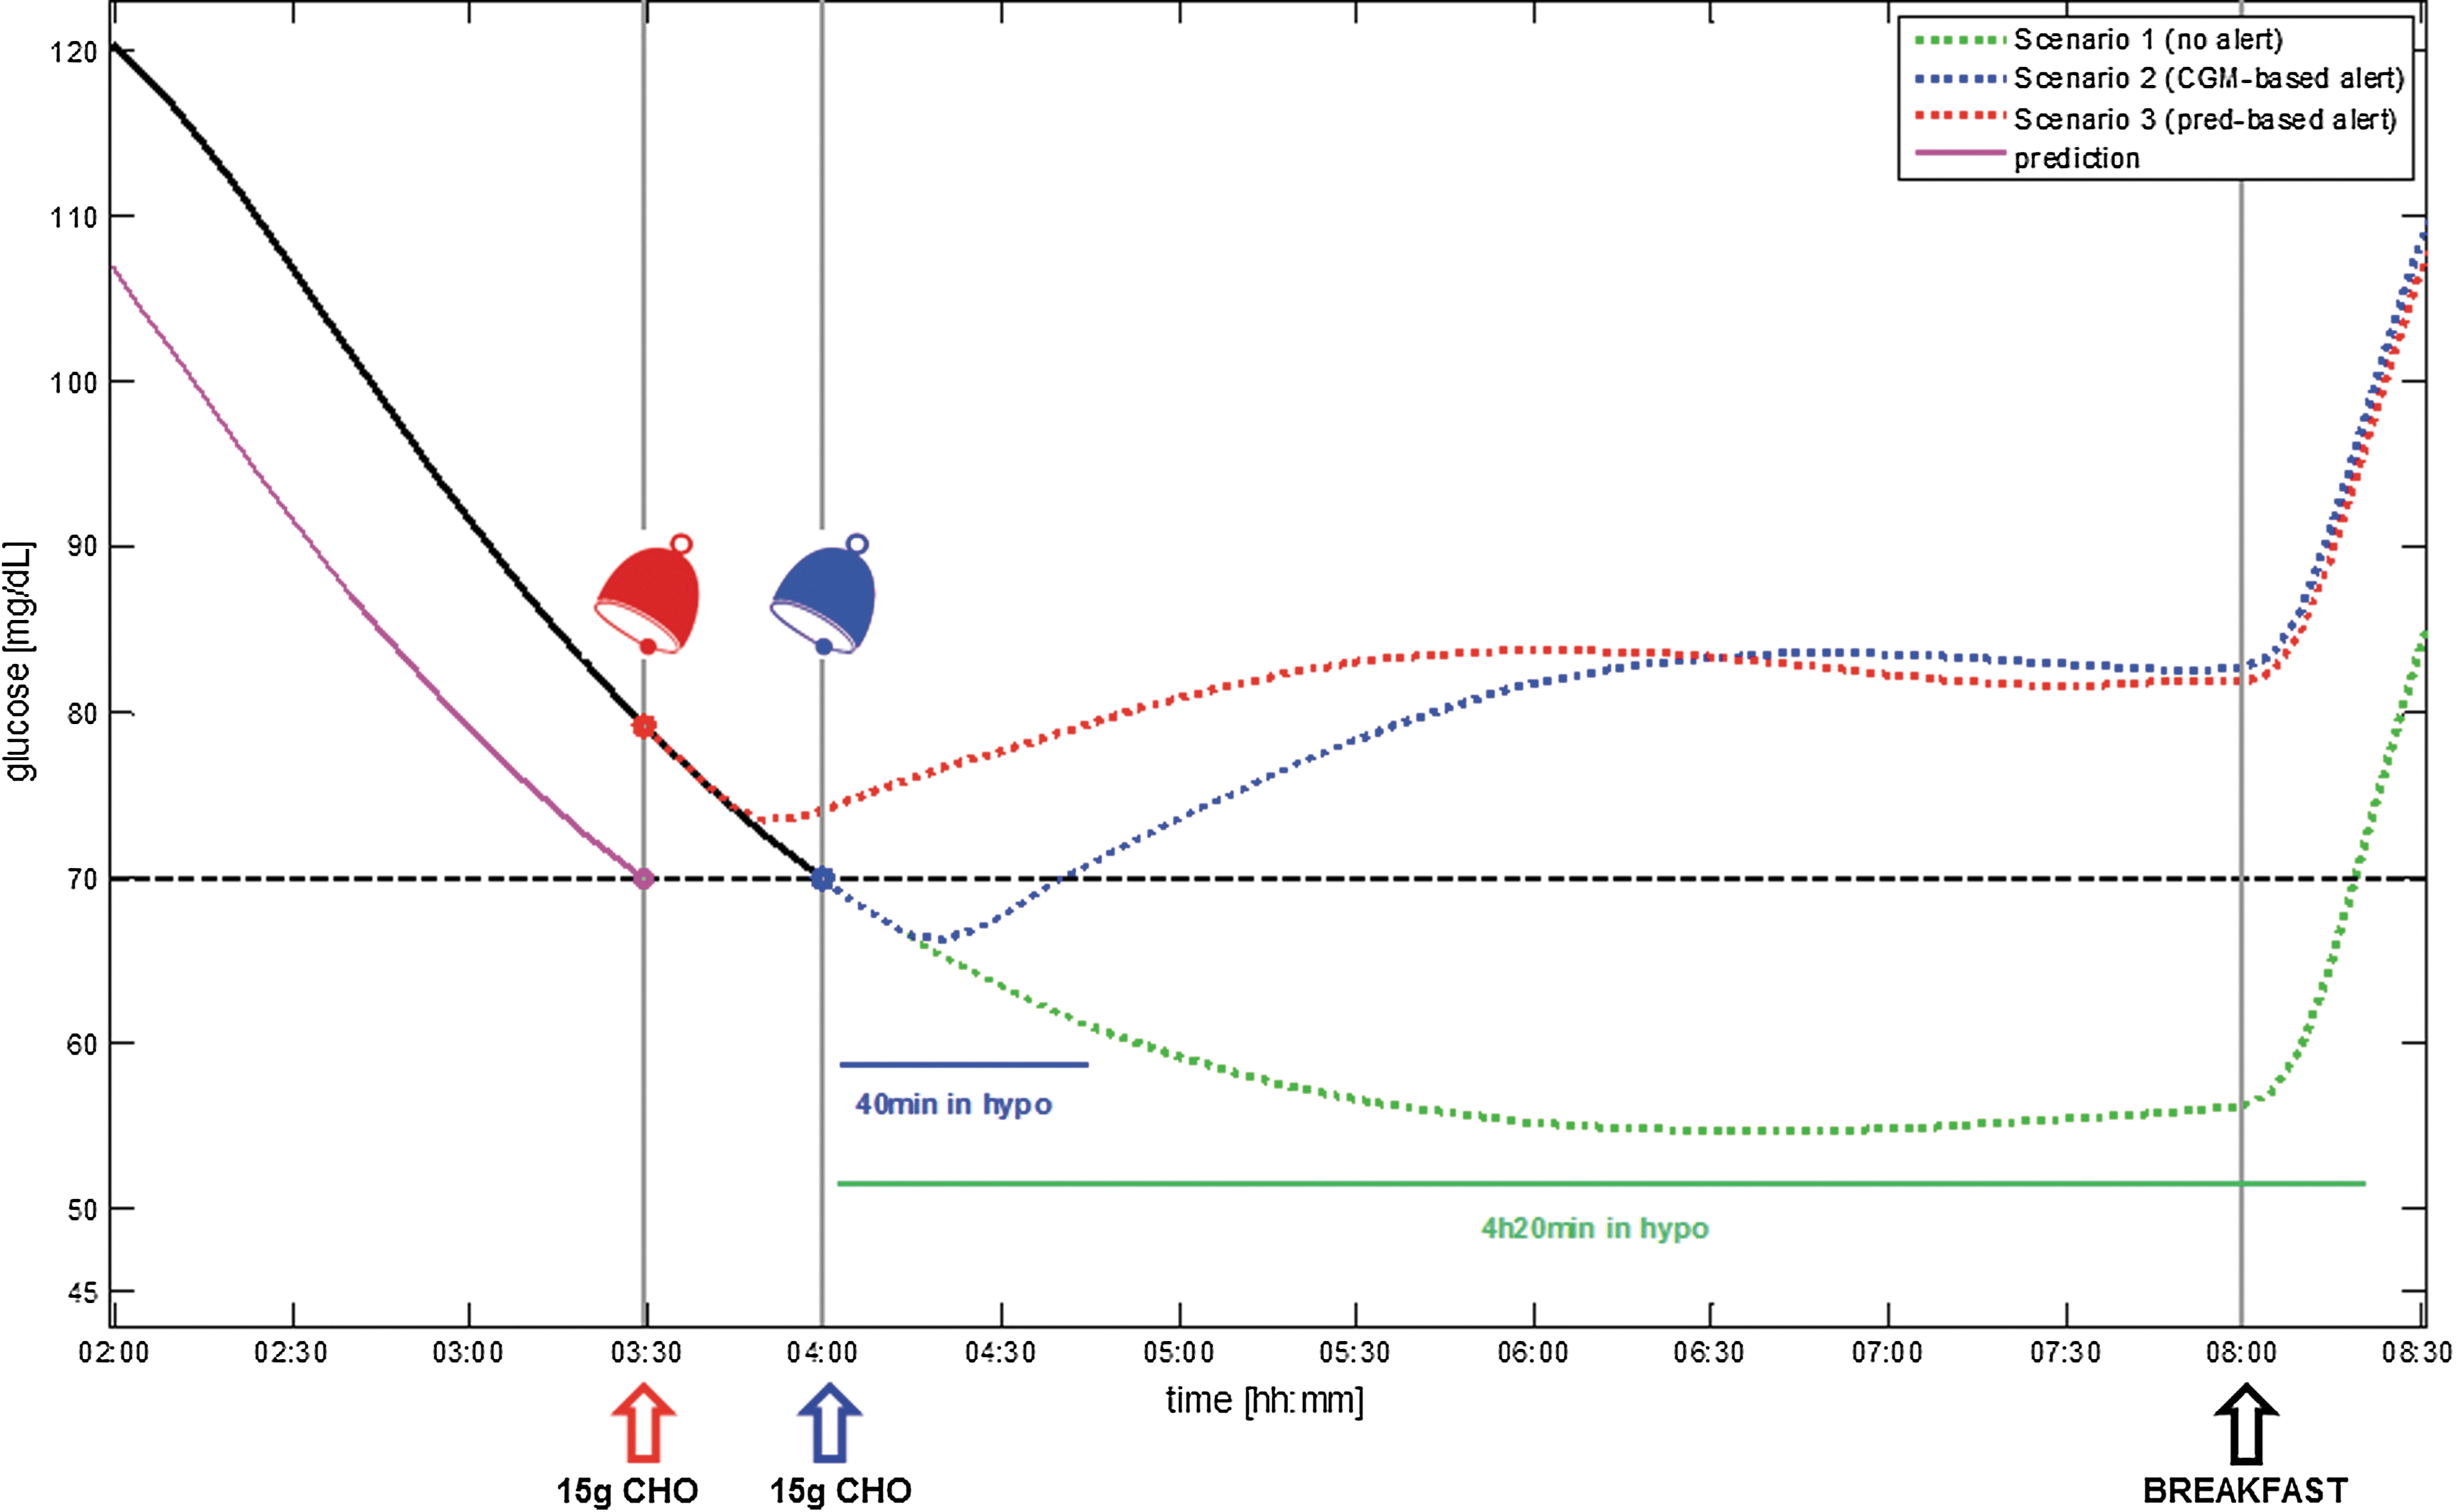
Virtual subject #1, noise-free data, showing the three scenarios of glucose concentration behavior that may occur in the presence of a nocturnal hypoglycemia (hypo) event (the thin horizontal dashed black line denotes the 70 mg/dL hypo threshold, the continuous black line represents glucose concentration until 04:00, the continuous magenta line identifies the 30-min ahead-of-time glucose prediction [pred] until time 03:30, and the black arrow indicates breakfast time at 08:00): Scenario 1 (green), no hypo alert (green dotted line); Scenario 2 (blue), alarm (blue bell) with 15 g of carbohydrate (CHO) bolus (blue arrow) at 04:00 and subsequent glucose concentration (blue dotted line); and Scenario 3 (red), alarm (red bell) with 15 g of CHO bolus (red arrow) at time 03:30 and subsequent glucose concentration (red dotted line). CGM, continuous glucose monitoring. Color image available online at
This conceptual example shows the potential of generating alerts on the basis of predicted glucose. To the best of our knowledge, a comprehensive simulation study to assess the benefits, in terms of number and duration of occurred hypoglycemia events, of ingesting a small amount of CHO in response to hypoglycemia alerts generated on the basis of measured versus predicted glucose profiles has not been performed. To the best of our knowledge, the only study published so far that adopts simulation strategies in a similar context is that of Hughes et al., 22 where the authors presented a method to detect/predict the risk of hypoglycemia and to perform a gradual attenuation of insulin delivery on the basis of risk factors instead of an instantaneous pump shutoff and assessed it through the University of Virginia/Padova type 1 diabetes simulator. 20 Their results indicate that attenuating insulin delivery reduces, or at least delays, the onset of hypoglycemia, especially if rescue CHO is given sufficiently ahead in time. However, differently from the open-loop control framework considered in the present study, the algorithm of Hughes et al. 22 was thought to work in a closed-loop artificial pancreas framework, and the amount of insulin released by the pump could be modified at each time step.
Materials and Methods
In silico database
The database consists of 50 type 1 diabetes virtual patients, extracted from the University of Virginia/Padova type 1 diabetes simulator, 20,21 without reference to any particular cohorts of the population. For each subject, one CGM time series has been simulated, with sampling time of 5 min. The choice of this specific sampling time is due to the fact that it coincides with that of two of the most used CGM devices: the Seven® Plus (DexCom Inc., San Diego, CA) and the Guardian® Real-time (Medtronic Inc., Northridge CA). Each simulated time series consists of 54 h of monitoring, from 03:00 of Day 1 to 09:00 of Day 3. The monitoring interval was chosen in order to be long enough to observe at least one hypoglycemic event for each subject. Moreover, because breakfast is administered between 06:00 and 08:00, termination of the monitoring interval at 09:00 allows patients to complete the recovery from an eventual nocturnal hypoglycemia. Three meals per day were considered in the simulated scenario. To render the profiles more realistic, CHO intake quantities and meal timings were differentiated from meal to meal and from day to day. Breakfast was randomly located in the time interval 06:00–08:00 and with CHO randomly chosen between 35 and 55 g, lunch was in the interval 12:00–14:00 with 60–90 g of CHO, and finally dinner was in the interval 19:00–21:00 with 70–100 g of CHO. For what concerns insulin, a basal-bolus infusion scheme was adopted, with boluses computed according to the CHO content of the meal. To obtain additional hypoglycemic events in the simulated profiles, overdosage of insulin was considered. In particular, everyday basal insulin was increased twice for 30 min of a random amount sampled from a uniform distribution in 0–3 U/h (this action has also an effect on glucose similar to an increase of insulin sensitivity or to a mild physical activity). Furthermore, for half of the patients randomly chosen, one insulin bolus was augmented once a day of a random percentage sampled from a uniform distribution in 0–30%. For the other half of the patients, the size of one of the meals was simulated to be wrongly estimated, and the amount of CHO effectively ingested was decreased by a percentage randomly chosen in the interval 0–30%. Finally, in order to mimic the random measurement error affecting CGM, a white noise sequence whose samples were extracted from a Gaussian distribution with zero mean, as in Chase et al., 23 and variance equal to 4, in line with Guerra et al. 24 and Facchinetti et al., 25 have been added to each time series. Simulations have been drawn without considering any sensor drift/colored noise because, to the best of our knowledge, no well-established models to describe these sources of sensor inaccuracy are available (see, for example, the discussion of Facchinetti et al. 26 ). However, this simplification does not limit the validity of the results. In fact, sensor drift would affect alerts generated on the basis of prediction, but also, in a very similar way, alerts generated on the basis of CGM (in other words, deterioration of results would occur in both Scenario 2 and Scenario 3, but the relative difference between the two scenarios, which is the key object of the present investigation, would not significantly change). It is also worthwhile recalling that, in a real world environment, enhancement/calibration methods 24,27 –29 could be used to mitigate the effects of sensor drift by exploiting sparse reference self-monitoring of blood glucose samples (see also Limitations of the adopted in silico environment).
To quantify the benefits of prediction-based hypoglycemia alerts, we compared the three scenarios already illustrated in Figure 1. In Scenario 1, hypoglycemia is not recognized and dealt with. This corresponds to a sort of worst-case situation for the diabetes patient, although possible especially during the night. 30 In Scenario 2 the alert is triggered on the basis of the measured CGM readings. In Scenario 3 the alarm is generated on the basis of predicted glycemia, obtained through the algorithm summarized in The neural network predictor and described by Zecchin et al. 12 Alert generation obeyed the simple strategy explained in The hypoglycemic alert generation strategy. In both Scenarios 2 and 3, a bolus of 15 g CHO was ingested in the 5 min following the alert. Scenario 2 and Scenario 3 were assessed also in the presence of randomly delayed/absent ingestion of CHO. Results are quantified in terms of number of hypoglycemic events, their duration, and total time in the hypoglycemic range. In addition, we computed also the distribution of glucose concentration and the Low and High Blood Glucose Indexes (LBGI and HBGI, respectively), 31 two commonly adopted indicators of the risk of hypoglycemia and hyperglycemia, respectively. The higher the value of these indexes, the higher the associated risk. For example, in Figure 1 LBGI results equal to 14.5, 4.5, and 3.6 in Scenario 1 (green dotted line), Scenario 2 (blue dotted line), and Scenario 3 (red dotted line), respectively. The nonparametric Mann–Whitney U test was used to compute P values to assess the significance of differences among the scenarios considered.
Remark 1
In the spirit of keeping the protocol as simple as possible, the action associated with hypoglycemia alert was standardized to the ingestion of 15 g of CHO. According to Briscoe and Davis, 32 such a measure is commonly adopted by diabetes patients and has the effect of raising glycemia of about 50 mg/dL in approximately 15 min. In addition, basal insulin infusion was neither suspended nor attenuated (differently from Buckingham et al. 16,17 and Hughes et al. 22 ), also because this would be expected to have a delayed effect.
The neural network predictor
The glucose predictor is that recently proposed by our group, 12 to which we refer the reader for details. In brief, the predictor is based on a feed-forward neural network and on a time-varying linear extrapolation algorithm, 6 used in parallel to forecast, respectively, nonlinear and linear dynamics of glycemic time series. Figure 2 shows a block scheme with the structure of the predictor. Inputs of the linear extrapolation predictor are past CGM readings measured by the sensor. Inputs of the neural network block include the past error committed by the linear strategy, together with its trend (computed through first-order differences), the actual CGM readings and the trend of the CGM signal, and four other inputs that depend on meal information, namely, the glucose rate of appearance after a meal and three of its future time derivatives. The four inputs reflecting meal information are obtained using the physiological model of Dalla Man et al., 33 with population parameters estimated in Dalla Man et al. 34 The output of the neural network block is the error currently committed by the linear model in forecasting future glycemia. Finally, the linear model and neural network outputs are combined together to obtain the prediction of future glycemia. The algorithm was trained on profiles of 10 patients (not included in the test set) simulated for 4 days. The prediction horizon used in this study is 30 min.
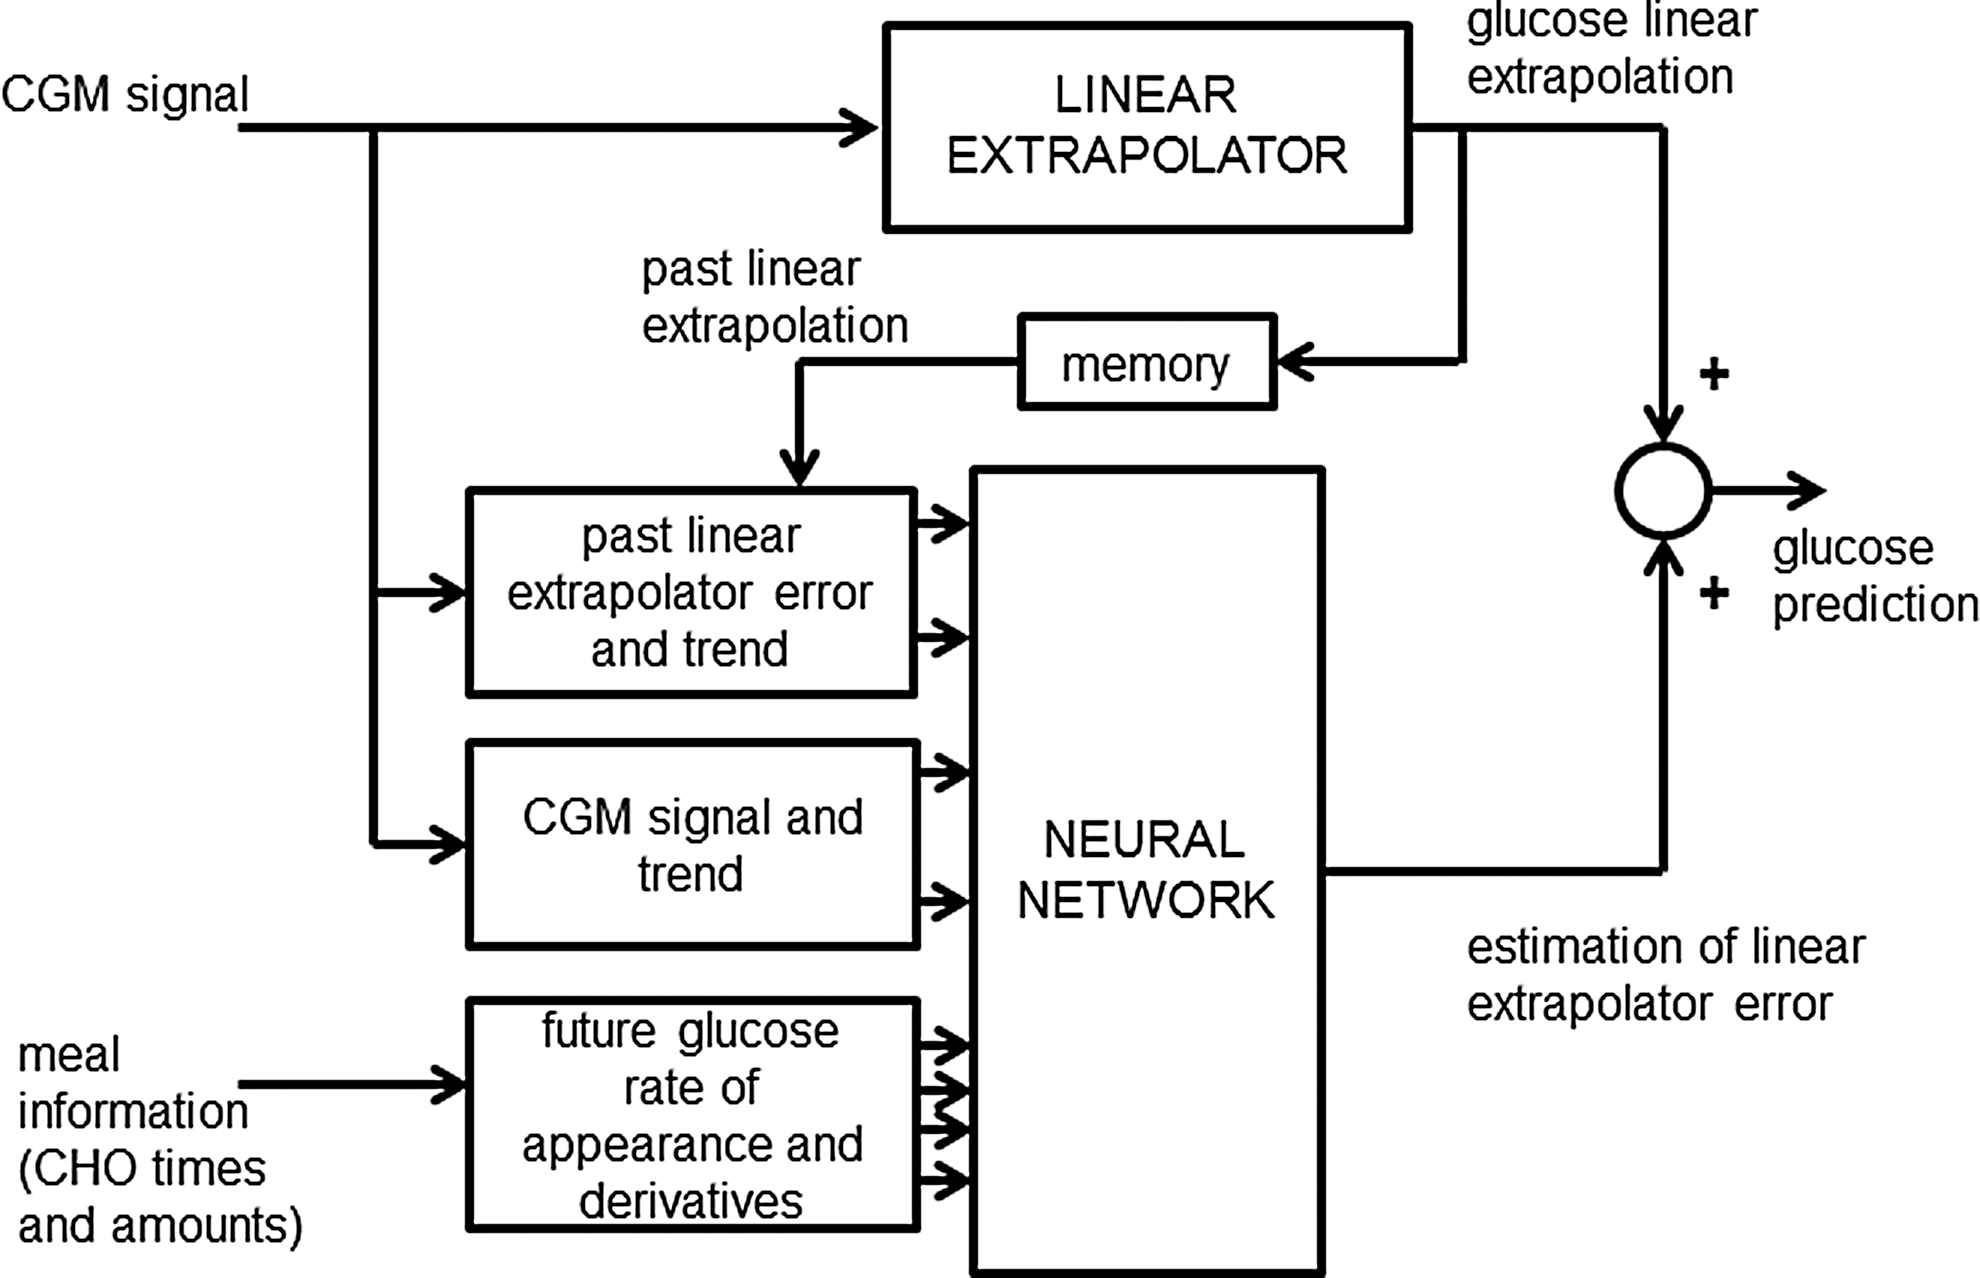
Block scheme of the prediction strategy of Zecchin et al. 12 CGM, continuous glucose monitoring; CHO, carbohydrate.
Remark 2
In Zecchin et al., 12 the predictor proved to be robust against errors in estimation of meal size (±20%) and timing (±10 min). Therefore, we expect that input errors have a minor impact on the results reported in the present article. However, it is worthwhile stressing that the specific prediction algorithm chosen in this proof-of-concept study is not a central issue. In fact, results very similar to those reported in the present article could have been obtained with other prediction methods available in the literature. We chose our previously described method 12 for obvious practical reasons and because it is one of the few literature approaches allowing us to explicitly take into account meal information.
The hypoglycemia alert generation strategy
Because the focus here is on benefits of considering predicted rather than measured glucose for triggering hypoglycemia alarms, we prefer not to consider sophisticated algorithms to generate alerts. Rather, we consider a very basic procedure that generates an alert when the glucose profile (measured by the CGM sensor in Scenario 2, forecasted by the prediction algorithm in Scenario 3) crosses 70 mg/dL and is lower than this threshold for at least two consecutive sampling times (checking for the presence of two consecutive samples in the hypoglycemic range delays the alarm by 5 min but limits the problem of dealing with false alerts). After 30 min from the first hypoglycemia alert, if the subject is still in the hypoglycemic range, a second alarm is generated, and another 15 g of CHO is ingested by the patient.
Results
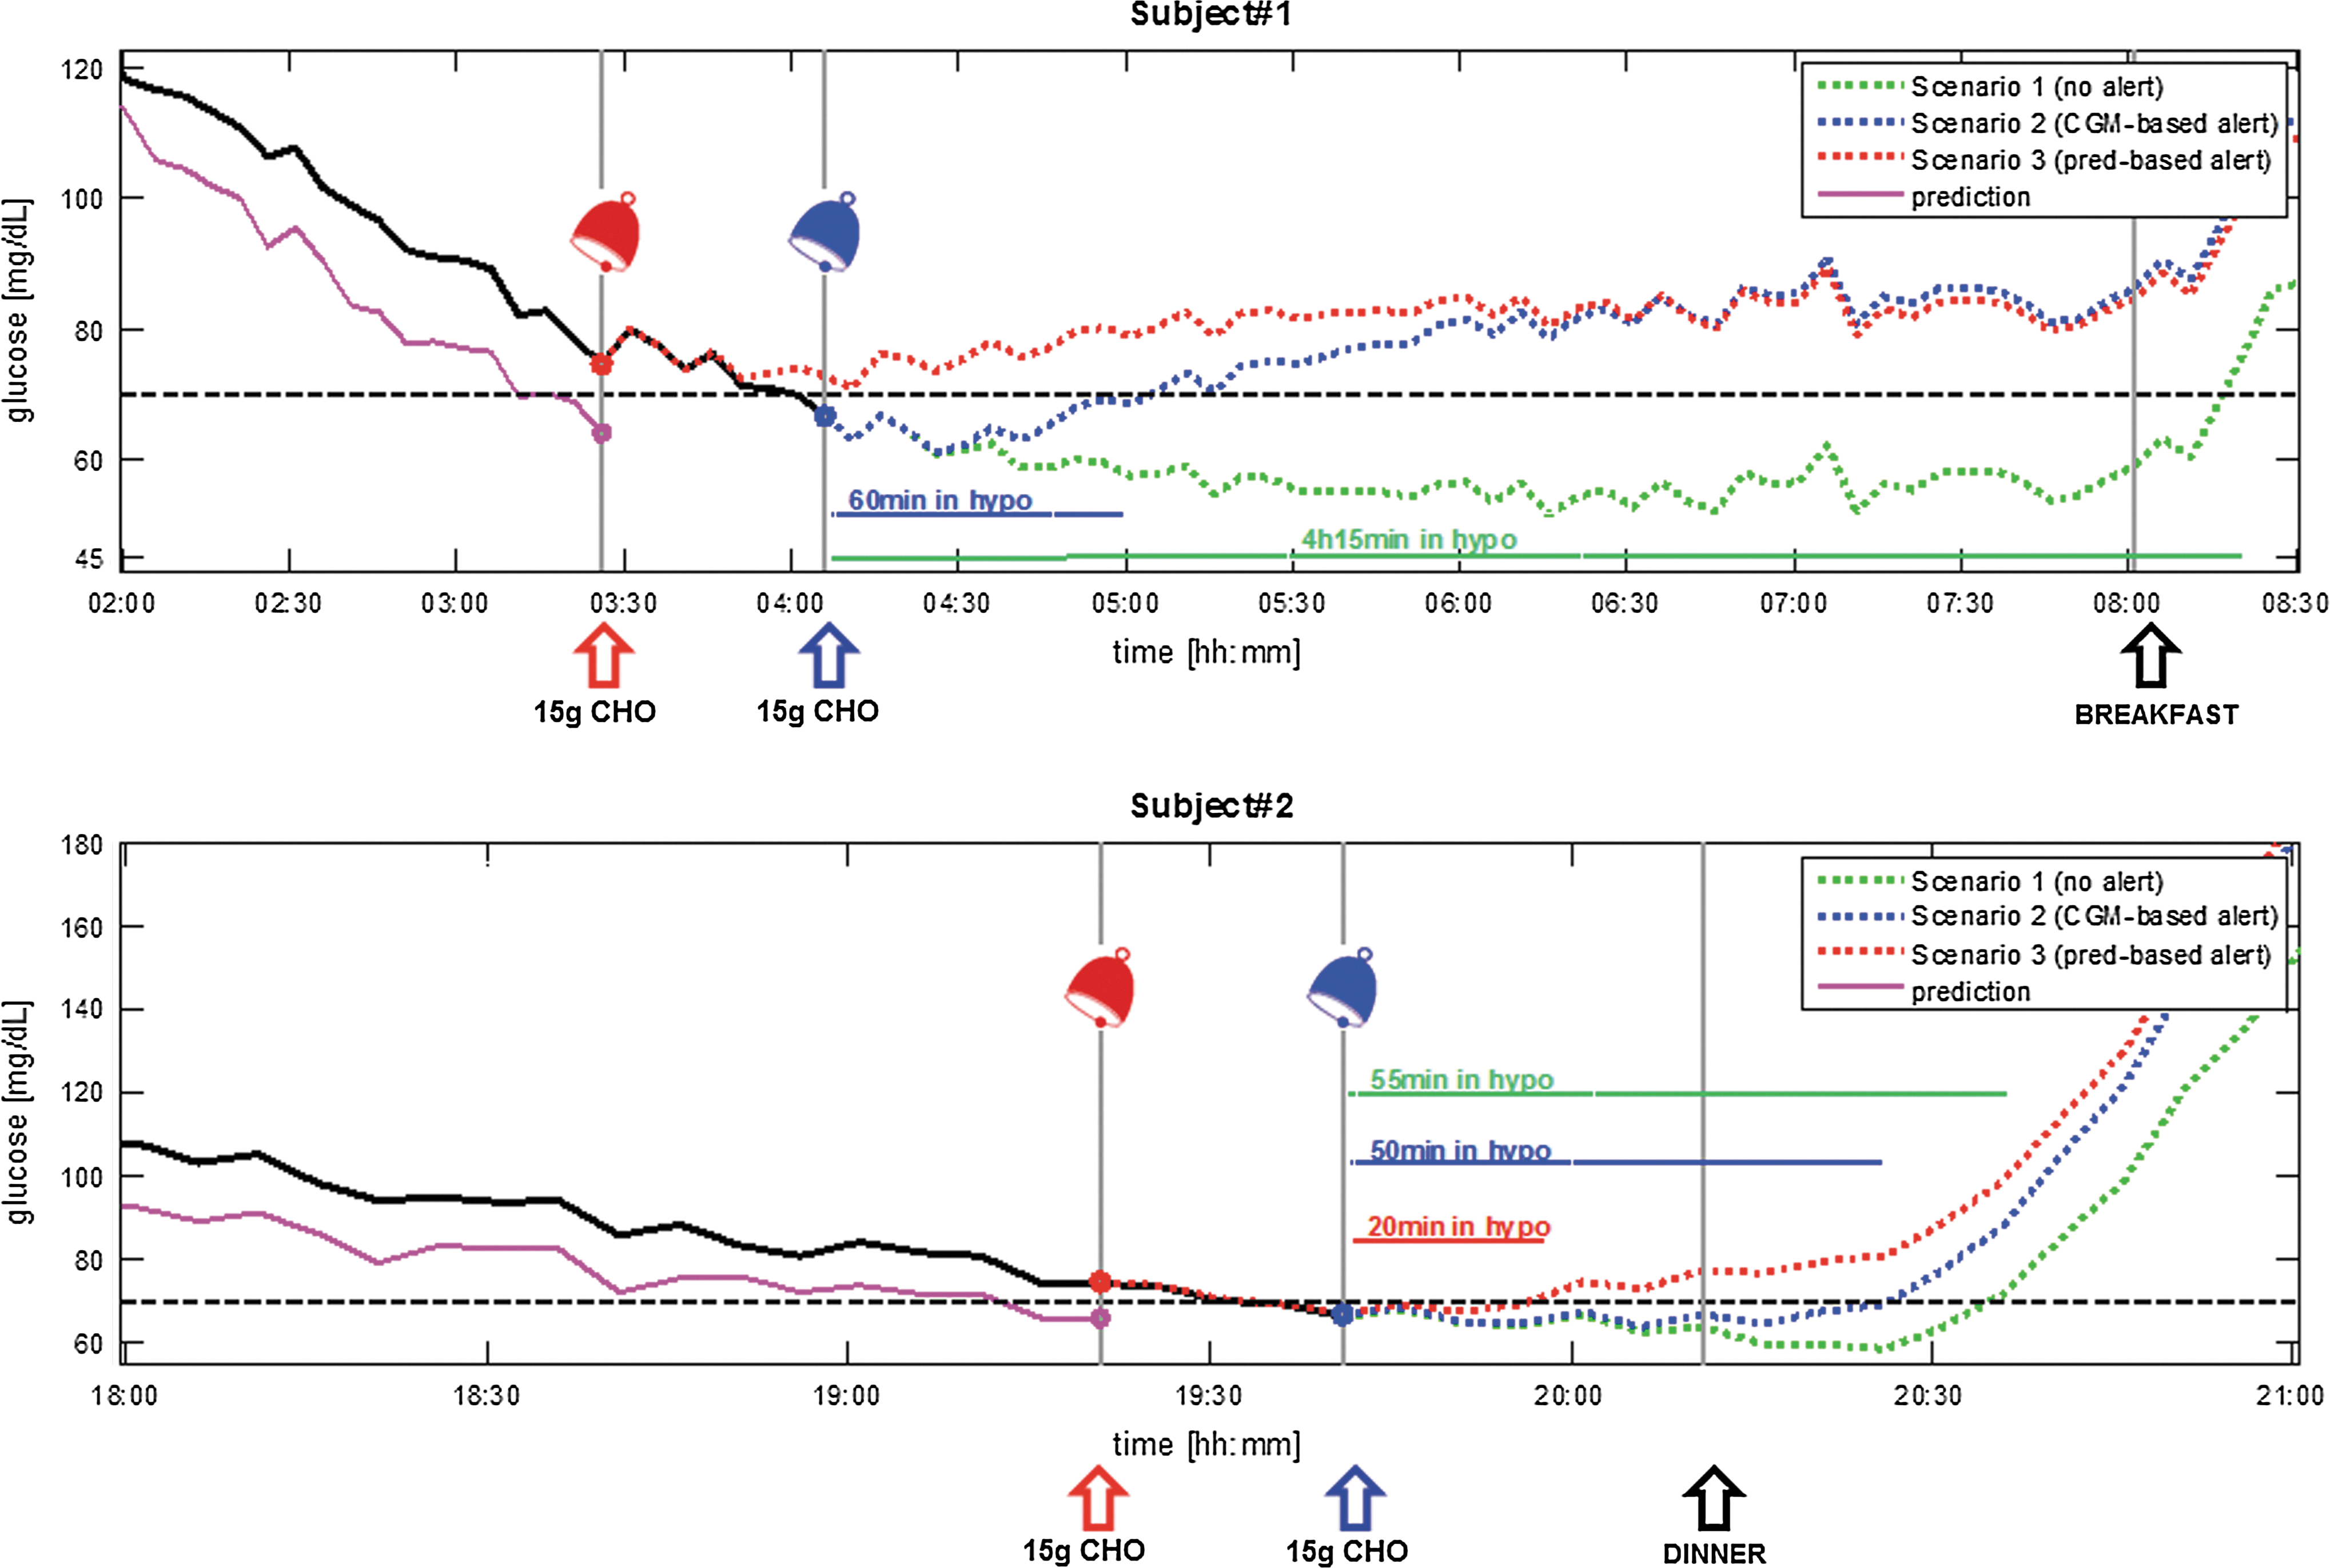
Figure 3, top panel, once again shows subject #1 of Figure 1 but this time in the presence of noise (lines meaning is as in Fig. 1). In Scenario 3 (glucose concentration denoted by the dashed red line), the nocturnal hypoglycemia is avoided (the lowest glucose concentration is 72 mg/dL, and the LBGI equals 3.6) thanks to the generation of the alert (followed by CHO ingestion) at 03:25. In Scenario 2 (glucose concentration denoted by the dotted blue line), the alarm is given at 04:05, and the hypoglycemic event can only be mitigated; in fact, the subject spends 60 min in the hypoglycemic range, reaching a lowest value of 63 mg/dL (LBGI of 5.0). Without hypoglycemia alert generation (Scenario 1, glucose concentration denoted by the dotted green line), the virtual subject experiences a threatening nocturnal hypoglycemia, with a minimum value of 53 mg/dL (LBGI of 14.8), which lasts for 255 min (approximately 4 h). The bottom panel of Figure 3 shows another representative subject. In Scenario 3 (glucose concentration denoted by the dashed red line), the prediction-based alert (followed by CHO ingestion) is generated 20 min ahead of time. However, hypoglycemia in this case is not totally avoided, but mitigated: the subject spends 20 min in the hypoglycemic range (lowest glycemia level of 67 mg/dL and LBGI of 5.9). In Scenarios 2 and 1 the time spent in the hypoglycemic range is 50 and 55 min, respectively (respective lowest glycemia levels of 64 mg/dL and 59 mg/dL and respective LBGI values of 7.9 and 9.6), with recovery from the event only after dinner.
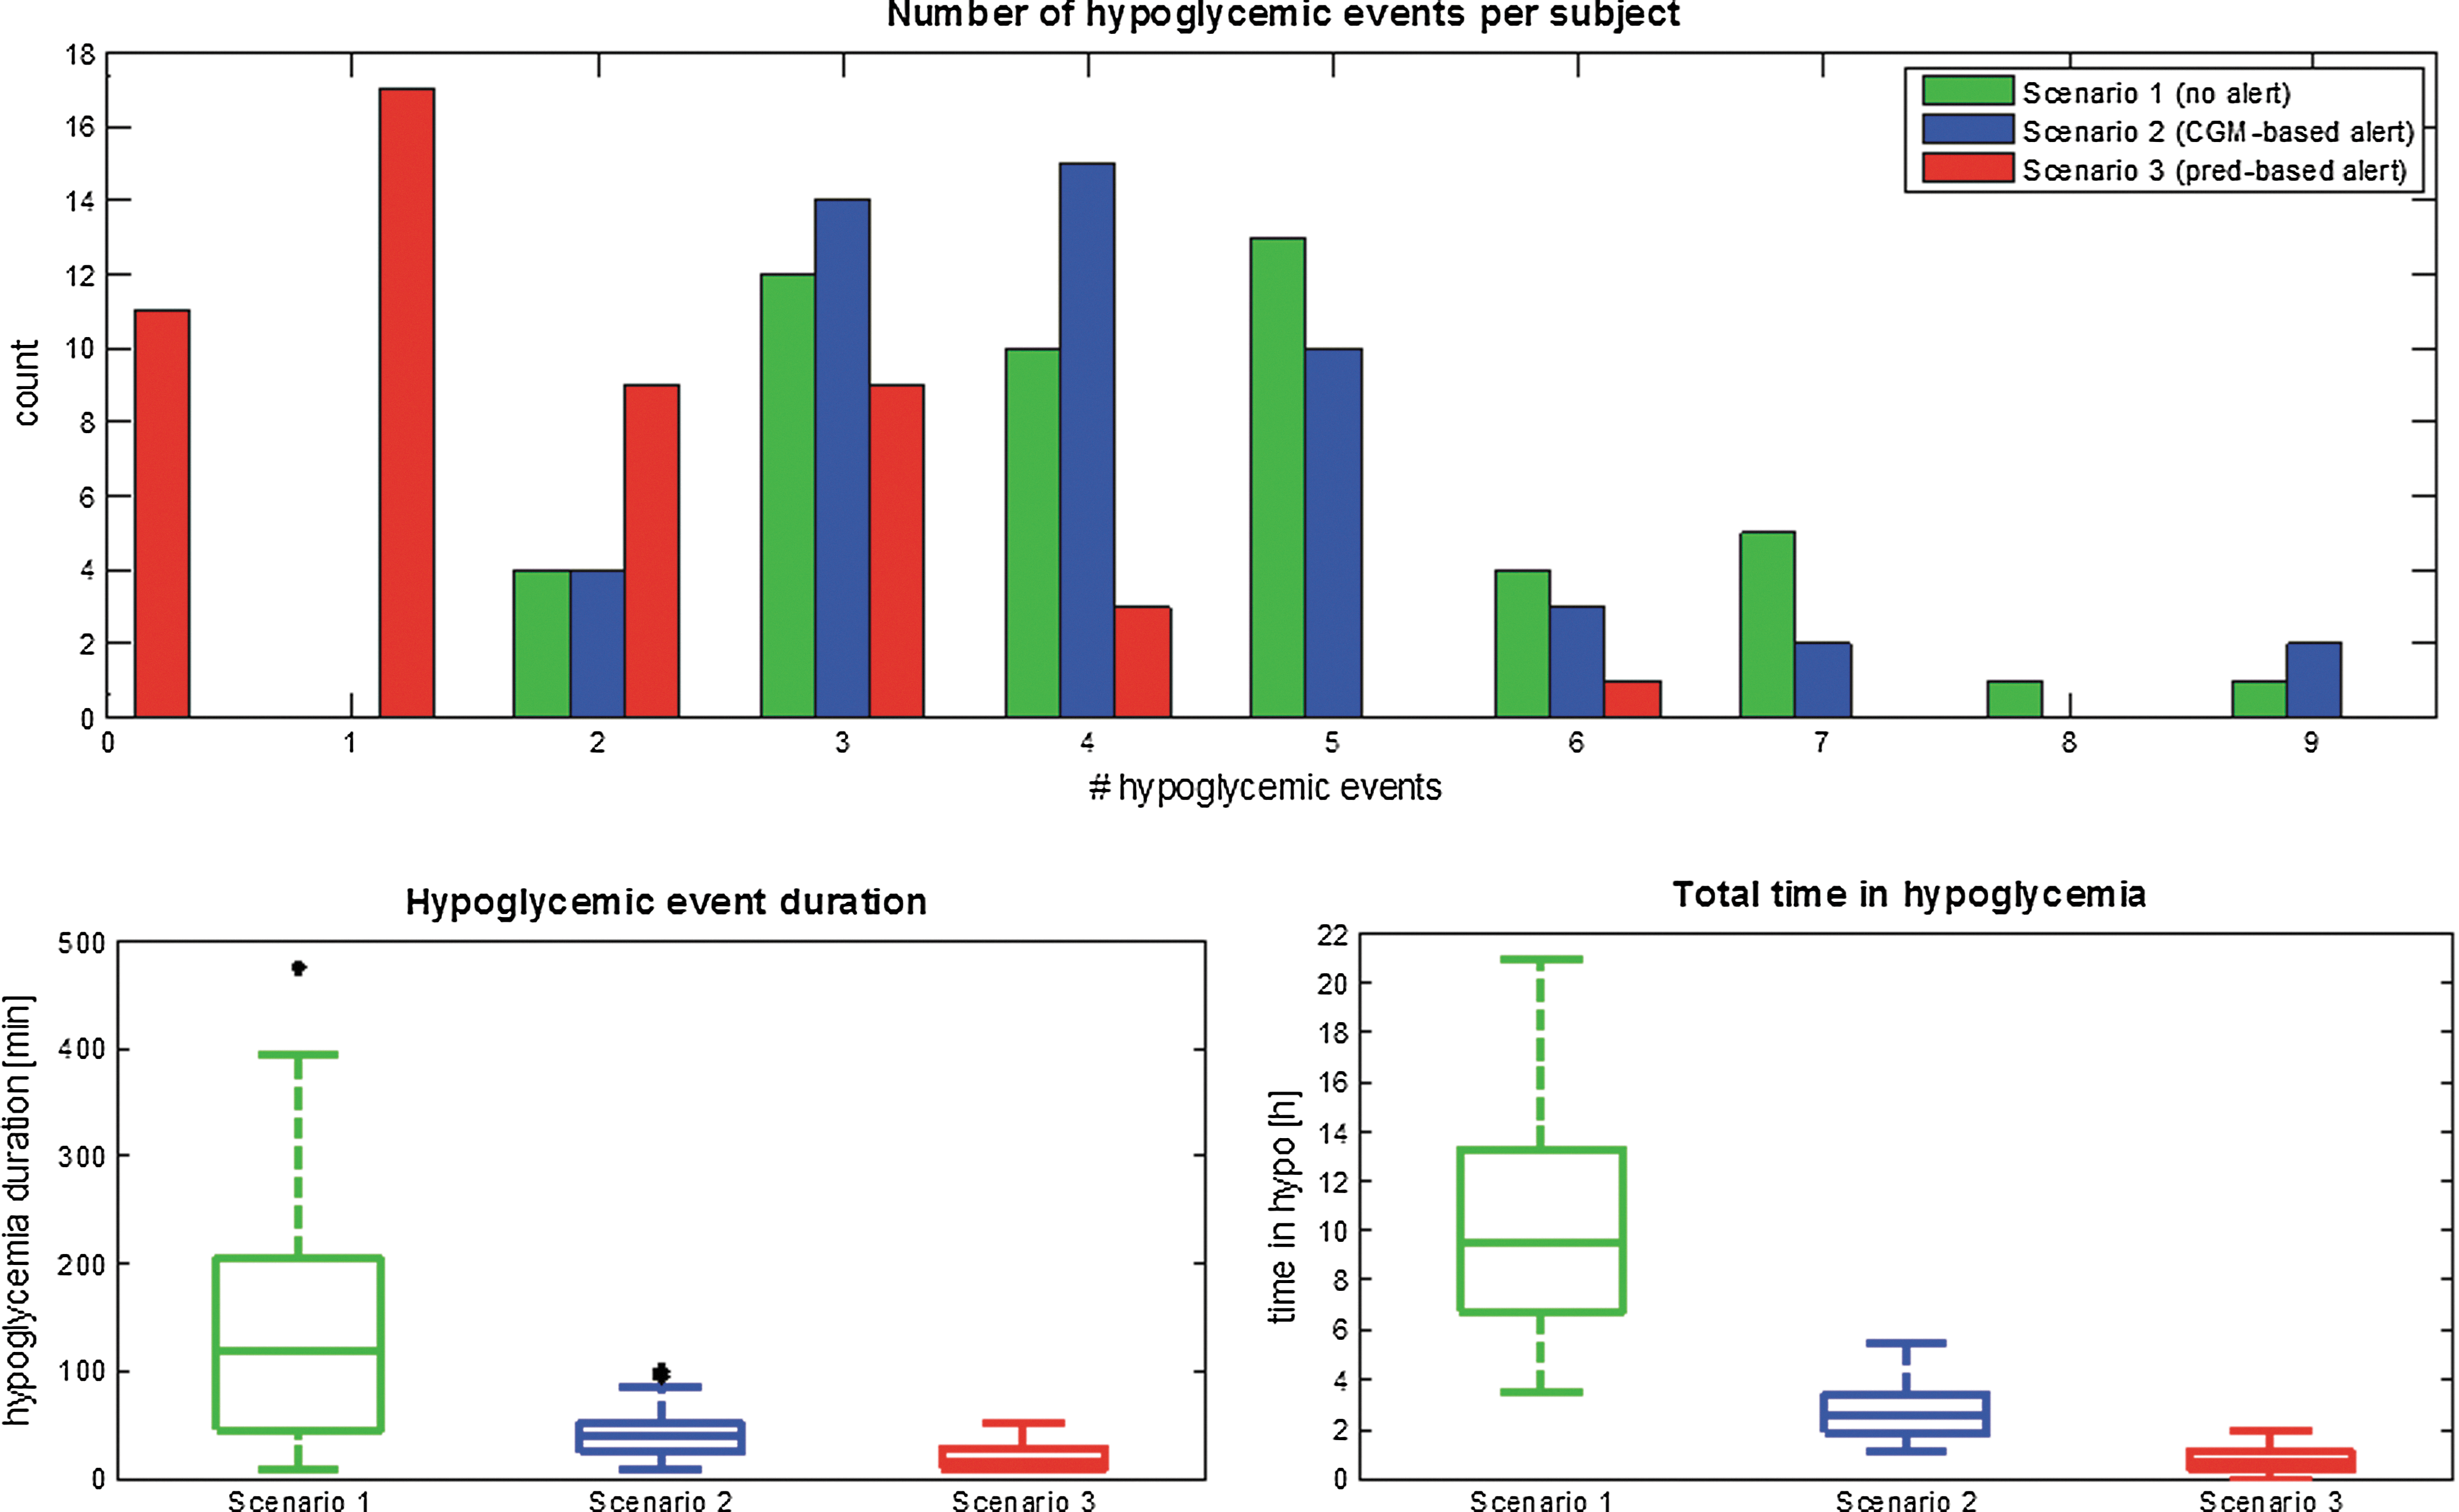
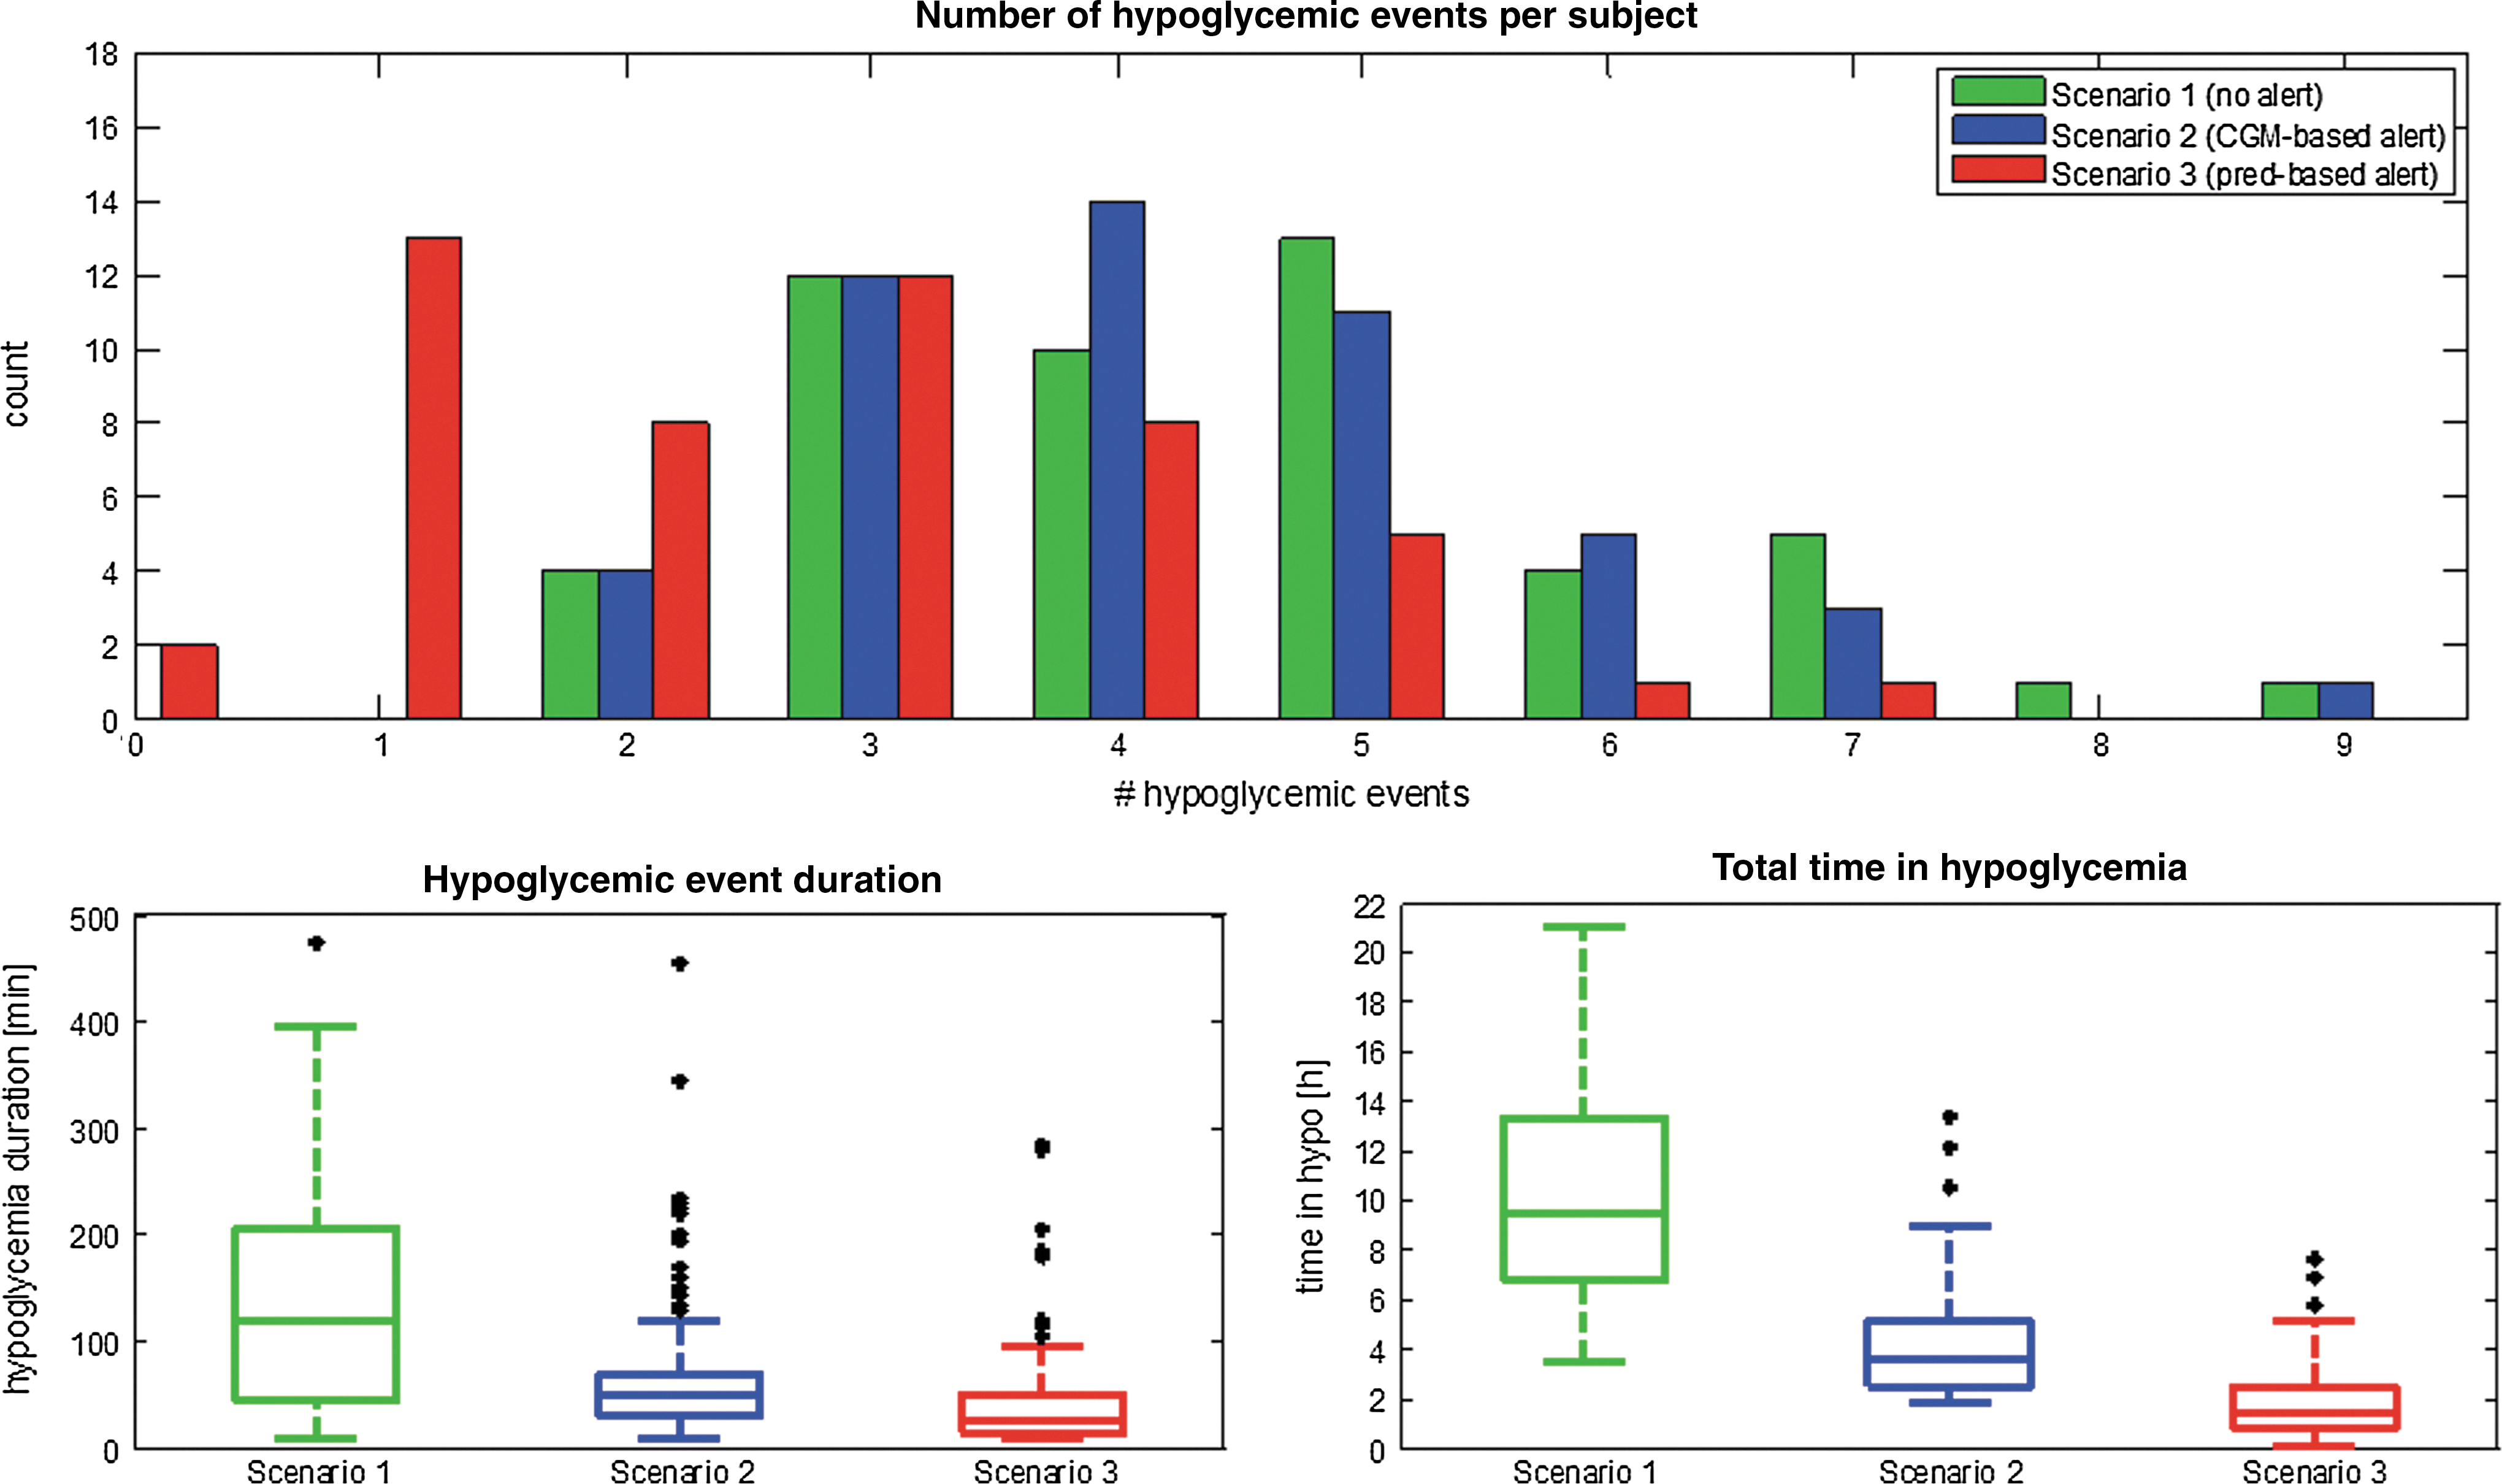
Results computed on the 50 virtual subject dataset considering the entire period of monitoring (54 h) are given in terms of median and 5th and 95th percentiles. Table 1 and Figure 4 summarize the number of hypoglycemic events, their duration, and total time in hypoglycemic range. In Scenario 1 (unawareness of hypoglycemia, no alerts), patients experience a median of four (5th, 95th percentiles, two, seven) hypoglycemic episodes, with a median duration of 120 (10, 330) min. The total time spent in the hypoglycemic range is 9 h 30 min (4 h 5 min, 20 h 30 min) over the 54-h monitoring period, which corresponds to 17.7% (7.6%, 38.0%) of the total time of monitoring. In Scenario 2, the number of hypoglycemic events is similar to that of Scenario 1. This is expected because in Scenario 2 the alarm is CGM-based; thus it is triggered when the subject is de facto already in hypoglycemia. However, the severity of hypoglycemia events is significantly mitigated (P<0.01), with a median duration of 40 (10, 70) min, for a total time in hypoglycemia of 2 h 35 min (1 h 35 min, 5 h 0 min), corresponding to 4.7% (2.9%, 9.2%) of the total time. In Scenario 3 patients could potentially avoid, or at least mitigate, many hypoglycemic events by ingesting CHO in advance. In fact, the number of hypoglycemic events is one (none, four), 75% lower than Scenarios 2 and 1 (P<0.01). In addition, in Scenario 3 the median duration of hypoglycemia events is 15 (10, 45) min, significantly shorter than in Scenario 2 (−62.5%, P<0.01) and Scenario 1 (−87.5%, P<0.01). Furthermore, in Scenario 3, the percentage of time spent in the hypoglycemic range is 1.2% (0.0%, 2.9%), corresponding to 0 h 35 min (0 h 0 min, 1 h 35 min), with a reduction of 74.5% and 93.2% with respect to Scenario 2 and Scenario 1, respectively. Figure 4 graphically summarizes the results of Table 1. In the top panel the histogram of the count of number of hypoglycemic events per patient, during the monitoring period, clearly shows that in Scenario 3 the majority of patients experience only none to three hypoglycemic events, whereas in Scenario 2 and in Scenario 1 the majority of patients experience two to four hypoglycemic events. In addition, as shown in the box plots in the bottom panels of Figure 4, hypoglycemia duration (left panel) and total time in hypoglycemic range (right panel) considerably decrease moving from Scenario 1 and Scenario 2 to Scenario 3.
P values are computed with the nonparametric Mann–Whitney U test. For Scenario 2, the P value is for comparison with Scenario 1; for Scenario 3, the top P value refers to the comparison with Scenario 1, whereas the bottom P value is for comparison with Scenario 2.
CGM, continuous glucose monitoring.
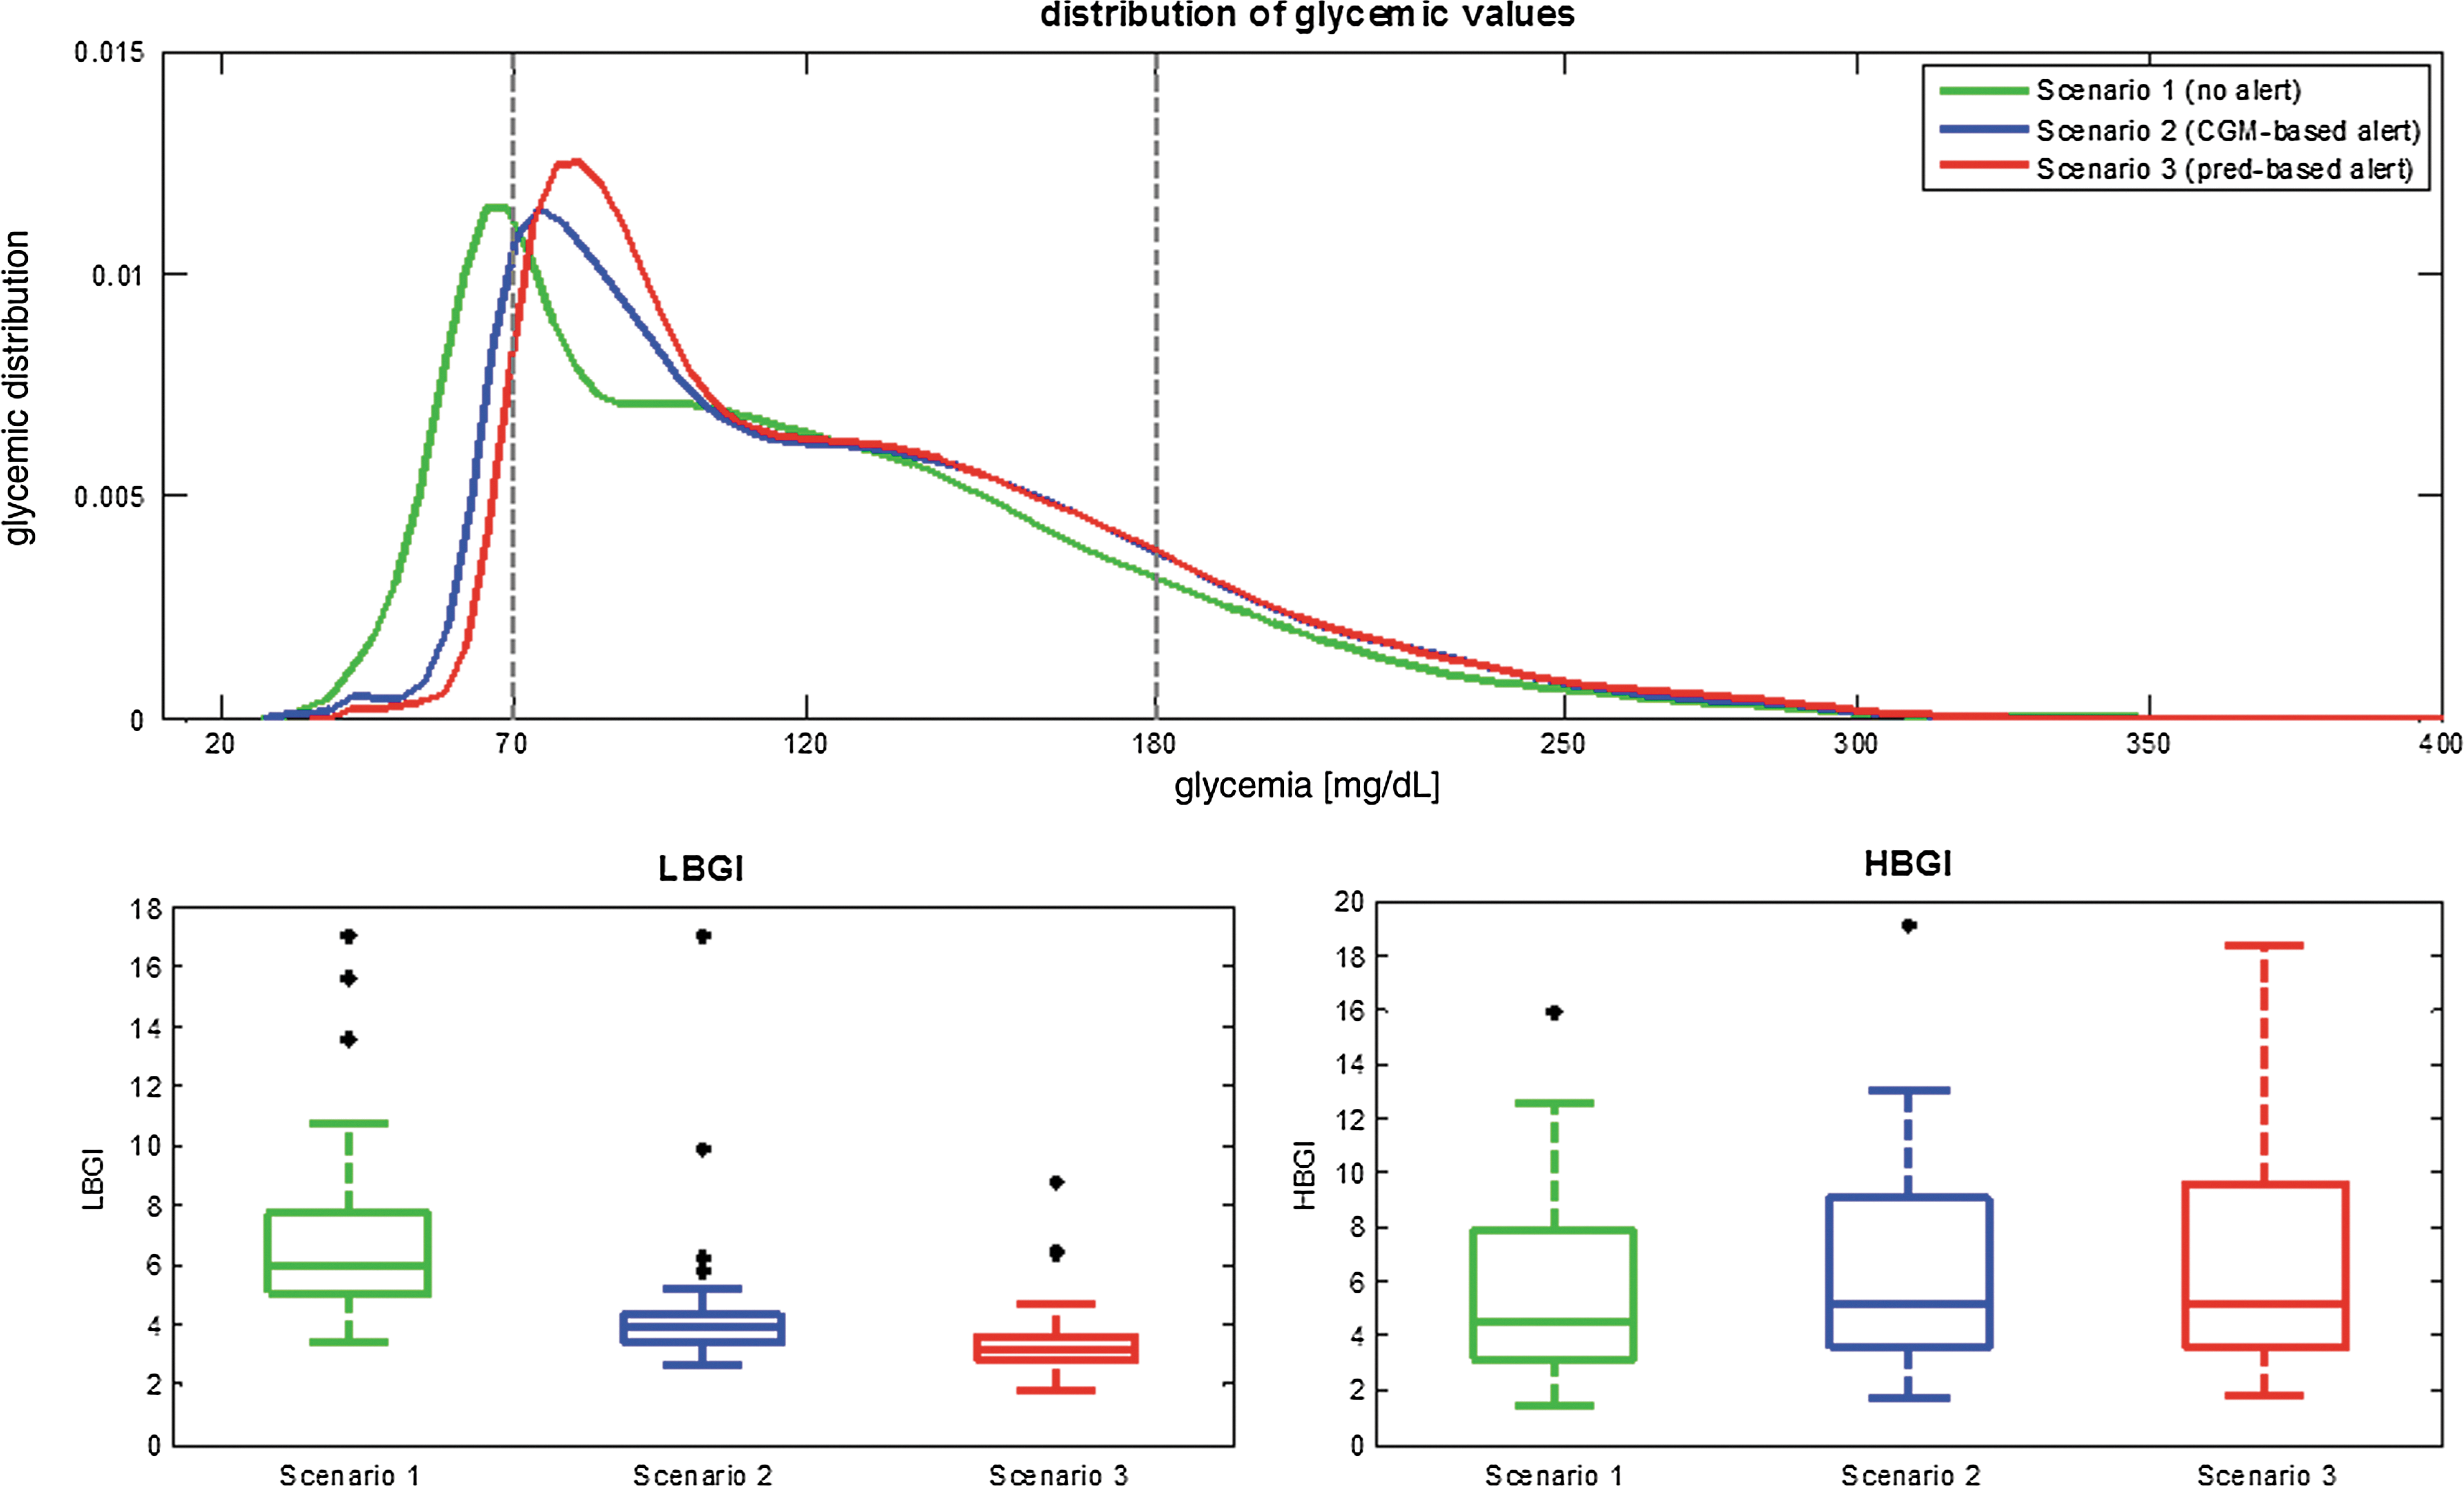
Table 2 reports, for each scenario, the median and 5th and 95th percentiles of the distribution of glucose concentration values and of LBGI and HBGI in the 50 virtual patients. As expected, the 5th percentile of the distribution of glucose concentration gradually increases in moving from Scenario 1 to Scenario 3. At the same time, the 95th percentile of glucose concentration distribution does not significantly change between Scenario 1 and Scenario 3, indicating that hypoglycemia treatments do not significantly increase the highest hyperglycemic value. This is confirmed also by the estimated distribution of glycemic values, in the three scenarios, plotted in the top panel of Figure 5. In fact, the percentage of glycemic values in the hypoglycemic range is 19% in Scenario 1 and decreases to 5% in Scenario 2 and to 1% in Scenario 3. The percentage of glycemic values in the hyperglycemic range is 14% in Scenario 1 and 17% in both Scenario 2 and Scenario 3. Also, the analysis of LBGI and of HBGI, summarized in Table 2, confirms that the risk of hypoglycemia is significantly reduced (P<0.01), without any increased risk of hyperglycemia (P>0.5), in moving from Scenario 1 to Scenario 2 and to Scenario 3. This can be deduced also by visual inspection of the box plots of the distribution of LBGI and HBGI values in all the 50 subjects (bottom panels of Fig. 5).

P values computed with the nonparametric Mann–Whitney U test are also reported. For Scenario 2, the P value is for comparison with Scenario 1; for Scenario 3, the top P value refers to the comparison with Scenario 1, whereas the bottom P value is for comparison with Scenario 2.
CGM, continuous glucose monitoring; HBGI, High Blood Glucose Index; LBGI, Low Blood Glucose Index.
Robustness and Domain of Validity of the Analysis
Delayed/absent patient's response to alerts
In the previous section we simulated the virtual patients responding to alerts in no more than 5 min in both Scenario 2 (CGM-based alerts) and Scenario 3 (prediction-based alerts). However, in real-life conditions, subjects could be unable to promptly ingest CHO or to hear the alarm. For example, in the real case studies documented in Buckingham et al. 35 young patients did not respond to 34% of the alerts. In Choudhary et al. 36 patients did not respond to hypoglycemia alerts in 4.2% of the cases, and it took them on average 17 min during daytime, and 60 min during nighttime, to take countermeasures in case of hypoglycemia.
To assess the effect of delayed/absent responses to alerts, we did additional simulations introducing delays in CHO ingestion and the possibility of no CHO ingestion at all, in both Scenarios 2 and 3. In particular, every time an alarm is triggered (on the basis of either CGM or prediction), the probability is 0.85 that the subject ingests 15 g of CHO after a delay uniformly distributed in the time interval 0–30 min, versus a probability of 0.15 that no ingestion of CHO at all occurs. In the case of absent response, if the subject is still in hypoglycemia, a new alert is triggered after 30 min. In the case of delayed response, the new alert is generated 30 min after the subject has effectively ingested CHO, if he or she is still in hypoglycemia. Every time an alert is given, the same procedure just described is repeated (i.e., the patient either ignores the alert or ingests CHO with a certain delay).
Figure 6 and Table 3 summarize the results in terms of number of hypoglycemic events per patient, their duration, and total time in the hypoglycemic range during the monitoring period. By comparing results with those of the best-case scenario of Figure 4 and Table 1, we can clearly note a deterioration of the benefits of CGM-based and prediction-based alerts coupled with CHO ingestion. There is still a visible and significant reduction of number of hypoglycemic events and of their duration passing from Scenario 2 to Scenario 3 (P<0.01). In Scenario 2, as expected, the number of hypoglycemic events in Table 3 cannot worsen with respect to Table 1 because in both cases the CGM-based alerts are generated when the subject is already in hypoglycemia. In Scenario 3 the number of hypoglycemic events in Table 3 increases with respect to Table 1, and a median of three (one, five) hypoglycemic events per subject was observed. In particular, moving from Scenario 2 to Scenario 3, the number of hypoglycemic events significantly decreases by 25% (P<0.01). Hypoglycemia duration in Table 3 is longer than in Table 1 and is equal to 50 (10, 149) min in Scenario 2 and to 25 (10, 112) min in Scenario 3. In fact, in Scenario 3 the duration of hypoglycemic events decreases by 50% with respect to Scenario 2 (P<0.01). The total time in the hypoglycemic range is equal to 3 h 35 min (1 h 55 min, 10 h 35 min) in Scenario 2 and to 1 h 30 min (0 h 20 min, 5 h 45 min) in Scenario 3 (significant reduction of 59%, P<0.01). The distribution of glycemic values is reported in Table 4 and in Figure 7, top panel. The shape of the distribution of glucose shows a mild increase in the percentage of values in hypoglycemic range in Scenarios 2 and 3, with respect to Table 2 and to Figure 5, top panel. However, as confirmed by P values, ingestion of CHO on the basis of predicted glycemia, even if delayed or sometimes ignored, still significantly increases the lowest glycemic concentration experienced by patients. In fact, the percentage of glycemic values in the hypoglycemic range is equal to 8% in Scenario 2 and to 4% in Scenario 3. Analysis of LBGI and HBGI values, reported in Table 4 and in Figure 7, bottom panels, confirms that, moving from Scenario 2 to Scenario 3, a significant decrease of the risk of hypoglycemia occurs, without any parallel increase of the hyperglycemia risk.
As in Figure 4 but in the presence of delays in answering to alerts. CGM, continuous glucose monitoring; prediction. Color image available online at
As in Figure 5 but in the presence of delays in answering to alerts. CGM, continuous glucose monitoring; HBGI, High Blood Glucose Index; LBGI, Low Blood Glucose Index; pred, prediction. Color image available online at
P values are computed with the nonparametric Mann–Whitney U test. For Scenario 2, the P value is for comparison with Scenario 1; for Scenario 3, the top P value refers to the comparison with Scenario 1, whereas the bottom P value is for comparison with Scenario 2.
CGM, continuous glucose monitoring.
P values computed with the nonparametric Mann–Whitney U test are also reported. For Scenario 2, the P value is for comparison with Scenario 1; for Scenario 3, the top P value refers to the comparison with Scenario 1, whereas the bottom P value is for comparison with Scenario 2.
CGM, continuous glucose monitoring; HBGI, High Blood Glucose Index; LBGI, Low Blood Glucose Index.
In conclusion, delays in responding to hypoglycemia alerts, or absence of response, obviously worsen the results obtained in Scenarios 2 and 3 in Results. However, because delayed/absent ingestion of CHO affects in a similar way Scenarios 2 and 3, the relative difference between these two scenarios remain significant: in fact, passing from Scenario 2 to Scenario 3, the total time in the hypoglycemic range decreases by 59%, the hypoglycemia duration decreases by 50%, and the number of hypoglycemic events decreases by 25%.
Limitations of the adopted in silico environment
In the present study we resorted to the simulation environment because it allows a fair comparison of different scenarios. Indeed, starting from a given initial patient condition, three alternative scenarios could be considered, corresponding to different actions, which in real experiments would have mutually excluded each other. However, even if widely used to preliminarily test new algorithms, given its sufficient realism, 37 –40 the adopted in silico environment of Kovatchev et al. 20 has some limitations.
A first limit is that it is not possible yet to take into account intrasubject variability, and there is no model for the various factors that influence glycemia in real life, like, for example, stress and illness. This issue has been partially dealt with by simulating a large number of patients (50 synthetic subjects) for a short period of time (54 h), rather than simulating a few patients for longer periods.
A second restriction is the use of a simple model for sensor noise (i.e., white Gaussian noise with constant variance). Several studies indicated that correlated errors/drift are likely to occur in CGM, 5 but well-established models, more sophisticated than that used in the present article, are, at present, unavailable. Only a few literature contributions devoted some space to sensor noise characterization: in Chase et al. 23 sensor noise was modeled as a random white Gaussian process with coefficient of variation constant in time and arbitrarily chosen by the user; Breton and Kovatchev 41 proposed an autoregressive model to describe a combination of sensor noise plus blood glucose-to-interstitial glucose kinetics model error, but the domain of validity of this model is limited 26 ; and, finally, our group 42 showed that the Menarini (Florence, Italy) Glucoday® CGM sensor data are consistent with a time-varying measurement error variance, but no models of noise heteroscedasticity were investigated. However, although simulating correctly the different components of sensor noise would be obviously important in comparing the ideal (glucose concentration is measured in the blood) versus the practically feasible (glucose concentration is measured with error in the subcutis by a CGM sensor) situation, the conclusions drawn from the key comparison of the present article (i.e., Scenario 2 vs. Scenario 3) would remain similar. Indeed, all the above-cited sources of error would affect both scenarios. As far as the ideal versus practically feasible situation is concerned, it is also worthwhile recalling that, when real CGM data affected by systematic errors are considered, enhancement/calibration methods exploiting sparse SMBG references can be used to improve their accuracy, 24,25,27 –29 as already mentioned in In silico database.
To conclude, we remark that the simulated analysis performed in the present article cannot capture all the aspects of reality, but any bias equally affects results observed in Scenario 2 (CGM-based alert) as well as in Scenario 3 (prediction-based alert). Thus, on one hand, the absolute results presented in this article could be considered an upper bound of what could be observed in real life. On the other hand, the relative difference between the results obtained in Scenario 2 (CGM-based) and Scenario 3 (prediction-based alert) would probably not change significantly. It is also useful mentioning that research work is in progress to improve the University of Virginia/Padova simulator (e.g., by developing tools to take into account intrapersonal physiological changes 43 [this will allow to simulate longer monitoring periods] and by considering more realistic models of CGM sensor errors 44 ).
Conclusions
Since the pioneering study by Bremer and Gough, 2 CGM-based short-term glucose prediction algorithms are believed to allow the patient to take appropriate countermeasures to avoid/mitigate the hypoglycemia event. However, a quantitative comprehensive assessment is still lacking in the literature because the only assessments published so far concern clinical studies in humans where multiple parallel scenarios for the same subject cannot be investigated. By generating data for 50 virtual subjects, in this work we compared occurrence and duration of hypoglycemic events in three scenarios occurring in the same patient (i.e., hypoglycemia unawareness and no countermeasure [Scenario 1], ingestion of 15 g of CHO as glucose concentration measured by CGM sensor crosses the hypoglycemic threshold [Scenario 2], and ingestion of 15 g of CHO as the glucose concentration predicted 30 min ahead of time crosses the hypoglycemic threshold [Scenario 3]). Results show that, by generating hypoglycemia alerts based on prediction, hypoglycemia occurrence could be mitigated and almost totally avoided (a median of one hypoglycemic event in 54 h of monitoring), and time spent in hypoglycemia could be reduced to 1.2% of the period of monitoring, corresponding to 35 min in 54 h. A specific prediction algorithm (i.e., the recently presented neural network-based algorithm of Zecchin et al. 12 ), was chosen, but the assessment could be repeated by forecasting glycemia through any of the several prediction strategies proposed in the literature. Needless to say, algorithms particularly accurate in predicting future hypoglycemia would generate highly effective prediction-based alerts.
Because the focus of this article was in assessing how much the number and duration of hypoglycemic events can be potentially reduced thanks to the use of prediction methods, we have not considered the problem of how to generate alerts and have limited ourselves to using a simple threshold comparison strategy. In fact, generating alerts from CGM profiles is a critical issue because of data noise. In the literature, a few results are available, and the efficacy of existing alerting systems, especially in terms of robustness against false alerts, is controversial. 45,46 In addition, because the uncertainty in the CGM data due to noise is amplified when predictions are estimated, the problem of avoiding false alerts is exacerbated when predicted profiles are considered (for example, in Scenario 3 we had, on average, one false alert every 39 h). This suggests that, although it is true that important improvements in the signal-to-noise ratio can be achieved by denoising techniques like those proposed previously, 24,25,27 –29 efforts of investigators should concentrate on the development of new “smart” alert generation strategies exploiting the potential benefits of glucose prediction algorithms.
Footnotes
Author Disclosure Statement
No competing financial interests exist.