
Abstract
Background:
Experimental and in vitro studies have related glycemic variability (GV) with activation of oxidative stress, which could be involved in the micro- and macrovascular damage found in diabetes mellitus and in acute complications such as hypoglycemia. Some GV indexes are currently integrated in specialized Web sites for the analysis and assessment of diabetes patients through telemedicine. We aimed to identify the impact of telemedicine on metabolic control and GV in prepubescent patients with type 1 diabetes mellitus (T1DM).
Subjects and Methods:
Eighty patients between 6 and 10 years old were eligible for enrollment. Participation was accepted by the parents of only 15 (18%) patients, of whom 13 (86%) completed the study. These 13 patients were assessed fortnightly for 3 months through Accu-Chek® (Roche, Mannheim, Germany) Smart Pix software; this period was compared with a subsequent 4-month period without telemedical support. The variables analyzed were mean glycated hemoglobin (HbA1c), Mean Blood Glucose (MBG), and indexes of GV (SD, Low Blood Glucose Index [LBGI], High Blood Glucose Index [HBGI], and the Average Daily Risk Range [ADRR]). In both periods, the patients attended their regular appointments. The statistical analysis was carried out with nonparametric tests (the Wilcoxon and Friedman tests, P<0.017).
Results:
At the end of the assessment phase, mean HbA1c levels were significantly reduced (P=0.012) with no significant reductions in the LBGI (P=0.115), ADRR (P=0.552), or SD (P=0.700). No significant increases were observed in MBG (P=0.861) or the HBGI (P=0.807). HbA1c and the LBGI, ADRR, and SD indexes increased when telemedical assistance was suspended, whereas MBG and the HBGI showed a nonsignificant reduction.
Conclusions:
Telemedical assessment for 3 months in children improved metabolic control, by reducing HbAlc values and, to a lesser extent, by decreasing GV, without increasing acute complications. Metabolic control was reduced when the advice was suspended.
Introduction
Acute glycemic fluctuations, known as glycemic variability (GV), 1 –5 may be among the causes of the complications of diabetes mellitus; in vitro studies performed in distinct human and rat cell lines, and reproduced in animal models, have shown that GV generates excessive protein glycosylation and oxidative stress secondary to free radical release, which could increase micro- and macrovascular injury similar to the effect of prolonged hyperglycemia. 1,2,4,6 The association between GV and microvascular complications, however, has not been consistently demonstrated in diabetes patients, and there are no studies on the association between GV and macrovascular injury in this population.
There are approximately 35 indexes, based on blood glucose values obtained from continuous glucose monitoring or self-monitored blood glucose (SMBG), to determine GV; some of these indexes are currently integrated in telemedicine assessment Web pages.
The first attempts at improving glycemic control in children with T1DM through telemedicine were made in 1992, with contradictory results on HbA1c control. 7 –9 In 2000, Liesenfeld et al. 10 achieved a significant reduction in SD, Mean Blood Glucose (MBG), and HbA1c levels, but in subsequent studies of telemedicine assessment in children and adolescents, nonsignificant decreases in HbA1c were found. 9,11,12
Currently, the challenge of intensive insulin therapy in children with diabetes is to maintain low HbA1c values 6,13 and control GV to limit hypoglycemic episodes. However, the frequency of these episodes continues to impair pediatric metabolic control. 2,14
The main objective of this study was to identify the impact of a 3-month telemedicine assessment on metabolic control and GV in children with T1DM to reinforce routine clinical follow-up. A secondary aim was to evaluate acceptance of and satisfaction with telemedicine assessment. Preliminary results of this study have been published in abstract form. 15
Subjects and Methods
A cohort study was performed in the Diabetes Unit of Sant Joan de Deu University Hospital in Barcelona, Spain, in three phases. The inclusion, exclusion, and withdrawal criteria were as follows:
Inclusion criteria
The inclusion criteria were as follows: (1) diagnosis of T1DM using the criteria of the International Society for Pediatric and Adolescent Diabetes 16 and of the American Diabetes Association 17 and a minimum disease duration of 1 year, (2) age between 6 and 10 years and Tanner stage 1, (3) multiple daily insulin injection regimen and a minimum of 2 months receiving the same insulin regimen, and (4) familiarity with and use of carbohydrate counting.
Exclusion criteria
The following were exclusion criteria: (1) associated disease, except controlled celiac (asymptomatic, adequate growth for age, and negative anti-tissue transglutaminase antibodies at some point in the 6 months prior) and/or thyroid (euthyroid patients whether receiving medication or not) disease, (2) high-level competitive sports, and (3) continuous subcutaneous insulin infusion.
Withdrawal criteria
The following were withdrawal criteria: (1) not performing the suggested minimum number of daily glycemic measurements (less than four), (2) failure to send blood glucose measurements every 2 weeks, (3) nonattendance at anthropometric and HbA1c evaluations, and (4) voluntary withdrawal.
Study design
In the first phase, of 635 patients in the database of the Pediatric Diabetes Unit, 80 children were identified who met the inclusion criteria. Of these children, the parents of 15 allowed them to participate in the study.
Written information on the confidentiality of the Emminens Conecta program (Roche, Mannheim, Germany) was provided, and informed consent was obtained from the parents of all participating children. Training sessions were held on Accu-Chek® (Roche) Smart Pix software, the use of capillary blood glucose monitors, and the Accu-Chek Smart Pix USB device. Two families without a computer were given a mobile telephone with an integrated system to send capillary blood glucose values from the glucometer.
For each child, a personal registry was completed with identification data, origin, insulin regimen, carbohydrate servings, and physical activity. In accordance with the recommendations of the International Society for Pediatric and Adolescent Diabetes 16 and American Diabetes Association, 17 variables for the follow-up and assessment of each patient, such as blood glucose targets, insulin sensitivity factor, and the insulin/carbohydrate index, were obtained.
In the second phase, a 3-month telemedicine assessment was performed every 2 weeks. The families sent SMBG data via the Web and, through short message service, provided information on changes to the insulin dosage and events such as hypo- or hyperglycemic episodes and their management, as well as on acute illnesses or changes in activity. Blood glucose data were analyzed, using the graphs generated by the software, and, within 24 h of receiving the data from the parents, suggestions were sent through the Web or by short message service. Assessments were performed by the same researcher with the support of a diabetes specialist attending each patient. At the end of this phase, a survey to evaluate the assessments was carried out through telemedicine technology.
The third phase consisted of 4 months without assessment. The families continued to upload data on blood glucose values and provide information on changes in insulin regimens and other events every 2 weeks but received no telemedical support.
The GV indexes were calculated with the blood glucose measurements made over 14 days at the start of the assessment phase (0 months), at the end of the assessment phase (3 months), and at the end of the assessment-free phase (7 months).
HbA1c and anthropometric measurements were performed at baseline (the beginning of the study), 1 month after the end of the assessment phase, and at the end of the assessment-free phase (at 0, 4, and 7 months, respectively).
During the 7 months of the study, the children attended their regular clinic visits at the Diabetes Unit every 3 months.
Description of the variables
The mean measurements (HbA1c and MBG) and indexes of glycemic variability (SD, Low Blood Glucose Index [LBGI], High Blood Glucose Index [HBGI], and Average Daily Risk Range [ADRR]) are described below:
HbA1c. 6,18 –21
This variable is the standard measure of metabolic control and was related with the mean glucose values in the 12 weeks before the baseline quantification. The normal range is 4.2–5.9% (DCA2000 apparatus; Bayer).
MBG. 2,11,21 –23
This parameter is the mean value of the SMBG values sent by the patient and can vary with respect to the patient's real MBG value depending on the timing of quantification. The MBG value over 1 month can significantly predict future hyperglycemia.
SD. 3,4,10,23,24
The SD of blood glucose values over 10 days has been associated with future hyperglycemic episodes. The target level for this indicator is ([SD×2]<MBG). High SD values are explained by wide variability due to several factors such as insulin deficiency or late insulin administration, gastroparesis, snacking, and insulin pump requirements, among others.
LBGI. 18,21 –25
The LBGI combines the frequency and duration of low blood glucose values. This index predicts the risk of severe hypoglycemia in up to 63–75% of episodes in the 24 h before the event and in 40–55% of severe hypoglycemic episodes in the following 6 months. Values lower than 2.5 indicate low risk, those between 2.5 and 5 indicate moderate risk, and those above 5 indicate high risk.
HBGI. 18,21 –24
This index gathers high values and predicts hyperglycemia. The reliability of this index increases when it is combined with the ADRR. Values below 10 indicate low risk, those between 10 and 20 indicate moderate risk, and those higher than 20 indicate a high risk of hyperglycemic episodes.
ADRR. 2,24
The ADRR is calculated using extreme values and estimates the risk of future hypo- and hyperglycemic episodes. Values below 20 indicate low risk, those between 20 and 40 indicate moderate risk, and those above 40 indicate high risk.
Statistical analysis
For each of the quantitative variables, the presence of significant differences was evaluated between the three distinct periods encompassing a total of 7 months. Differences were tested through the Friedman and Wilcoxon nonparametric tests for paired data. P values for multiple comparisons among paired data were adjusted by Bonferroni's method, establishing a new cutoff point for statistical significance at P<0.017. Analyses were performed using SPSS version 17 software (SPSS, Inc., Chicago, IL).
The telemedicine Web platform used was the Emminens Conecta, a support system based on specific software (Accu-Chek Smart Pix) that correlates the information sent by patients (SMBG) taken directly from their glucometer (Roche), which allows analyses of GV with the following indexes: HBGI, LBGI, ADRR, and SD. The platform also includes MBG.
This study was approved by the Research Committee of the Sant Joan de Déu University Hospital and by the Ethics Committee of the Sant Joan de Déu Foundation for Clinical Research, Esplugues de Llobregat, Barcelona, Spain.
Results
The sample of this pilot study was composed of 15 children from distinct areas of Catalonia. One boy was unable to start the study because of technical difficulties with the computer system, and one girl was withdrawn at the end of the assessment phase because of failure to send blood glucose data. The study was completed by eight girls and five boys. Age at diagnosis of T1DM ranged from 1.5 to 7.3 years, with a mean of 4.2 years. Table 1 shows the patients' characteristics at baseline. The mean number of blood glucose measurements was 5.8 per day (range, 4.8–7.4), with no significant differences among the three study phases (P=0.423). Four children had celiac disease. During the assessment phase, one girl received risperidone, and six children had an acute respiratory infection. Of these, influenza A virus infection was confirmed in two: one child developed simple hyperglycemia, and the other had hyperglycemia with ketosis. During the assessment-free phase, only one child developed an acute respiratory infection. There were no reports of severe hypoglycemia or ketoacidosis in any of the study phases.
BMI, Body Mass Index; HbA1c, glycated hemoglobin.
Table 2 shows descriptive data (range, mean, and SD) for each of the variables evaluated during the study.
Numbers refer to the initial period (0), the 3-month assessment phase (1), and the 4-month phase without assessment (2).
ADRR, Average Daily Risk Range; HbA1c, glycated hemoglobin; HBGI, High Blood Glucose Index; LBGI, Low Blood Glucose Index; MBG, Mean Blood Glucose.
Significant changes were found in HbA1c and LBGI. HbA1c was significantly reduced at the end of the assessment phase compared with initial values and was significantly increased at the end of the assessment-free phase (Table 3). Figure 1 shows that the reduction in mean HbA1c in the assessment phase was accompanied by a narrowing between the upper and lower limits. The mean LBGI value showed a nonsignificant decrease at the end of the assessment phase compared with the baseline value, followed by a significant increase at the end of the assessment-free phase. At the end of the assessment phase, the range between the upper and lower limits decreased with respect to the baseline and final limits (Fig. 2).

Behavior of glycated hemoglobin (HbA1c) in the three study periods: at baseline (HbA1c_0), at the end of the 3-month assessment phase (HbA1c_1), and at the end of the 4-month phase without assessment (HbA1c_ 2). The upper and lower limits in each period are included.
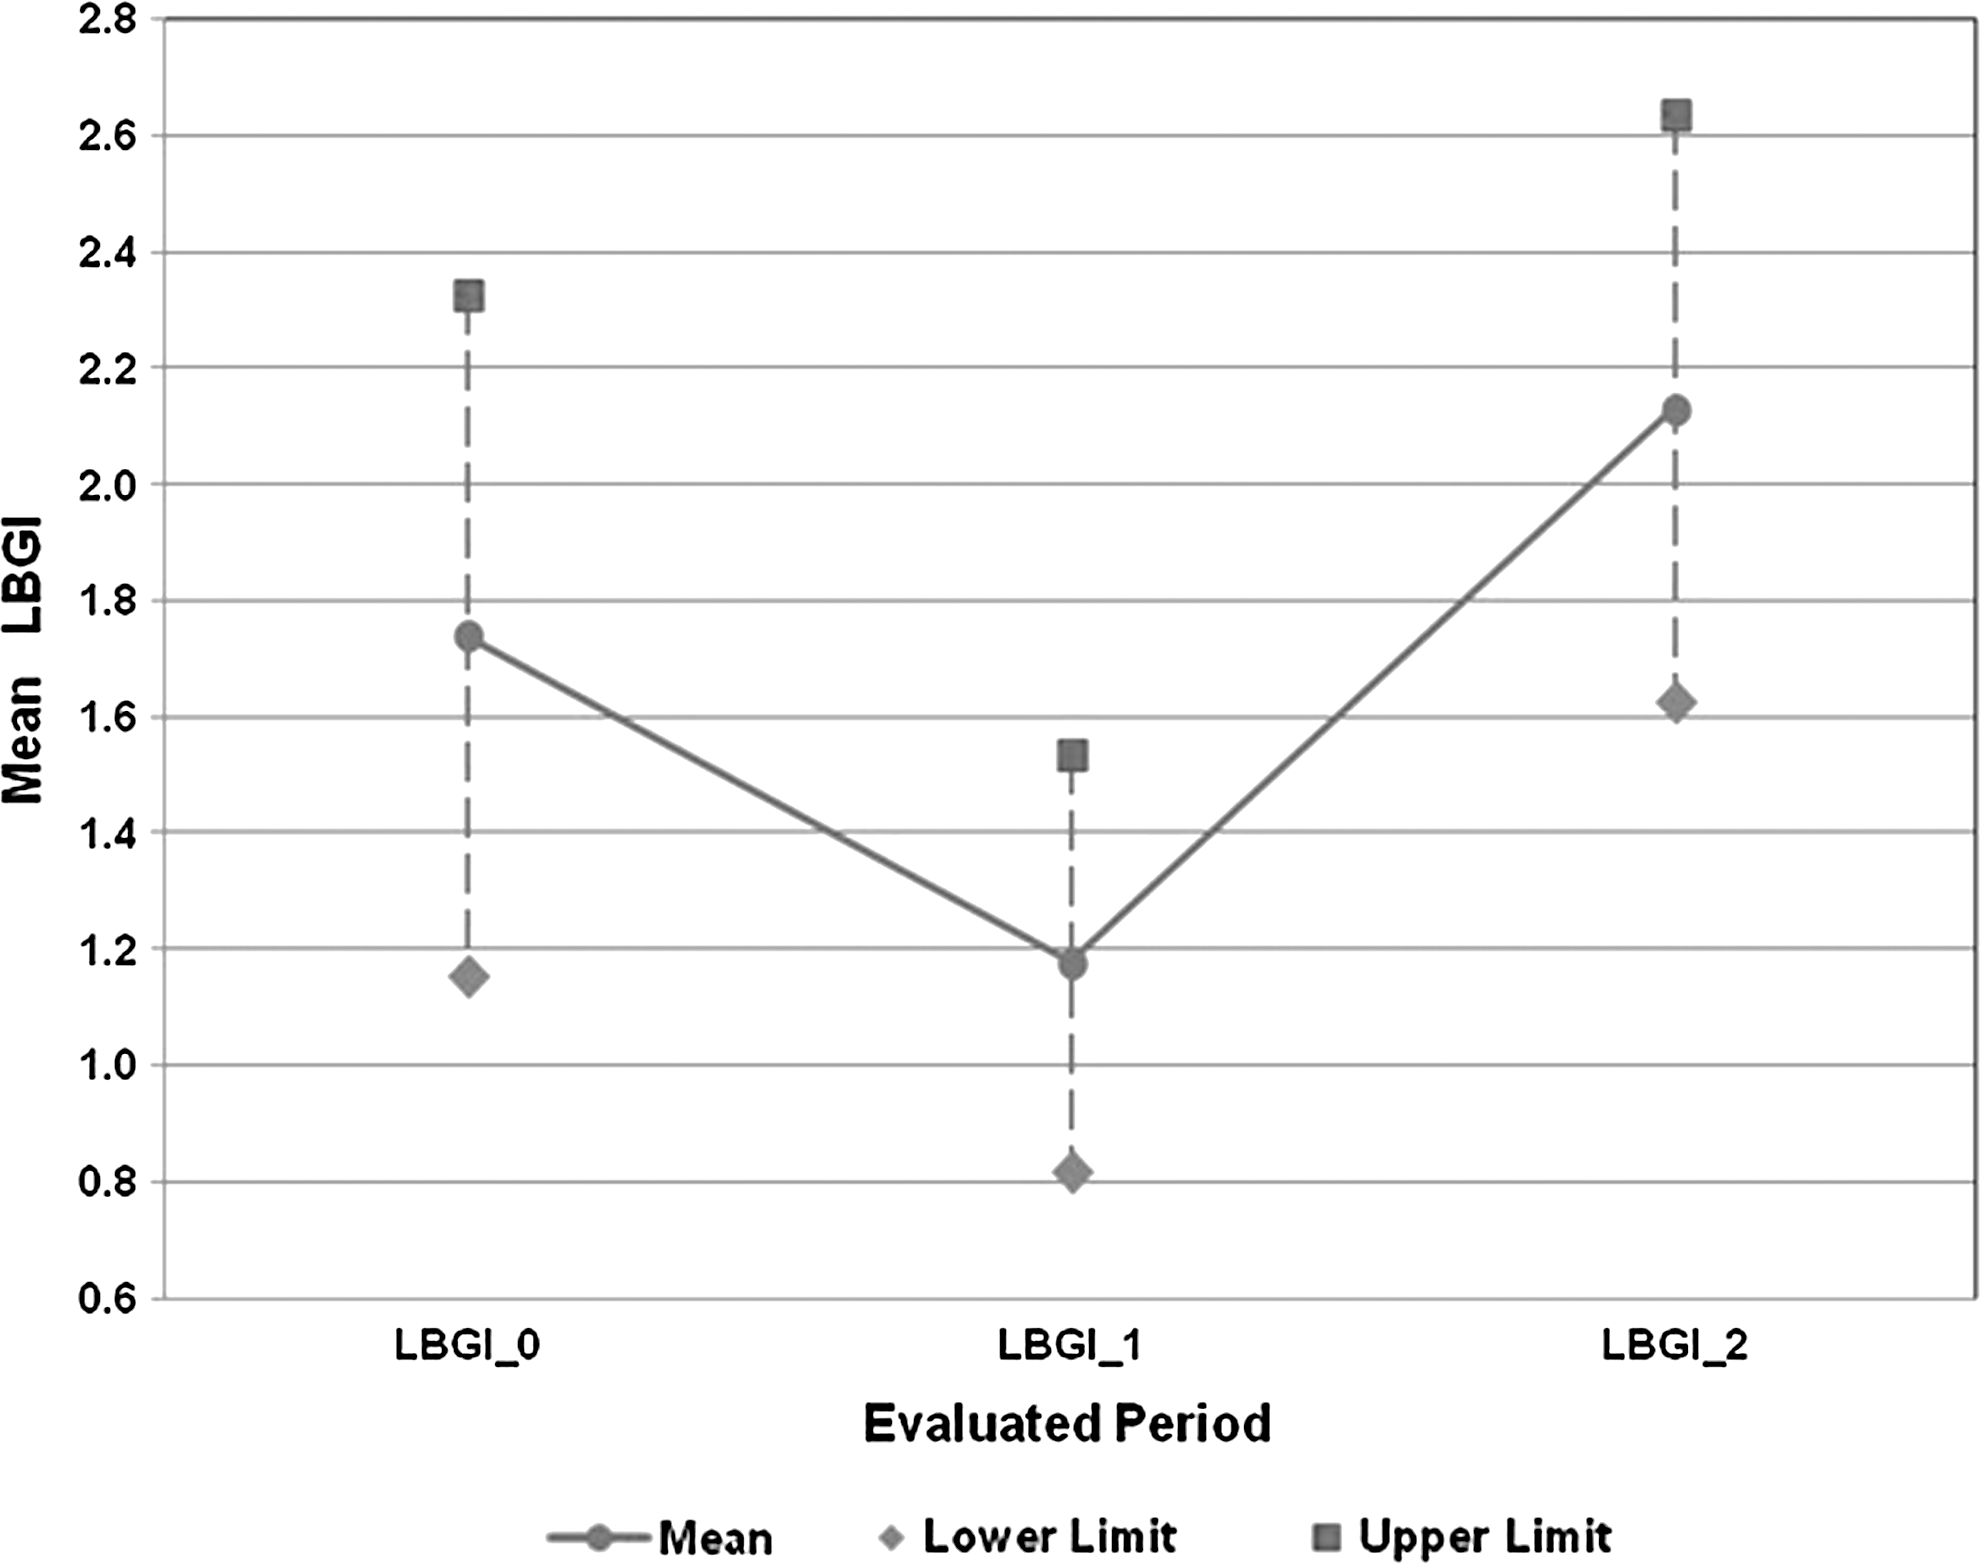
Behavior of the Low Blood Glucose Index (LBGI): at baseline (LBGI_0), at the end of the 3-month assessment phase (LBGI_1), and at the end of the 4-month phase without assessment (LBGI_2). The upper and lower limits in each period are included.
Statistically significant difference (P<0.017).
ADRR, Average Daily Risk Range; HbA1c, glycated hemoglobin; HBGI, High Blood Glucose Index; LBGI, Low Blood Glucose Index; MBG, Mean Blood Glucose.
The HBGI and MBG showed a nonsignificant increase at the end of the assessment phase and a nonsignificant decrease at the end of the assessment-free phase (Figs. 3 and 4, respectively). The upper limits of HBGI and MBG, however, were unchanged in the assessment phase with respect to the baseline value, and the SD of both variables decreased at the end of the assessment phase (Table 2). In contrast, the ADRR showed a nonsignificant decrease in the assessment phase and a subsequent increase in the assessment-free phase to a level above the baseline value (Fig. 5).
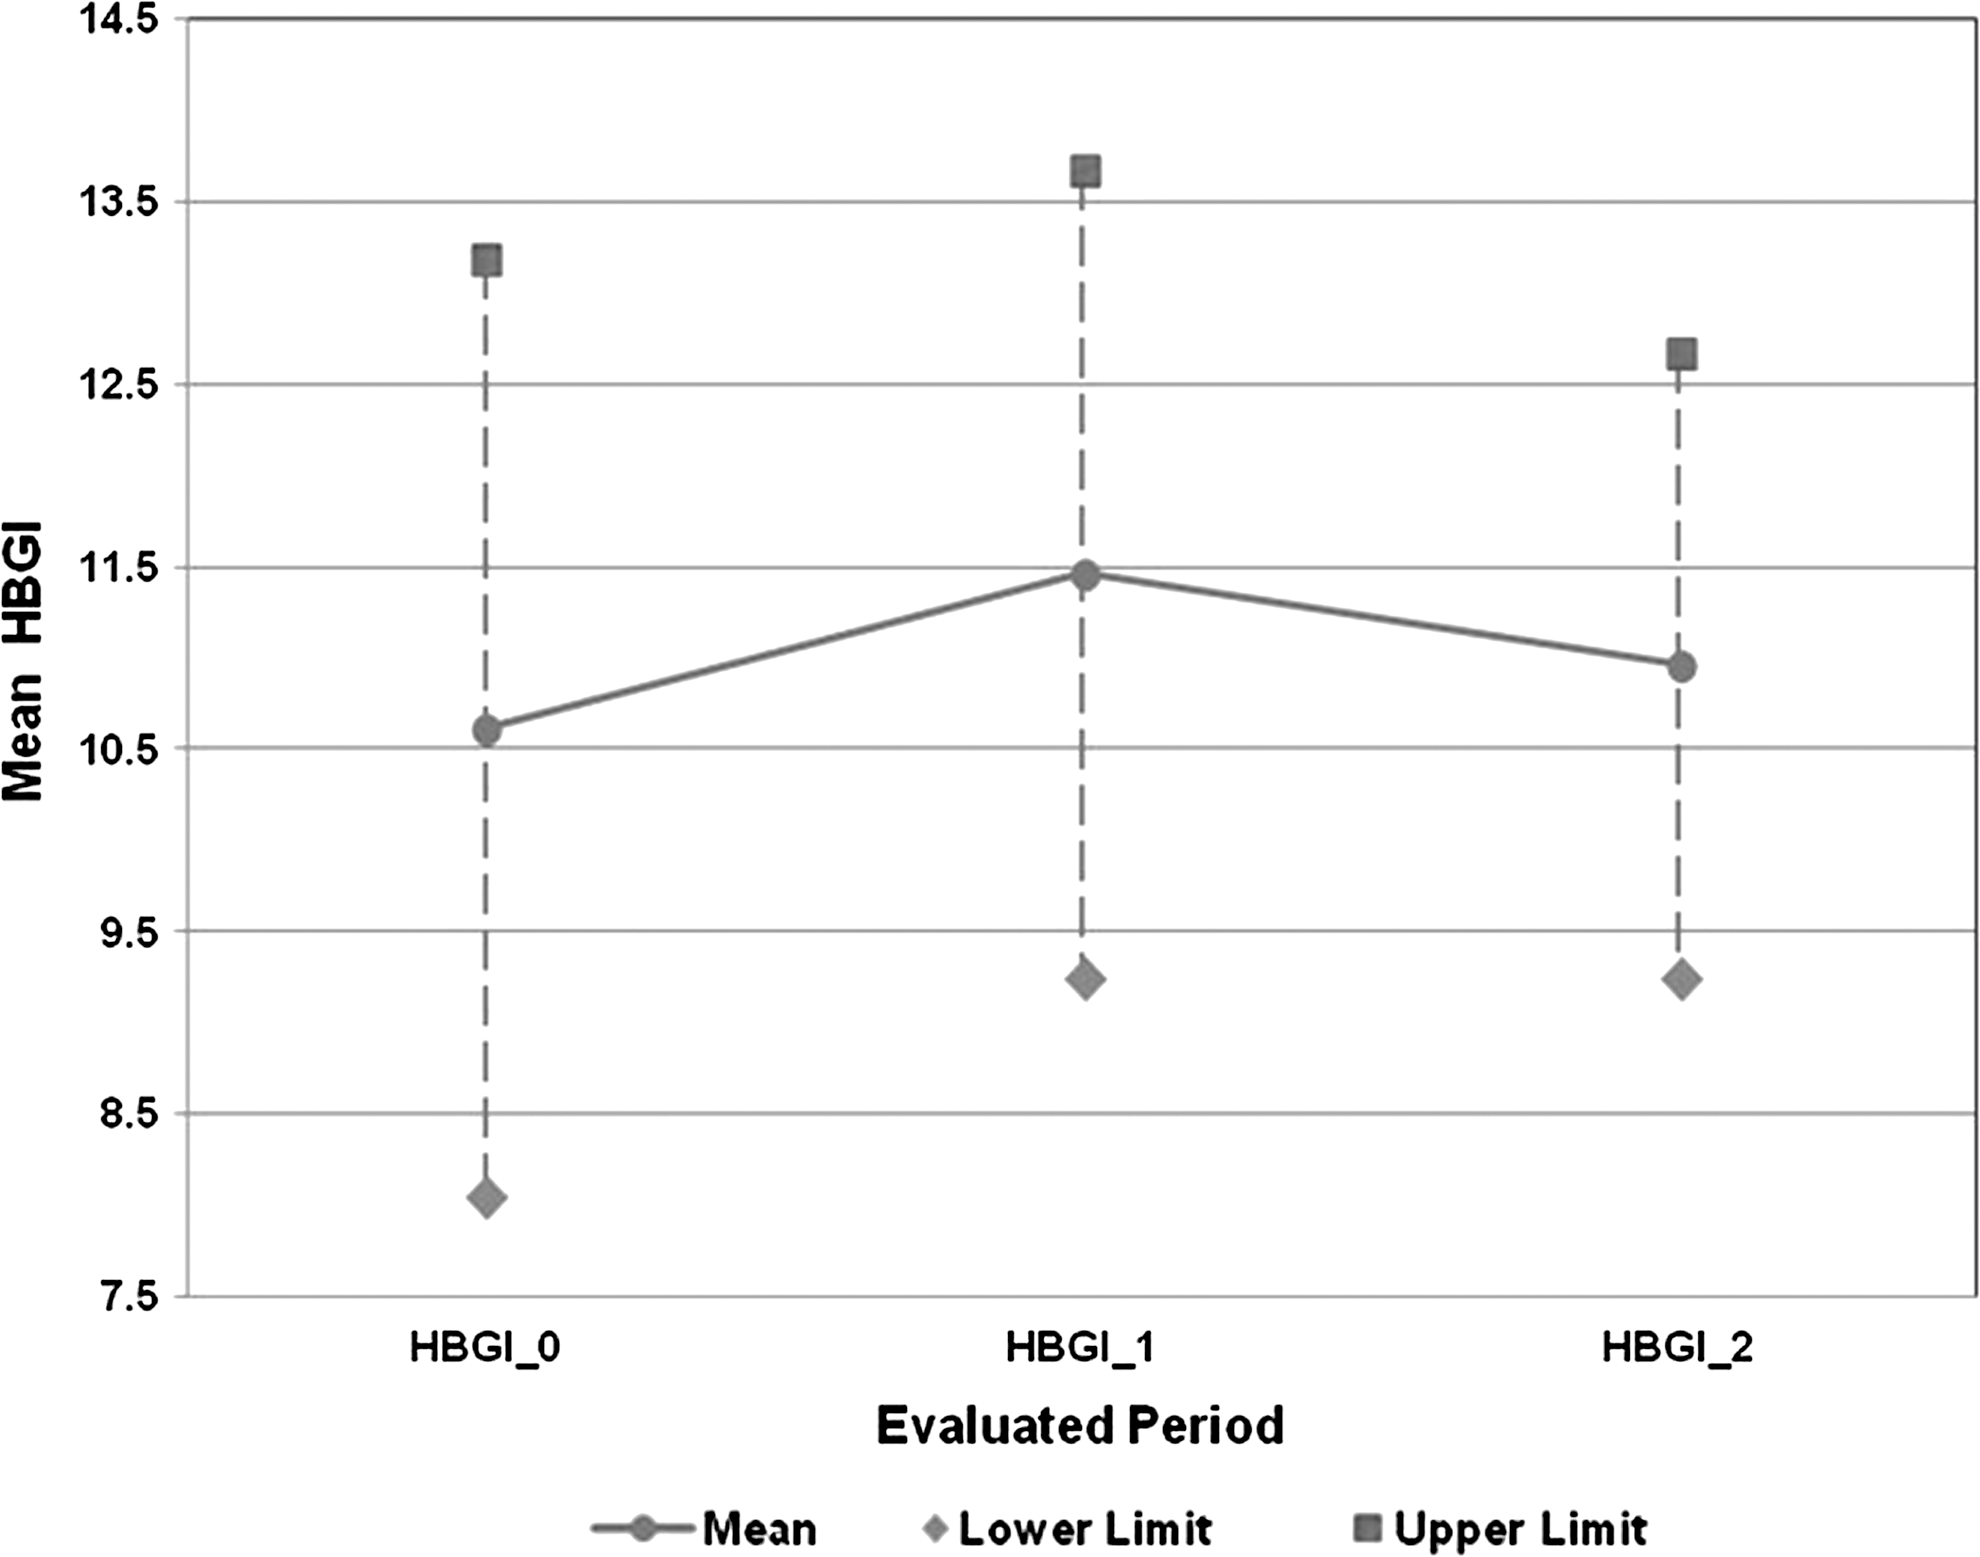
Behavior of the High Blood Glucose Index (HBGI): at baseline (HBGI_0), at the end of the 3-month assessment phase (HBGI_1), and at the end of the 4-month phase without assessment (HBGI_2). The upper and lower limits in each period are included.
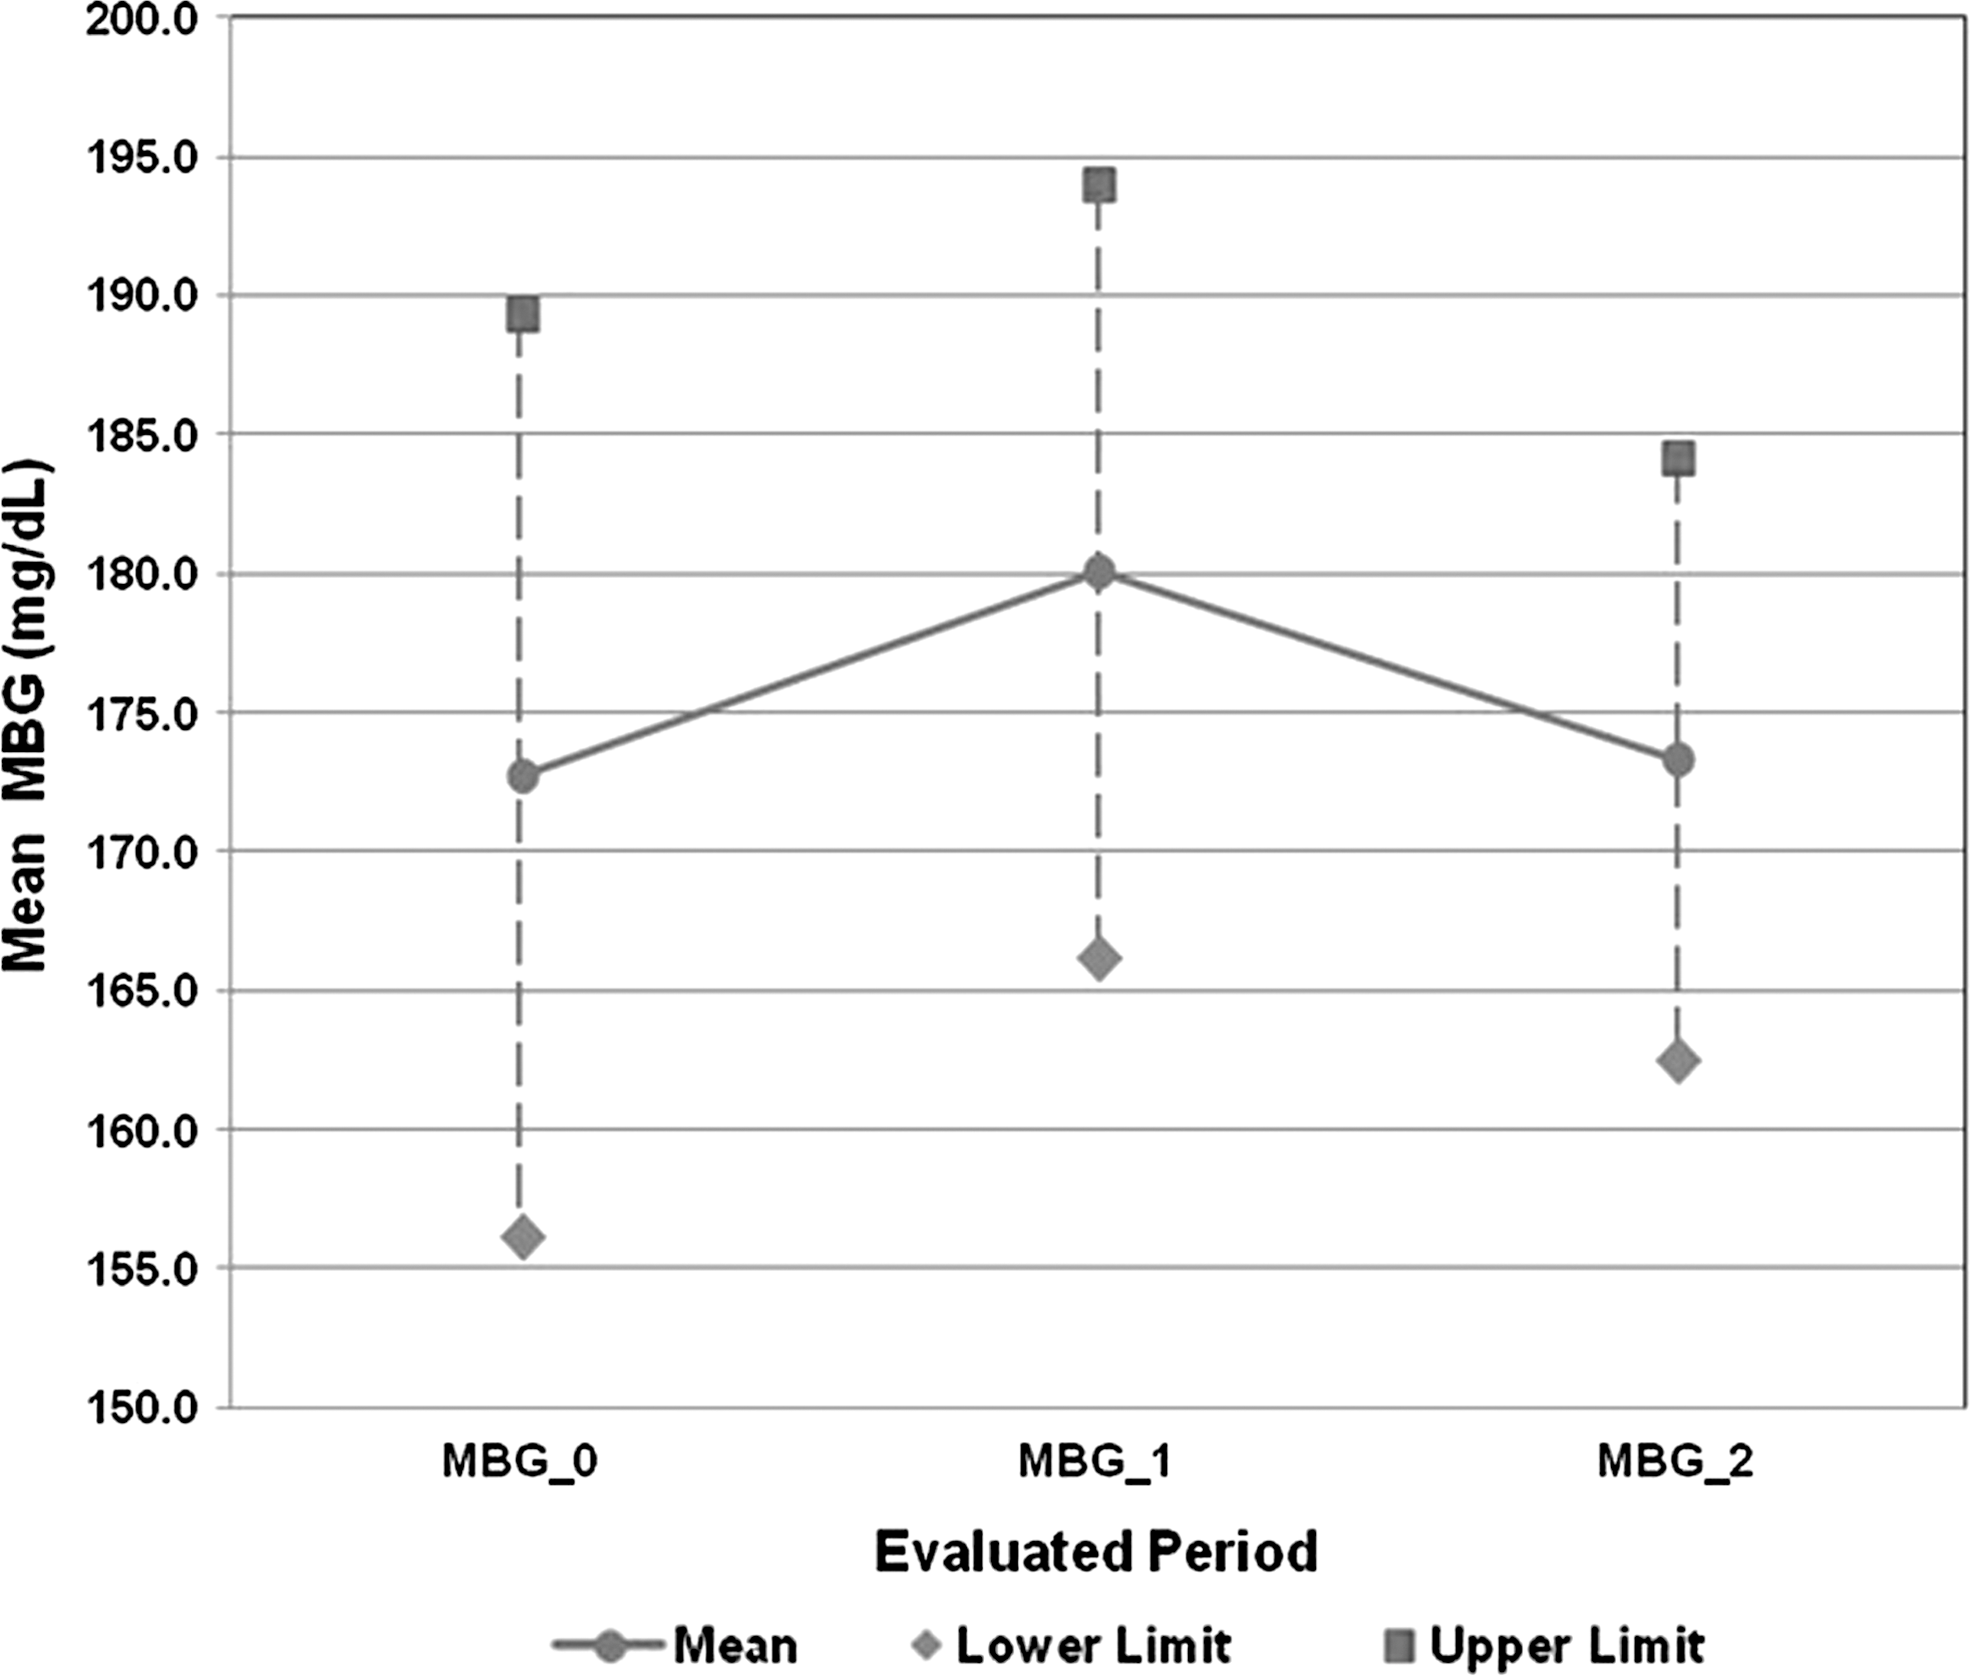
Behavior of the Mean Blood Glucose (MBG): at baseline (MBG_0), at the end of the 3-month assessment phase (MBG_1), and at the end of the 4-month phase without assessment (MBG_2). The upper and lower limits in each period are included.

Behavior of the Average Daily Risk Range (ADRR): at baseline (ADRR_0), at the end of the 3-month assessment phase (ADRR_1), and at the end of the 4-month phase without assessment (ADRR_2). The upper and lower limits in each period are included.
The mean SD value decreased slightly at the end of the assessment phase, with a narrowing of the range between the upper and lower limits, and increased to above baseline levels in the assessment-free phase (Fig. 6).
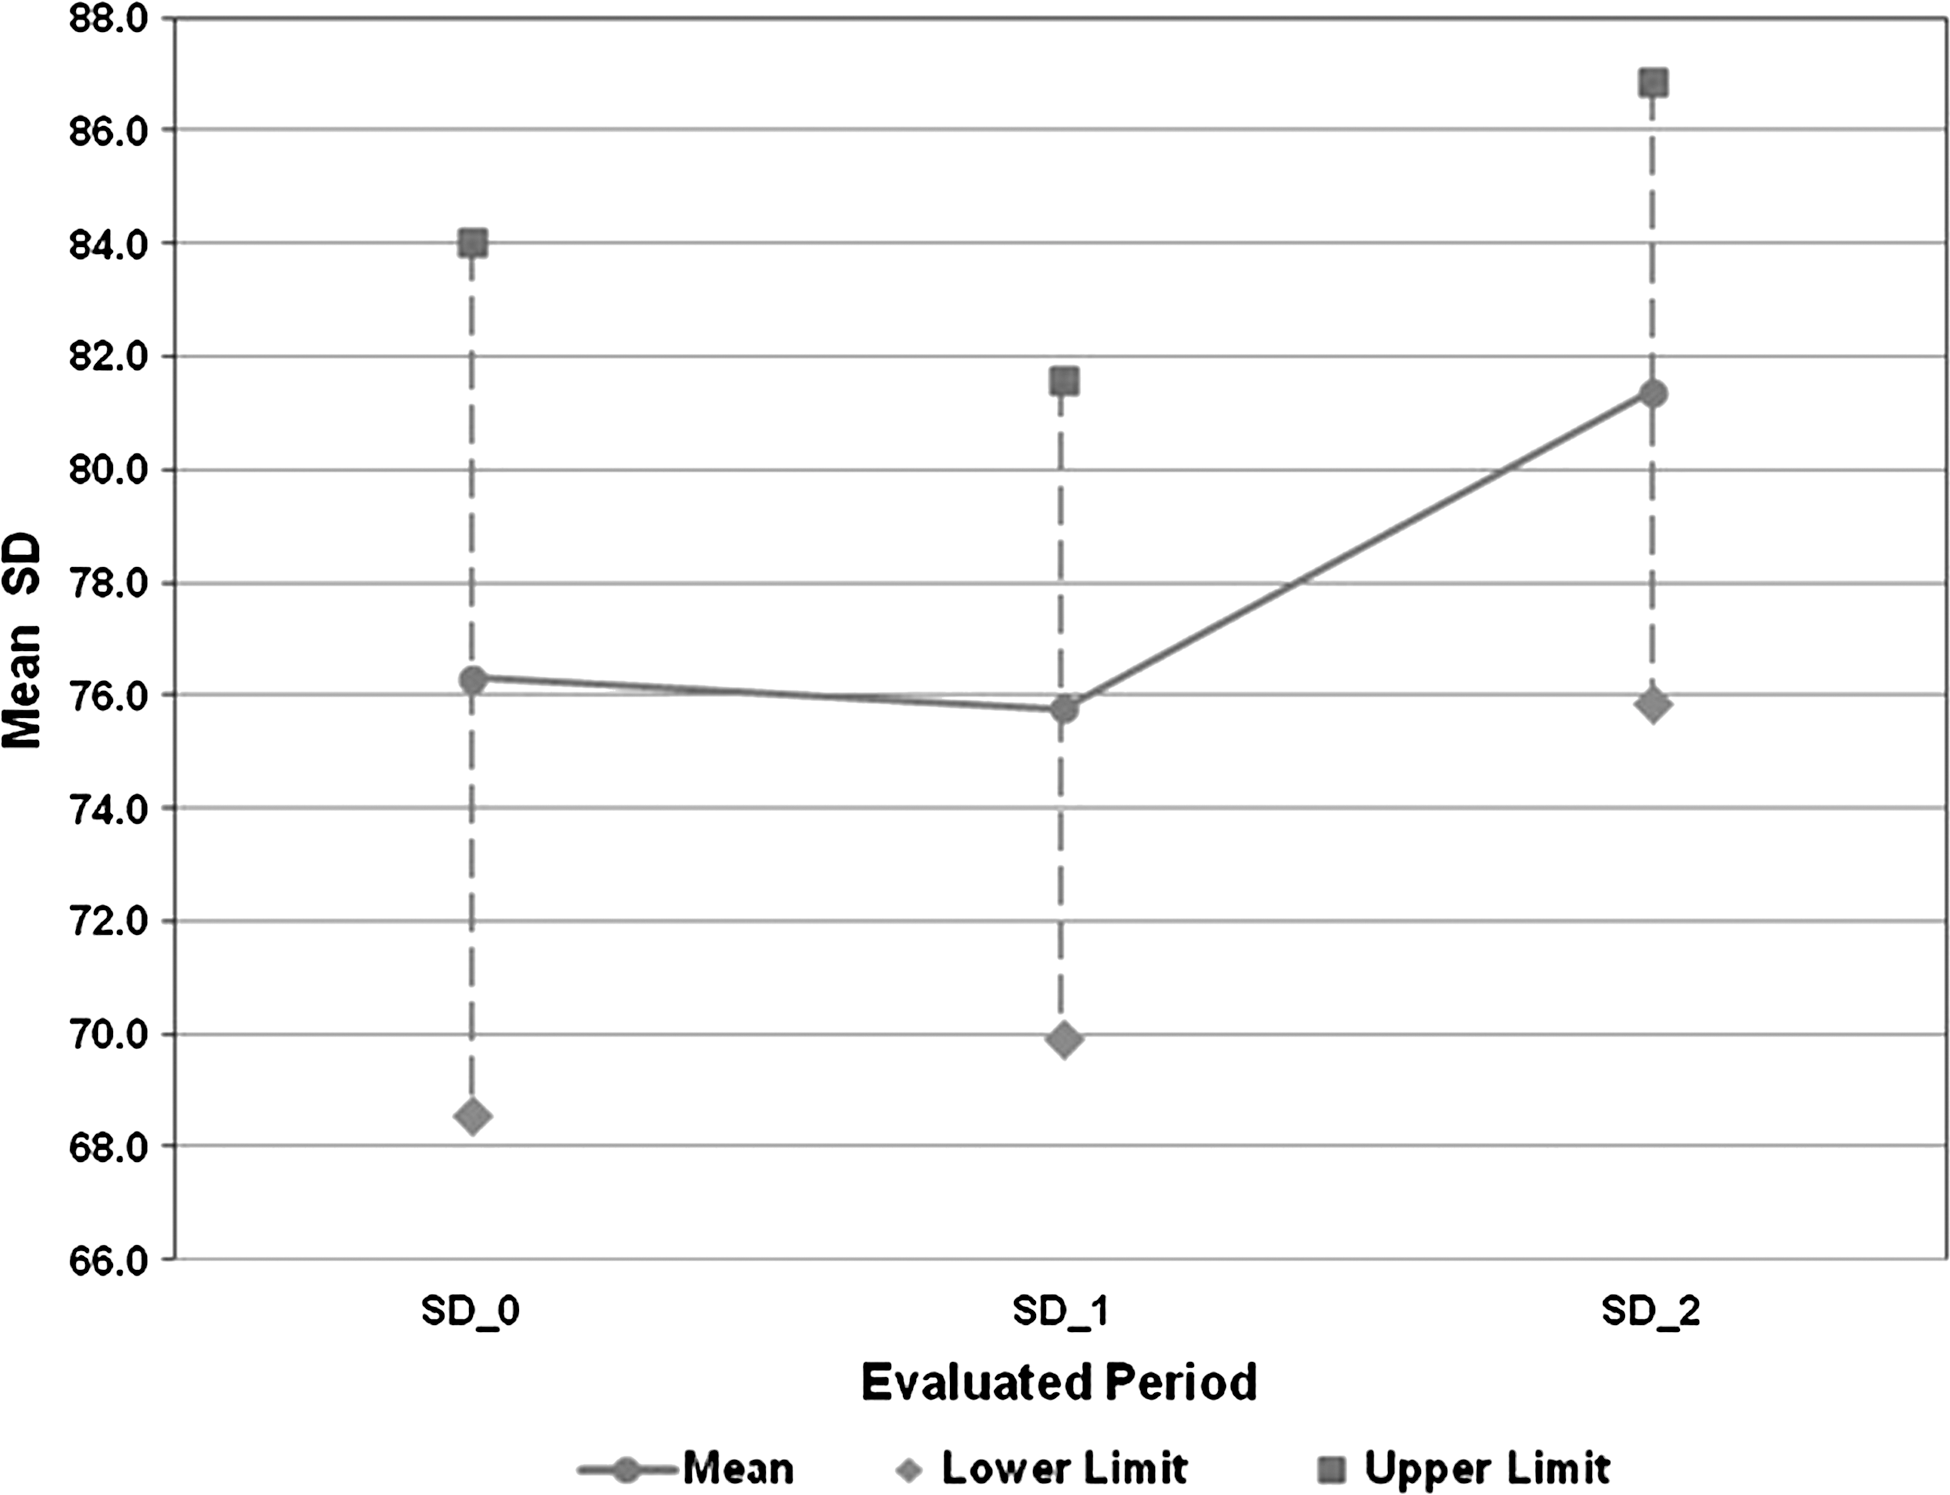
Behavior of the SD: at baseline (SD_0), at the end of the 3-month assessment phase (SD_1), and at the end of the 4-month phase without assessment (SD_2). The upper and lower limits in each period are included.
In the evaluation of the Emminens Conecta platform, 92% of the families observed improved metabolic control, but 46% believed that the assessment phase was too short. Most of the families (84%) believed that the time required to upload the data was acceptable, and 23% reported technical problems. All (100%) of the families would agree to participate in a telemedicine program again.
Discussion
Several studies 2,10,19 support the view that adequate metabolic control is evaluated by an HbA1c value of less than 7.5% accompanied by adequate adjustment of GV; however, the ideal method to quantify GV continues to be debated, despite the large number of published indexes, including the SD subtypes. 1,24 In 2006, Monnier et al 26 demonstrated a direct relationship between free radical production in patients with T2DM and the magnitude of glucose fluctuations calculated by the mean amplitude of glycemic excursion. In the present study, we used SD, an index that has been validated, is easily calculated, and is directly proportional to the mean amplitude of glycemic excursion and other parameters of GV. 1,27
In our pilot study with 3 months of telemedicine assessment, HbA1c significantly decreased, and there were nonsignificant reductions in SD, ADRR, and LBGI, supporting the results of previous studies in children. 8,10 This improvement in HbA1c was probably due to the adjustment of SD, produced by its nonsignificant reduction and by narrowing the gap between the upper and lower values (Table 2 and Fig. 6). The reduction in LBGI and SD, although nonsignificant, implies a reduction in hypoglycemic events and therefore supports the conclusion that the significant decrease in HbA1c level was not due to an increase in hypoglycemic episodes but was rather due to an adjustment of GV. In contrast, there was a nonsignificant increase in the HBGI and MBG, but this finding did not prevent the improvement in HbA1c; the increase in MBG and HBGI (parameters that are correlated with each other) can be explained by the reduction in low values and, consequently, the predominance of medium and high values, raising the mean glycemia value without increasing the number or spread of high values (Table 2). In the specific case of the increase in HBGI (a predictor of hyperglycemic episodes), the reliability of this finding is low because of the decrease in ADRR.
Evaluation of the risks of hyper- and hypoglycemia during the study based on GV indexes showed that the risk of hyperglycemia remained in the moderate range, as indicated by the HBGI and ADRR. The risk of hypoglycemia (LBGI) remained in the low range and decreased further at the end of the assessment phase. Finally, in the three phases, the value of SD, when multiplied by 2, was lower than the corresponding MBG value.
When the results of the assessment phase were compared with those of the assessment-free phase, a significant increase of HbA1c was observed, reaching a similar mean value to the baseline value. Parameters of variability, such as the LBGI, ADRR, and SD, increased to values above baseline levels before assessment, although only the increase in LBGI was significant. Worsening of metabolic control based on HbA1c, on ending the assessment phase, has previously been reported by Rami et al. 8 In that study, the indexes of GV were not analyzed. One possibility to achieve long-term learning and preserving families' autonomy is gradually reducing the frequency of assessment once stable metabolic control has been achieved. This option, however, would increase the assessment time per patient, limiting the number of patients who could be assisted by each assessor, depending on time and financial constraints; tele-assessment saves time and money for the family but increases hospital costs. 28,29
During the phases with and without assessment, there were no reports of severe hypoglycemia episodes; mild and moderate hypoglycemia events were evaluated indirectly using the LBGI analysis. 25 During both phases, insulin requirements showed no significant changes, and body mass index remained within appropriate percentiles for age and sex.
The dates and magnitude of changes in insulin doses made by the parents following the assessor's suggestion were difficult to obtain, like other required data such as visits to the emergency service, because some parents did not mention these factors in the requested reports, thus requiring the assessor to make telephone calls and send a greater number of e-mails.
When classifying hypoglycemic episodes, only the absence of severe hypoglycemia episodes was recorded. Mild and moderate episodes could not be differentiated.
A limitation of this pilot study is its small sample size, hampering statistical analysis. Nevertheless, some results were statistically significant and could have been more conclusive with a larger sample. The sample size was small because the parents of only 18% of the eligible patients gave permission for their inclusion; of these, 86% completed the study. The obstacles to greater participation were time and distance, lack of basic computer knowledge, refusal due to the greater number of daily glucose readings, and incompatibility between the reactive strips covered by the health authorities and glucometer (Roche). This difficulty would be solved if there were universal strips for the distinct glucose meters and if these meters were compatible with all the telemedicine Web platforms.
The sample chosen included prepuberal children between 6 and 10 years old, who were in a phase of stable growth and consequently did not show wide variations in insulin requirements. The parents were responsible for sending the data, which ensured the glycemic measurements used to evaluate metabolic control through the indexes of variability and the telemedicine platform. At the end of the study, suggestions were sent to Roche Diagnostics on the adaptation of the platform for the follow-up of children with diabetes and the future inclusion of risk groups such as adolescents (in whom contradictory results have been found in telemedicine interventions), children under 6 years old, patients with high HbA1c values, elite athletes, patients with concomitant or chronic associated diseases, patients receiving continuous subcutaneous insulin infusion, etc.
Currently, there is no legal support in Spain for the use of the telemedicine system in diabetes patients. 30
We conclude that a 3-month telemedicine assessment in prepuberal children with T1DM improves metabolic control by lowering the HbA1c level and secondarily by reducing GV, without increasing acute complications or insulin requirements. The Web allows analysis of GV indexes and changes in their values, showing modification in the short-term risk of hypo- and hyperglycemia. The platform was well accepted by parents, but when telemedical assessment was stopped, metabolic control worsened, suggesting a probable dependence on the system or inadequate learning during assessments. Consequently, methods to achieve sustained learning are required. Knowledge of the characteristics of the distinct GV indexes integrated in the platforms is an aid to detailed analysis of glycemic behavior. The Web platforms used should differ from those used in adults and be completely adapted to the assessment of the pediatric population with T1DM.
Footnotes
Acknowledgments
The authors are grateful to Roche Diagnostics, Barcelona, Spain, for providing the Accu-Chek Smart Pix software (Emminens Conecta system), the Accu-Chek glucometers, and the Accu-Chek Smart Pix USB device and for providing technical support throughout the study. Roche Diagnostics also provided the reactive strips for blood glucose measurements in two patients. Roche did not participate in the study design, data collection, or analysis. This study received no financial support.
Author Disclosure Statement
No competing financial interests exist.