
Abstract
Aim:
This study examined β-cell function and insulin resistance (homeostasis model assessment-insulin resistance [HOMA-IR]) in Asian Indian youth with type 2 diabetes mellitus (T2DM-Y) and prediabetes.
Subjects and Methods:
Eighty-two subjects with non–insulin-requiring type 2 diabetes and age of onset below 25 years were recruited within 18 months of diagnosis and compared with age- and sex-matched subjects with prediabetes (n=31) and normal glucose tolerance (NGT) (n=83). Body mass index (BMI) and waist circumference were measured, and blood samples were taken in the fasting state and after 30, 60, 90, and 120 min of an oral glucose load for assessment of plasma glucose and insulin levels. Insulin sensitivity/resistance measures was calculated by using the reciprocal of the fasting insulin, the HOMA-IR equation, and the composite whole body insulin sensitivity index (Matsuda Index), and β-cell function was calculated by the oral disposition index (DIo).
Results:
T2DM-Y and prediabetes subjects had higher BMI, waist circumference, and fasting insulin than NGT subjects (P<0.05 for each). The 30-min insulin levels were lower in T2DM-Y and higher in prediabetes subjects compared with NGT (57 and 140 vs. 129 μIU/mL, P<0.001). The T2DM-Y group had greater insulin resistance (HOMA-IR, 1.87 vs. 0.97; P<0.05) and lower β-cell function (DIo, 0.36 vs. 3.28; P<0.001) than NGT. In separate models, the Matsuda Index and DIo were independently associated with prediabetes and T2DM-Y (P<0.05). However, when both were included together, only DIo remained associated with T2DM-Y, whereas both DIo and Matsuda Index were associated with prediabetes (P<0.05). When controlled for adiposity (BMI and waist circumference), an association was observed but in opposite directions, with waist being positively associated with prediabetes (P=0.016) and BMI negatively associated with T2DM-Y (P=0.009).
Conclusions:
Among Asian Indians, β-cell dysfunction appears to be more strongly associated with T2DM-Y than insulin resistance.
Introduction
Although both insulin resistance and insulin secretory defect are important in the pathogenesis of T2DM, the issue of which comes first is still debated. 6 Impairment in β-cell function may be present in subjects at high risk of developing T2DM even though their biochemistry indicates normal glucose tolerance (NGT) or impaired glucose tolerance (IGT). 7 This has been mainly investigated in older adults, and there are relatively few studies of youth-onset T2DM, 8 –10 where the pathophysiology can more easily be elucidated. Studies among persons with youth-onset T2DM may be especially informative, as they may be less affected by the confounding of comorbid factors. Asian Indians have increased susceptibility to T2DM 11,12 and have an earlier age at onset of the disorder. 13,14 Thus, Asian Indians are particularly suited for the investigation of the relative roles of β-cell dysfunction and insulin resistance in youth-onset T2DM. We examined β-cell function (oral disposition index [DIo]) and insulin resistance in Asian Indians youth with T2DM (T2DM-Y) and compared them with age- and sex-matched subjects with prediabetes and NGT.
Subjects and Methods
Newly diagnosed cases (within 18 months of first diagnosis) of T2DM with onset between 10 to 25 years of age were recruited from Dr. Mohan's Diabetes Specialties Centre, a tertiary diabetes center in Chennai, India, or from community screening efforts for diabetes in the young. 15 From the latter, age- and sex-matched subjects with prediabetes and NGT were also recruited.
Anthropometric measurements including height, weight, waist circumference, and body fat were obtained using standardized techniques. Height was measured in centimeters using a stadiometer. Subjects were requested to stand upright without shoes with their back against the wall, heels together, and eyes directed forward. Weight was measured with a traditional spring balance that was kept on a firm horizontal surface. Subjects were asked to wear lightweight clothing, and weight was recorded to the nearest 0.5 kg. Body mass index (BMI) was calculated using the formula BMI=weight (kg)/(height (m)) 2 . Waist circumference was measured by using a nonstretchable measuring tape. The participants were asked to stand erect in a relaxed position with both feet together on a flat surface; one layer of clothing was accepted. Waist girth was measured as the smallest horizontal girth between the costal margins and the iliac crests at minimal respiration. Blood pressure was recorded in the sitting position in the right arm with a mercury sphygmomanometer and rounded off to the nearest 2 mm Hg. Two readings were taken 5 min apart, and the mean of two readings was taken as the blood pressure. Physical examination included looking for presence of acanthosis nigricans and skin tags.
All the subjects recruited for the study underwent an oral glucose tolerance test (OGTT) using 1.75 g/kg for children with a maximum load of 75 g of glucose. Blood samples were drawn in the morning after a minimum of 8–10 h of overnight fasting and at 30, 60, 90, and 120 min after the glucose load.
Fasting plasma glucose (hexokinase method) was measured on a Hitachi 912 autoanalyzer (Hitachi, Mannheim, Germany) using kits supplied by Roche Diagnostics (Mannheim). Serum cholesterol (cholesterol oxidase–peroxidase–amidopyrine method), serum triglycerides (glycerol phosphate oxidase–peroxidase–amidopyrine method), and high-density lipoprotein cholesterol (direct method; polyethylene glycol–pretreated enzymes) were measured using the Hitachi 912 autoanalyzer. Low-density lipoprotein cholesterol was calculated using the formula of Friedewald et al. 16 The glycated hemoglobin level was estimated by high-pressure liquid chromatography using the Variant™ machine (Bio-Rad, Hercules, CA).
Serum insulin concentration was estimated using the electrochemiluminescence method (COBAS E 411; Roche Diagnostics). Fasting and stimulated (post-breakfast) C-peptide levels 17 were estimated by the electrochemiluminescence method on an Elecsys2010 analyzer (Hitachi). Glutamic acid decarboxylase antibodies were measured on a Bio-Rad model 680 plate reader using an enzyme-linked immunosorbent assay kit from Euro Immun (Lubeck, Germany). Apolipoproteins A and B were measured by the immunoturbidometric method (AU 2700 chemistry analyzer; Olympus America, Center Valley, PA).
The intra- and inter-assay coefficients of variation for the biochemical assays ranged between 3.1% and 7.6%. The Dr. Mohan's Diabetes Specialties Centre laboratory is certified by the College of American Pathologists (Northfield, IL) and the National Accreditation Board for Testing and Calibration of Laboratories (New Delhi, India).
Institutional Ethics Committee approval was obtained prior to the start of the study. Written informed consent was obtained according to the local Institutional Ethics Committee guidelines, and assent was also obtained from the study subjects less than 18 years of age.
Definitions
Diabetes
Diagnosis of diabetes was based on World Health Organization Consulting Group criteria (i.e., fasting plasma glucose ≥7.0 mmol/L [126 mg/dL] and/or 2-h plasma glucose ≥11.1 mmol/L [200 mg/dL]) or self-reported diabetes subjects treated by a physician. 18
T2DM-Y
Inclusion criteria were diabetes onset before 25 years of age, recruitment within 18 months of diagnosis, adequate response to oral hypoglycemic agents, fasting C-peptide levels of ≥0.6 pmol/mL, and glutamic acid decarboxylase antibody–negative. 10
Prediabetes
Prediabetes subjects were age- and sex-matched to T2DM-Y subjects and had IGT and/or IFG. IGT was diagnosed if the 2-h plasma glucose level was ≥7.8 mmol/L (140 mg/dL ) and <11.1 mmol/L (200 mg/dL), and IFG was diagnosed if the fasting plasma glucose level was ≥5.6 mmol/L (100 mg/dL) but <7.0 mmol/L (126 mg/dL) based on the definition of the American Diabetes Association. 19
NGT
NGT subjects were also age- and sex-matched to T2DM-Y cases and had a fasting plasma glucose level <5.6 mmol/L (100 mg/dL) and a 2-h plasma glucose level of<7.8 mmol/L (140 mg/dL). 18
Insulin resistance
Insulin resistance was estimated using the homeostasis model assessment-insulin resistance (HOMA-IR) formula: HOMA-IR=(fasting insulin [μIU/mL]×fasting glucose [mg/dL]/18.01)/22.5. 20 Insulin sensitivity was estimated as (1/fasting insulin level). 21 The whole-body insulin sensitivity index was calculated by using the modified Matsuda Index: (10,000/square root of [fasting glucose×fasting insulin]×[mean glucose×mean insulin]), with mean glucose and mean insulin each calculated from values at 0, 30, and 120 min of the OGTT. 22,23 The insulinogenic index or the early insulin response was calculated as the ratio of the change in insulin to the change in glucose from 0 to 30 min (ΔI 0–30/ΔG 0–30). 24,25 β-Cell function was measured by the DIo: DIo=(ΔI 0–30/ΔG 0–30)×(1/fasting insulin). 26,27
Statistical analysis
For the conversion of insulin and glucose values from μIU/mL and mg/dL to Système International units, factors of 6.945 and 0.0555, respectively, were used. Converted insulin and glucose values were used only for calculating DIo, HOMA-IR, and Matsuda Index. Analysis of variance was used to compare groups for continuous variables, and the χ2 test was used for categorical variables.
All the independent variables were tested for collinearity; the tolerance was >0.1, and variance inflation factor did not exceed >5.0, denoting that there was no collinearity among them. 28 Multinomial regression analysis was done using T2DM-Y, prediabetes, and NGT as the dependent variables and standardized DIo and Matsuda Index as independent variables after adjusting for variables such as BMI, waist circumference, and age.
A hyperbolic relationship was presumed if the 95% confidence interval of the slope included −1 according to Utzschneider et al. 27 Measures of insulinogenic index and insulin sensitivity values were log-transformed to account for non-normality in the data, and linear regression analysis was done using the log-transformed insulin measures (insulinogenic index [ln (ΔI 0–30/ΔG 0–30)] as the dependent variable and insulin sensitivity [ln (1/fasting insulin)] as the independent variable). All analyses were done using the Windows-based SPSS Statistical Package (version 15.0; SPSS, Chicago, IL), and P values of <0.05 were considered statistically significant.
Results
The characteristics of the 196 study subjects are shown in Table 1. Age at diagnosis and duration of T2DM-Y were 20.7±3.8 years and 0.9±0.5 months, respectively. Compared with the NGT subjects, T2DM-Y and prediabetes subjects had higher BMI (P<0.05), waist circumference (P<0.001), and serum triglycerides (P<0.05). Parental history of diabetes (84.1%) and presence of acanthosis nigricans (47.6%) were higher among T2DM-Y than prediabetes (48.4% and 25.8%) and NGT (59% and 16.9%) subjects, respectively. Only subjects with diabetes were receiving treatment. Among the 82 type 2 diabetes subjects, 22 (26.8%) were newly diagnosed. Among the treated subjects, 20 (33.3%) were on biguanides, eight (13.3%) were on sulfonylurea, 23 (38.3%) were on both biguanides and sulfonylurea, five (8.3%) were on insulin and oral hypoglycemic agent combination, and four (6.7%) were on glitazone in combination with other oral hypoglycemic agents (e.g., metformin and/or sulfonylurea).
Data are mean±SD values unless indicated otherwise.
Data are mean±SEM values.
The χ2 test P value is given (P<0.001).
Data given as median (interquartile range) values, where the interquartile range is (75th–25th percentile).
One-way analysis of variance was done for comparisons: * P<0.01, ** P<0.001, *** P<0.05 compared with normal glucose tolerance (NGT) subjects.
BMI, body mass index; DIo, oral disposition index; HDL, high-density lipoprotein; HOMA-IR, homeostasis model assessment-insulin resistance; LDL, low-density lipoprotein.
β-Cell function as assessed by DIo decreased progressively from NGT to prediabetes (3.28 to 1.26; P<0.001) to T2DM-Y (3.28 to 0.36; P<0.001), whereas insulin resistance (HOMA-IR) increased from NGT to prediabetes to T2DM-Y (P<0.001) (Table 1).
Figure 1 shows the plasma glucose levels (Fig. 1A) and insulin levels (Fig. 1B) of the three study groups. The insulin levels of the prediabetes subjects were higher than those of the NGT subjects at fasting (P<0.001), 60 min (P<0.05), 90 min (P<0.001), and 120 min (P<0.001), whereas T2DM-Y had significantly lower insulin at 30 min (P<0.001) and 60 min (P<0.05) compared with the NGT subjects.
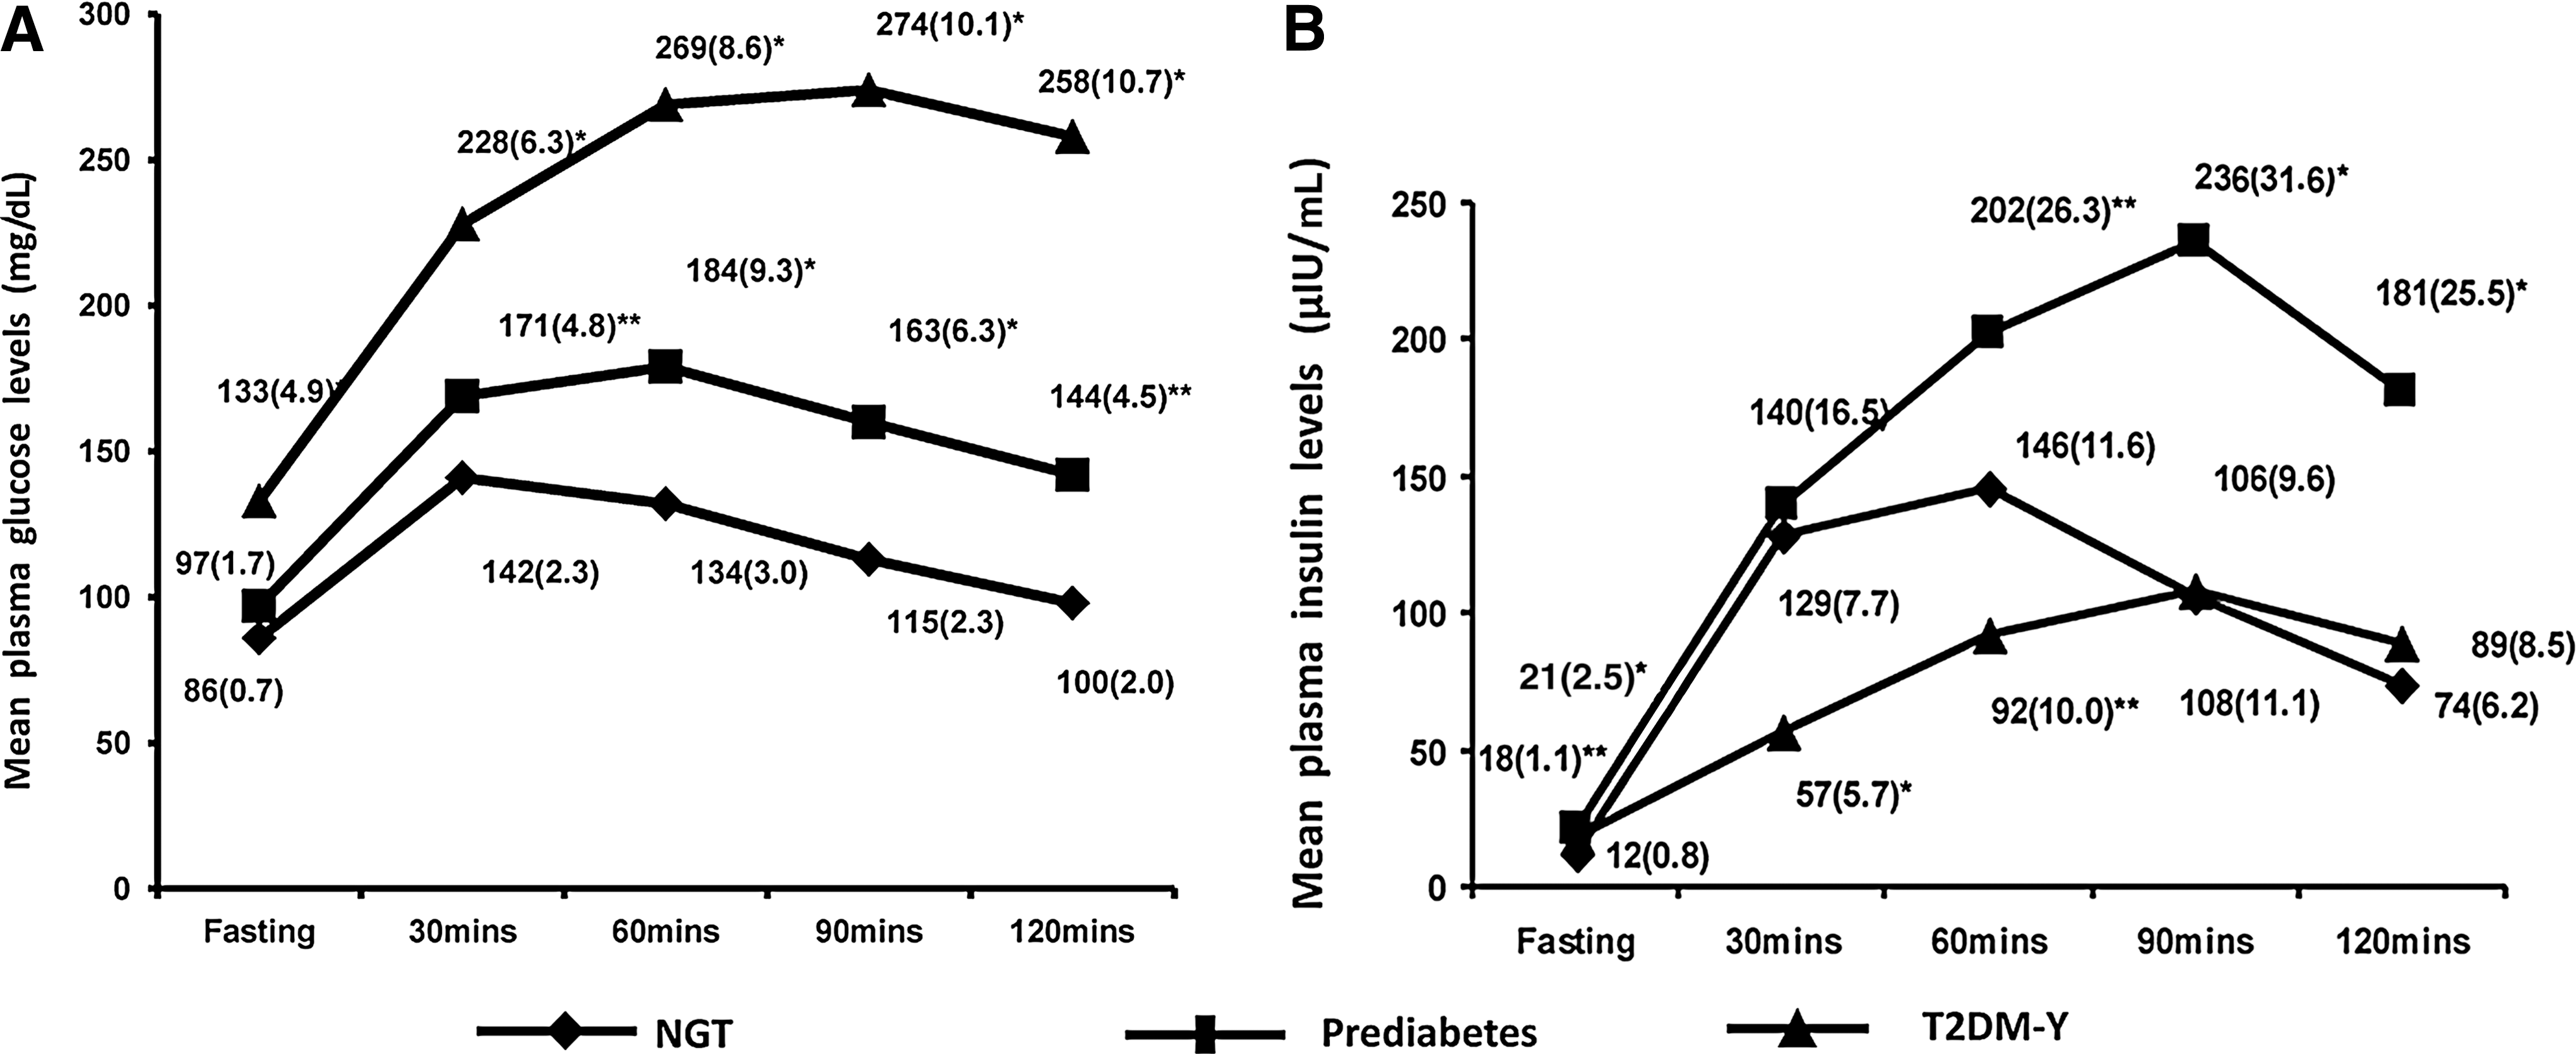
Figure 2 presents the plotted hyperbolic curves with the trend lines drawn separately for NGT, prediabetes, and T2DM-Y. Figure 2 shows that the curves are progressively shifted downward and to the left from NGT to prediabetes to T2DM-Y.
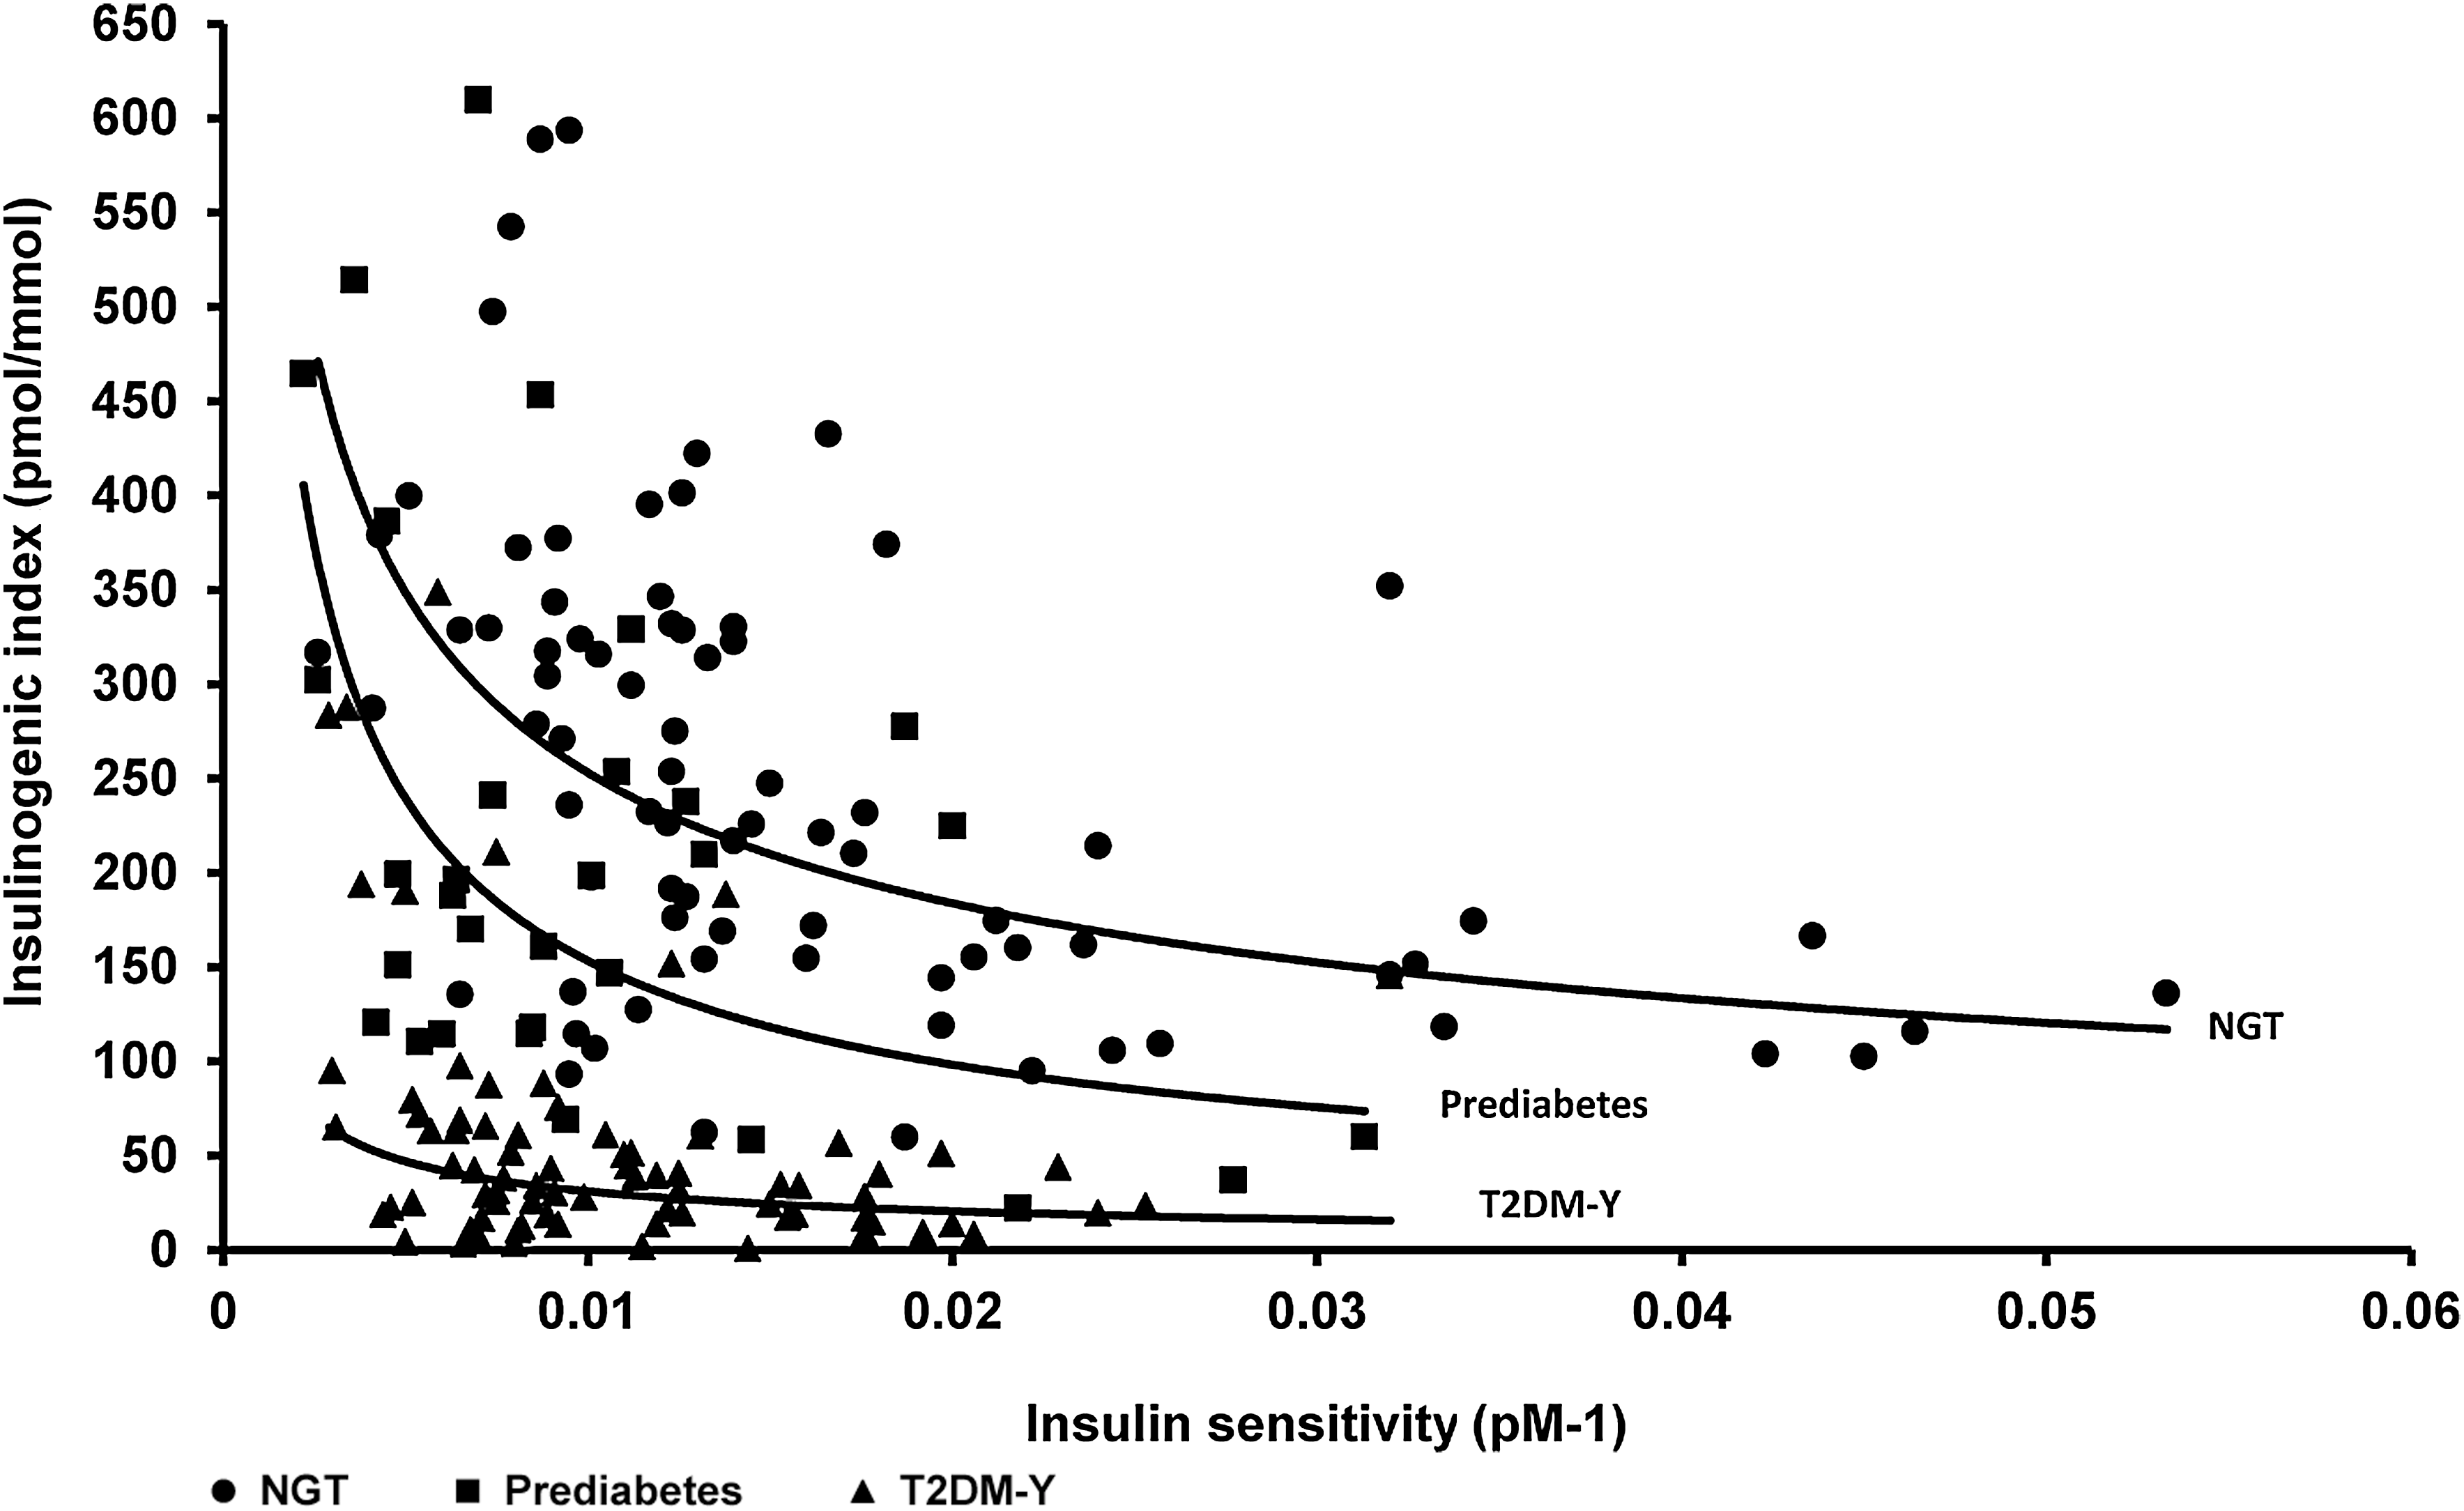
The relationship between insulin sensitivity and insulinogenic index among the three groups. NGT, normal glucose tolerance; T2DM-Y, youth with type 2 diabetes mellitus.
Linear regression analysis was done using the insulinogenic index [ln (ΔI 0–30/ΔG 0–30)] as the dependent variable and insulin sensitivity [ln (1/fasting insulin)] as the independent variable separately for the three study groups. The slope for NGT was −0.55 (95% confidence interval, −0.76 to −0.33; P<0.001), for prediabetes it was −0.64 (−1.02 to −0.26; P<0.05), and for T2DM-Y, it was −0.59 (−1.07 to −0.12; P<0.05).
Table 2 shows that both the Matsuda Index and DIo were independently associated with prediabetes and T2DM-Y (Models 1 and 2). However, when both were included together in Model 3, only DIo remained associated with T2DM-Y, whereas both DIo and the Matsuda Index were associated with prediabetes. In Models 4–7, when BMI, waist circumference, and age, respectively, were introduced into the model, DIo was associated with both T2DM-Y and prediabetes (P<0.05) in all the models. The association of the Matsuda Index with prediabetes and T2DM-Y was lost when BMI and waist circumference were introduced into the model (Models 4 and 5). When age was adjusted in Model 6, the Matsuda Index was associated only with prediabetes (P<0.05) but not with T2DM-Y. When controlled for adiposity (BMI and waist circumference) and age (Model 7), an association was observed but in opposite directions, with waist being positively associated with prediabetes (P=0.016) and BMI negatively associated with T2DM-Y (P=0.009).
Models were run with standardized values for oral disposition index (DIo), Matsuda Index, age, body mass index [BMI], and waist circumference. Data shown as parameter estimate B (SE) and exponential of B (95% confidence interval [CI]).
P<0.05 considered significant.
Discussion
It is well known that Asian Indians have increased susceptibility to T2DM, but few studies have looked at the relative contributions of insulin secretory defects versus insulin resistance in Asian Indians and virtually none in Asian Indian youth with prediabetes and T2DM. Among the prediabetes group, eight had fasting glucose values alone elevated (isolated IFG), 16 of them had post-glucose values elevated (isolated IGT), and seven had both fasting and post-glucose values elevated (IFG+IGT). Additional analyses with subdivision of the prediabetes group (IFT, IGT, IFG, and/or IGT) were not done becaue of small numbers of subjects in each group.
The following are the main findings of our study. Although DIo and the Matsuda Index are both associated with T2DM-Y and prediabetes independently, only DIo remains significant after adjusting for BMI, waist circumference, and age, showing that it is more strongly linked with T2DM-Y and prediabetes than the Matsuda Index in this ethnic group. This is further confirmed by the fact that subjects with prediabetes had a more drastic decline in DIo compared with NGT subjects (Table 1), suggesting an early and significant change in β-cell dysfunction, disrupting glucose metabolism. Similar findings were also reported by other groups. 29 –32 This points to a predominant role played by β-cell dysfunction in the pathogenesis of prediabetes and T2DM-Y in our population, who are relatively lean compared with Europeans. 33
When controlled for adiposity (BMI and waist circumference), an association was observed but in opposite directions, with waist being positively associated with prediabetes (P=0.016) and BMI negatively associated with T2DM-Y (P=0.009).The plausible explanation for such an effect seen could be due to multiple comparisons and smaller sample size. Clinically, the negative association of BMI might be due to the weight loss among the newly diagnosed subjects once the disease set in. Earlier studies in adults 34 –36 and in children and adolescents 37 have identified waist circumference as a predictor of T2DM, cardiovascular disease, and insulin resistance syndrome.
Some studies 38,39 have suggested that there could be an accelerated β-cell dysfunction in younger age groups, thus shortening the transition time between prediabetes and T2DM-Y. This calls for early intervention among the youth even before the prediabetes stage in order to prevent further deterioration of β-cell function. 40 This may be particularly relevant in relatively leaner populations like South Asians. Harrison et al. 41 reported that β-cell function can be preserved for at least 3.5 years with early intensive therapy for newly diagnosed T2DM followed by either an insulin-based regimen or multiple oral hypoglycemic agents. However, the TODAY study 42 did not show that early treatment helped to maintain β-cell function or durable glycemic control. The primary outcome was need for insulin, which is considered to be a sign of treatment failure/loss of β-cell function. This occurred in almost 50% of participants in the study. Thus the TODAY study shows that β-cell function is difficult to maintain in the young population studied.
According to Kahn et al. 43 the nonlinear relationship between sensitivity and secretion is best described by a hyperbola, a word used in this context for the first time by Bergman et al. 44 in their landmark article in 1981. The hyperbolic relationship means that the product of insulin sensitivity and insulin secretion is constant for a given degree of glucose tolerance, and the final outcome of the above is called the disposition index. We noted that compared with NGT subjects, in the subjects with prediabetes and even more so among T2DM-Y, the curve is shifted downward and to the left, showing progressively decreasing insulin secretion relative to prevailing levels of insulin resistance in NGT, prediabetes, and T2DM-Y. This hyperbolic association has also been demonstrated in prediabetes and diabetes through intravenous glucose tolerance test and OGTT measures by Utzschneider et al. 27,45
DIo values derived by OGTT measurements were ninefold lower in our T2DM-Y compared with NGT subjects. Elder et al. 46 also noted an eightfold lower DIo in their T2DM subjects. Individuals with lower DIo have been shown to have an increased risk of developing T2DM. 47
In the Matsuda Index, the fasting component reflects hepatic insulin sensitivity, whereas the mean of the dynamic data primarily represents skeletal muscle insulin sensitivity, 24 and hence we used this method in models along with DIo. Recently de Mello et al. 48 have indicated that improved insulin sensitivity along with weight loss may also have beneficial effects on preservation of β-cell function.
Our study supports the conclusions of Sjaarda et al. 49 that a simple surrogate OGTT protocol could provide estimates of insulin sensitivity and β-cell function, which could be detected in high-risk youth at an early stage. It can also be used in large-scale epidemiological studies where the use of clamp studies is not feasible.
Once defective β-cell function is identified, in addition to life style modification, perhaps the early use of drugs that potentially preserve β-cell function (e.g., dipeptidyl peptidase-4 inhibitors or glucagon-like peptide-1 analogs) may help to prevent progressive β-cell loss in these individuals. Obviously such studies need to be done in our population.
The main strength of the study is the inclusion of fairly large number of T2DM-Y along with age- and sex-matched prediabetes and NGT subjects. β-Cell function has not been studied so far among T2DM-Y in Asian Indians, and hence this study assumes significance.
The limitations of the study are that we could not compare the insulin and glucose measures with “gold standard” measures like a euglycemic clamp or frequently sampled intravenous glucose tolerance test. However, the Matsuda Index, HOMA-IR, and the DIo have been validated in other populations against the “gold standards” and found to be valid and appropriate for clinical investigations and epidemiological studies. 50 –52 Second, the assumption of hyperbolic relationship (i.e., that the 95% confidence interval of the slope should include −1) could not be achieved in the NGT group. The appropriateness of this in our population therefore needs further studies. Third, the NGT subjects were only age- and sex-matched and not BMI-matched to the prediabetes/diabetes subjects. Although Tanner staging was not available for the adolescents, 95% of subjects were over 20 years of age. Therefore, insulin resistance of puberty should not have had a significant impact on the results. Finally, any inferences drawn with regard to prediabetes need to be done with caution because of the smaller number of subjects with prediabetes compared with T2DM-Y. However, to our knowledge, this is the first report comparing prediabetes, T2DM, and NGT among Asian Indian youth 10–25 years old.
To summarize, among Asian Indian T2DM-Y and prediabetes subjects, both β-cell dysfunction (lower disposition index) and higher HOMA-IR are associated with deterioration of glycemia. However, β-cell dysfunction appears to occur early in the natural history of T2DM, and this may be a key factor in pathogenesis of the disorder in Asian Indians. Longitudinal studies are, however, needed to prove this.
Footnotes
Acknowledgments
We thank the participants and the staff of Dr. Mohan's Diabetes Specialities Centre and the Madras Diabetes Research Foundation, Chennai, India, for their help with this study. We thank the Department of Science and Technology and the Emory Global Health Institute for their support. This is the seventh publication from the MDRF–Emory Global Diabetes Research Centre (GDRC-7) funded by the Emory Global Health Institute. L.S. was partly funded by the Emory Molecules to Mankind M2M program, funded by Burroughs Wellcome.
Author Disclosure Statement
No competing financial interests exist. V.M. and K.M.V. conceived the study. V.M. revised all drafts of the article. A.A. and R.H. coordinated the study and checked the integrity and accuracy of the results. A.A. wrote the first draft of the article and carried out the corrections in consecutive drafts. M.D. and L.S. provided the input for statistical analysis of the data. K.M.V., R.U., R.M.A., and M.K.A. gave valuable comments and suggestions to the writing of the article.