
Abstract
Objectives:
This study evaluated if triple oral therapy can be useful in improving glycemic control compared with metformin monotherapy and with a metformin and pioglitazone combination. Furthermore, we also compared a triple metformin+pioglitazone+glibenclamide combination with a metformin+pioglitazone+sitagliptin one.
Subjects and Methods:
After a 2-year run-in therapy-augmenting phase with metformin and pioglitazone, 453 overweight, type 2 diabetes patients were randomized to 1 year of sitagliptin versus 1 year of glibenclamide to evaluate, as the primary outcome, the variation of β-cell function both in a fasting state and after an euglycemic hyperinsulinemic and hyperglycemic clamp. As secondary outcomes we evaluated glycemic control and insulin resistance.
Results:
Both the triple therapy combinations were more effective in reducing glycated hemoglobin compared with metformin monotherapy and with dual therapy metformin+pioglitazone. Fasting plasma insulin level and the homeostasis model assessment insulin resistance index were significantly increased by triple therapy with glibenclamide and decreased by the one with sitagliptin. Although sitagliptin did not change the homeostasis model assessment β-function index, this value was significantly increased by glibenclamide. The fasting plasma proinsulin level was decreased by sitagliptin. Triple therapy with sitagliptin greatly improved β-cell function measures compared with the glibenclamide one and also compared with metformin monotherapy and with the metformin+pioglitazone combination.
Conclusions:
Dual combination therapy is more effective than monotherapy in improving glycemic control. When double therapy is not enough to reach an adequate glycemic control, sitagliptin should be preferred to glibenclamide as the third agent because of its positive effect on β-cells.
Introduction
The first dipeptidyl peptidase-4 inhibitor released for the use in the clinical practice was sitagliptin, followed by vildagliptin, saxagliptin, and linagliptin. Previous studies reported in the literature already showed the safety and efficacy of sitagliptin both in monotherapy or combined with different antidiabetes drugs. 8 Moreover, our group has already conducted several studies on sitagliptin, added to either pioglitazone 10 or metformin, 11,12 evaluating its effects on glycemic control and β-cell function. Sitagliptin proved to be effective in reducing glycated hemoglobin (HbA1c) levels and to have a positive effect on β-cell function, with a neutral effect on body weight. 8,9 We have also reported that the positive effects of sitagliptin were maintained after 2 years of therapy in addition to various antidiabetes agents. 13
Another option can be sulfonylureas, which act by binding a specific site on the ATP-sensitive potassium channels, subsequently opening calcium channels and thus triggering insulin exocytosis from the pancreatic β-cell. 14 Also, sulfonylureas proved to be effective in reducing glycemic control. 15
The primary end point of this study was to evaluate the variation of β-cell function both in a fasting state and after an euglycemic hyperinsulinemic and hyperglycemic clamp when sitagliptin or glibenclamide was introduced after a 2-year run-in therapy-augmenting phase with metformin and pioglitazone. As secondary outcomes we evaluated glycemic control and insulin resistance changes.
Subjects and Methods
Study design
This multicenter, randomized, double-blind, controlled study was conducted at the following sites: Department of Internal Medicine and Therapeutics, University of Pavia, Pavia, Italy (the coordinating center); Aging and Kidney Diseases, “G. Descovich” Atherosclerosis Study Center, University of Bologna, Bologna, Italy; Metabolic Unit, Regional Hospital, Varese, Italy; Ospedale Pesenti Fenaroli, Alzano Lombardo, Bergamo, Italy; Hospital Center of Diabetes, Sant'Angelo Lodigiano, Lodi, Italy; and Fondazione Ospedale della Carità, Casalbuttano, Cremona, Italy.
The study was conducted according to the Declaration of Helsinki and its amendments and the Good Clinical Practice Guidelines, and the study protocol was approved by the local ethical committees.
Patients
We enrolled 476 white type 2 diabetes patients >18 years old of either sex (Table 1) according to the European Society of Cardiology and European Association for the Study of Diabetes Guidelines criteria, 16 naive to antidiabetes treatment and with poor glycemic control, expressed as HbA1c level >8.0% and <10%, and overweight (body mass index [BMI] ≥25 kg/m2 and <30 kg/m2).
Data are mean±SD values.
P<0.05 versus baseline.
AIRarg, C-peptide response to arginine at 270 mg/dL glucose concentration; BMI, body mass index; DI, disposition index (AIRarg×M-value); F, female; first phase, first-phase C-peptide response to glucose; FPG, fasting plasma glucose; FPI, fasting plasma insulin; FPPr, fasting plasma proinsulin; HbA1c, glycated hemoglobin; HOMA-β, homeostasis model assessment β-cell function index; HOMA-IR index, homeostasis model assessment insulin resistance index; M, male; PPG, postprandial plasma glucose; Pr/FPI ratio, proinsulin/FPI ratio; second phase, second-phase C-peptide response to glucose.
Patients were excluded if they had a history of ketoacidosis or had rapidly progressive diabetic retinopathy (defined by the presence of cotton wool spots on the retina at the ophthalmic examination), nephropathy (defined by the onset of albumin excretion of >300 mg/24 h or an albumin excretion rate of >200 μg/min over a 6-month period), neuropathy (diagnosed both clinically and with electrophysiologic testing), impaired hepatic function (defined as plasma aminotransferase and/or γ-glutamyltransferase level three times higher than the upper limit of normal for age and sex), impaired renal function (defined as serum creatinine level higher than the upper limit of normal for age and sex), or severe anemia (defined as hemoglobin level <8 g/dL). Patients with serious cardiovascular disease or New York Heart Association class I–IV congestive heart failure or a history of myocardial infarction, stroke, or cerebrovascular conditions (ischemic stroke, hemorrhagic stroke, or transient ischemic attack) within 6 months before study enrolment also were excluded. Also, patients with a history of previous pancreatitis were excluded. Women who were pregnant or breastfeeding or of childbearing potential and not taking adequate contraceptive precautions were also excluded.
Suitable subjects, identified from review of case notes and/or computerized clinic registers, were contacted personally or by telephone. All patients provided written informed consent.
Treatments
This study had a 2-year run-in therapy-augmenting phase with metformin and pioglitazone. Then, at the beginning of the third year, patients were randomized to take, in a double-blind design, glibenclamide 5 mg three times a day or sitagliptin 100 mg once a day in addition to metformin 2,200 mg/day+pioglitazone 30 mg/day for 12 months (Fig. 1). In every phase of the trial, if patients reached an HbA1c level of ≥10%, they were excluded from the study. Sitagliptin and glibenclamide were supplied as identical, opaque, white capsules in coded bottles, and treatments were combined in order to give patients the same number of tablets per day to ensure the blind status of the study. Randomization was done using a drawing of envelopes containing randomization codes prepared by a statistician. Medication compliance was assessed by counting the number of pills returned at the time of specified clinic visits. Throughout the study, we instructed patients to take their first dose of new medication on the day after they were given the study medication. At the same time, all unused medication was retrieved for inventory. All medications were provided free of charge.
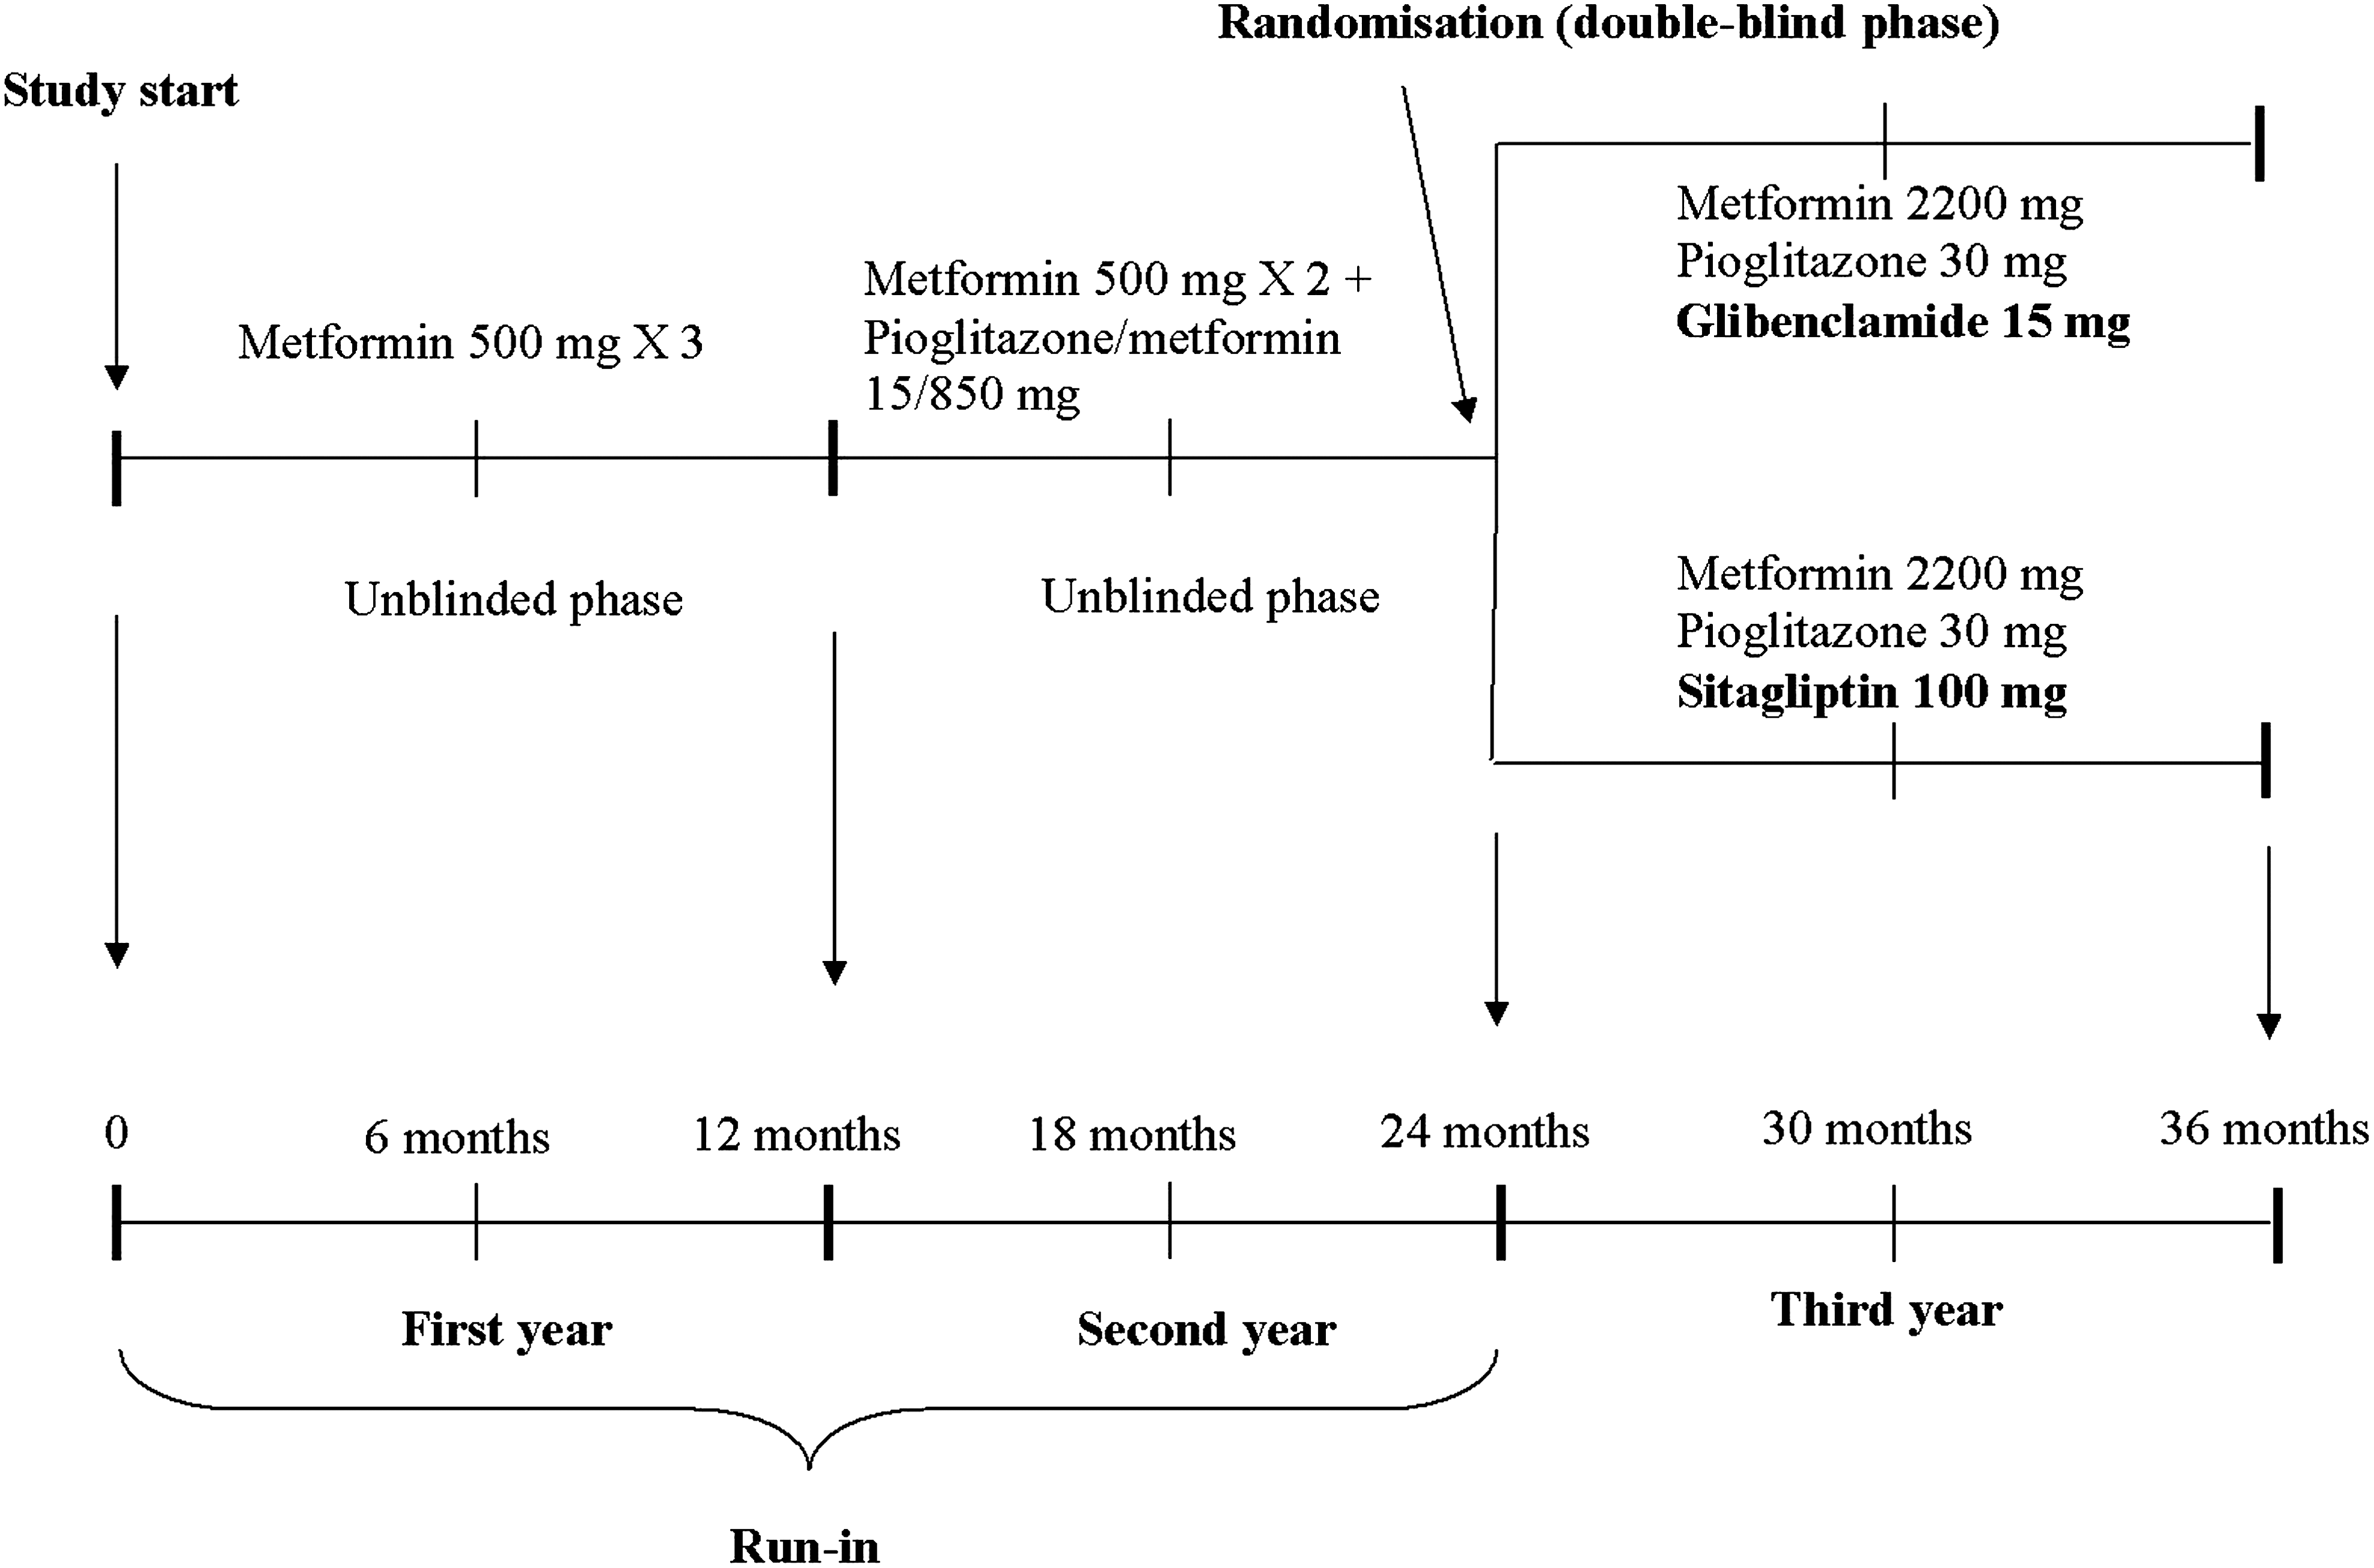
Study design.
Diet and exercise
Subjects began a controlled-energy diet (near 600 Kcal daily deficit) based on American Heart Association recommendations 17 that included 50% of calories from carbohydrates, 30% from fat (6% saturated), and 20% from proteins, with a maximum cholesterol content of 300 mg/day and 35 g/day of fiber. Patients were not treated with vitamins or mineral preparations during the study.
Standard diet advice was given by a dietitian and/or specialist doctor. The dietitian and/or a specialist doctor periodically provided instruction on dietary intake recording procedures as part of a behavior modification program and then later used the subject's food diaries for counselling. Individuals were also encouraged to increase their physical activity by walking briskly for 20–30 min, three to five times per week, or by cycling. The recommended changes in physical activity throughout the study were not assessed.
Assessments
Before starting the study, all patients underwent an initial screening assessment that included a medical history, physical examination, vital signs, a 12-lead electrocardiogram, measurements of weight, BMI, and levels of HbA1c, fasting plasma glucose (FPG), postprandial plasma glucose (PPG), fasting plasma insulin (FPI), homeostasis model assessment insulin resistance index (HOMA-IR), homeostasis model assessment β-cell function index (HOMA-β), fasting plasma proinsulin (FPPr), proinsulin/FPI ratio (Pr/FPI ratio), and C-peptide. We measured these parameters at baseline and after 6, 12, 18, 24, 30, and 36 months. At baseline and every 6 months, patients underwent a combined euglycemic hyperinsulinemic and hyperglycemic clamp, with subsequent arginine stimulation, to assess insulin sensitivity and insulin secretion.
In order to evaluate the tolerability assessments, all adverse events were recorded. All plasma parameters were determined after a 12-h overnight fast, with the exception of PPG, which was determined 2 h after a standardized meal. Venous blood samples were taken for all patients between 8:00 and 9:00 AM. We used plasma obtained by addition of Na2EDTA (1 mg/mL) and centrifuged at 3,000 g for 15 min at 4°C. Immediately after centrifugation, the plasma samples were frozen and stored at −80°C for no more than 3 months. All measurements were performed in a central laboratory.
BMI was calculated as weight in kilograms divided by the square of height in meters. The HbA1c level was measured by a high-performance liquid chromatography method (Diamat™; Bio-Rad, Hercules, CA) (normal values, 4.2–6.2%), with intra- and interassay coefficients of variation (CVs) of <2%. 18
Plasma glucose was assayed by the glucose oxidase method (GOD/PAP; Roche Diagnostics, Mannheim, Germany) with intra- and interassay CVs of <2%. 19 Plasma insulin was assayed with the Phadiaseph insulin radioimmunoassay (Pharmacia, Uppsala, Sweden) by using a second antibody to separate the free and antibody-bound125I-insulin (intra- and interassay CVs, 4.6% and 7.3%, respectively). 20
The HOMA-IR index was calculated as the product of basal glucose (in mmol/L) and insulin levels (in μU/mL) divided by 22.5. 21,22 The HOMA-β index was calculated as the product of 20 and basal insulin levels (μU/mL) divided by the value of basal glucose concentrations (mmol/L) minus 3.5; this formula has been proposed to be a good measure of β-cell function. 22
Proinsulin was determined using an enzyme-linked immunosorbent assay (Mercodia, Uppsala). The intra- and interassay CVs were 2.4% and 8.9%, respectively. 23
C-peptide levels were measured with the automated immunochemiluminometric method (ADVIA Centaur®; Siemens Medical Solutions Diagnostics, Deerfield, IL). The lowest detectable level is 0.02 nmol/L. The intra- and interassay CVs were 3.7% and 8.3%, respectively. The normal range for fasting C-peptide levels is 0.3–0.9 nmol/L. There is no significant cross-reaction with proinsulin. 24
Glucose clamp technique
A combined euglycemic hyperinsulinemic and hyperglycemic clamp, with subsequent arginine stimulation, was performed to assess insulin sensitivity 25 and insulin secretion. 26 Arginine was administered during a hyperglycemic clamp to measure maximum insulin secretory capacity at a steady-state glucose concentration of 270 mg/dL. 27
Clamps were performed before randomization and after 12 months at the end of the study. At 9:00 AM, after the patients had fasted for 12 h overnight, an indwelling cannula (18-gauge polyethylene cannula; Venflon™; Viggo, Helsingborg, Sweden) was placed into an antecubital vein for infusion of glucose and insulin. To obtain arterialized venous blood samples, an indwelling cannula was inserted in a retrograde fashion into a dorsal hand or wrist vein and maintained in a heated box at 70°C. In the contralateral arm, a second cannula was introduced anterogradely in an antecubital vein of the forearm for the variable infusion of 20% glucose (model IVAC560 pump; IVAC, San Diego, CA) and insulin (rate, 1 mU/min/kg) (Humulin® R; Eli Lilly, Indianapolis, IN) using a Harvard microinfusion pump (Plato BV, Diemen, The Netherlands). Arterialized blood samples were collected every 5 min to determine glucose concentration (model EML 105; Radiometer, Copenhagen, Denmark). The amount of glucose infused was adjusted to maintain euglycemia at 90 mg/dL. After the euglyemic hyperinsulinemic part of the clamp (t=120 min), insulin infusion was discontinued for 60 min, while the glucose level was maintained at 90 mg/dL. After the euglycemic hyperinsulinemic clamp, a hyperglycemic clamp was performed. To quantify insulin secretion, the blood glucose concentration was rapidly raised to 270 mg/dL by administering a 50% glucose bolus in 2 min (adjusted for body weight) followed by a variable 20% glucose infusion to maintain 270 mg/dL blood glucose for the next 110 min. At 80 min after induction of hyperglycemia, 5 g of arginine dissolved in 50 mL was infused over 45 s to measure maximum insulin secretory capacity (t=260 min), while the glucose concentration was maintained at 270 mg/dL.
First- and second-phase C-peptide secretion during the hyperglycemic clamp was calculated as area under the curve (AUC): AUC180–190min and AUC190–260min, respectively. Arginine-stimulated C-peptide secretion (AIRarg) was calculated as the incremental AUC260–270min above the fasting C-peptide concentration. During the euglycemic hyperinsulinemic clamp, the M-value was calculated based on the last 30 min (steady state) and after adjustments for steady-state insulin concentration. The disposition index (DI) was determined by multiplying arginine-stimulated insulin secretion with the M-value.
Statistical analysis
Considering as clinically significant a difference of at least 10% compared with the baseline and an α error of 0.05, a sample size of 200 patients per group was required to provide 90% power to detect a significant between-group difference in any variable related to β-cell function (i.e., AIRarg) and in variables related to glucose metabolism (i.e., HbA1c, FPG, PPG, and FPI). An intent-to-treat analysis was conducted in patients who had received at least one dose of study medication and had a subsequent efficacy observation. Patients were included in the safety analysis if they had received one dose of trial medication after randomization and had a subsequent safety observation. Continuous variables were evaluated using analysis of variance tests. Intervention effects were adjusted for the presence of potential confounding variables using analysis of covariance. Analysis of variance was also used to assess variables' significance within and between groups. The statistical significance of the independent effects of treatments on the other variables was determined using analysis of covariance. The dependent variable used in the model is the change from pretreatment for the β-cell function variables (AIRarg, first phase, second phase). For all other end points the dependent value used is the mean at the corresponding visit. The Bonferroni correction for multiple comparison also was carried out. Statistical analysis of data was performed using the Statistical Package for Social Sciences software version 11.0 (SPSS Inc., Chicago, IL). All inferential statistical tests were conducted at a significance level of 0.05 (two sided). Data are presented as mean±SD values. 28
Results
Study sample
In total, 476 patients were enrolled in the study, and 436 subjects completed the 3-year study. There were 12 patients (five men and seven women) at the first year who did not complete the study, and the reasons for premature withdrawal included side effects such as diarrhea (one man and one woman), nausea (one man and one woman), vomiting (one woman), gastrointestinal discomfort (three women and 2 men), and lost to follow-up (one woman and one man). Then, there were 11 patients (four men and seven women) at the second year who did not complete the study, and the reasons for premature withdrawal included side effects such as lost to follow-up (one man and one woman), edema of the legs (one man and two women), body weight increase (≥3 kg) (two women and one man), pain in the fingers (no fractures) (one woman), and consent withdrawn (one woman and one man). Finally, there were 17 patients (10 men and seven women) at the third year who did not complete the study: in particular, 11 patients in the glibenclamide group and six patients in the sitagliptin group after randomization. The reasons for premature withdrawal in the glibenclamide group included side effects such as hypoglycemia (FPG <60 mg/dL) (four men and one woman), body weight increase (≥3 kg) (two men and one woman), consent withdrawn (one man and one woman), and lost to follow-up (one woman). The reasons for premature withdrawal in the sitagliptin group included side effects as consent withdrawn (one man), lost to follow-up (one woman), nasopharyngitis (two men and one woman), and headache (one woman). The characteristics of the patient population at study entry and during the study are shown in Tables 1 –3.
Data are mean±SD values.
P<0.05, b P<0.02, c P<0.01 versus baseline.
P<0.05, e P<0.01 versus metformin (12 months).
AIRarg, C-peptide response to arginine at 270 mg/dL glucose concentration; BMI, body mass index; DI, disposition index (AIRarg×M-value); F, female; first phase, first-phase C-peptide response to glucose; FPG, fasting plasma glucose; FPI, fasting plasma insulin; FPPr, fasting plasma proinsulin; HbA1c, glycated hemoglobin; HOMA-β, homeostasis model assessment β-cell function index; HOMA-IR index, homeostasis model assessment insulin resistance index; M, male; PPG, postprandial plasma glucose; Pr/FPI ratio, proinsulin/FPI ratio; second phase, second-phase C-peptide response to glucose.
Data are mean±SD values.
P<0.05, b P<0.02, c P<0.01, d P<0.002, e P<0.001, f P<0.0002, g P<0.0001 versus baseline.
P<0.05, i P<0.01, j P<0.002, k P<0.001, l P<0.0001 versus metformin (12 months).
P<0.05 versus glibenclamide.
P<0.05, o P<0.02, p P<0.01, q P<0.001, r P<0.0001 versus pioglitazone (24 months)
AIRarg, C-peptide response to arginine at 270 mg/dL glucose concentration; BMI, body mass index; DI, disposition index (AIRarg×M-value); F, female; first phase, first-phase C-peptide response to glucose; FPG, fasting plasma glucose; FPI, fasting plasma insulin; FPPr, fasting plasma proinsulin; HbA1c, glycated hemoglobin; HOMA-β, homeostasis model assessment β-cell function index; HOMA-IR index, homeostasis model assessment insulin resistance index; M, male; PPG, postprandial plasma glucose; Pr/FPI ratio, proinsulin/FPI ratio; second phase, second-phase C-peptide response to glucose.
Parameter variations after the first year of run-in with metformin monotherapy (Table 1)
We observed a reduction of HbA1c, FPG, PPG, and HOMA-IR after 12 months of metformin compared with baseline. The M-value during the euglycemic hyperinsulinemic and hyperglycemic clamp decreased after 12 months of metformin. No other statistically significant variations were obtained for the other parameters.
Parameter variations after the second year of run-in with the metformin+pioglitazone combination (Table 2)
A further decrease of HbA1c, FPG, and PPG was recorded with the addition of pioglitazone compared with baseline. Moreover, FPG and PPG values were significantly lower compared with the ones obtained after 12 months of metformin. HOMA-IR decreased after 18 and 24 months compared with baseline and compared with the value recorded after 12 months of metformin. There was also a decrease of FPI and FPPr values after 24 months compared with baseline with the addition of pioglitazone.
Regarding the parameter variations after the euglycemic hyperinsulinemic and hyperglycemic clamp, there was an increase of M-value at 18 months and 24 months compared with baseline. At 24 months, the difference was also significant versus 12 months of metformin. First- and second-phase secretion, AIRarg, and DI were significantly higher after 24 months compared with baseline.
Parameter variations after triple therapy with glibenclamide or sitagliptin added to metformin+pioglitazone (Table 3)
In the group treated with glibenclamide, we observed an increase of body weight and BMI compared with 12 months of metformin and with the values obtained after 24 months with pioglitazone. No variations of body weight or BMI were recorded with sitagliptin, although the values reached with sitagliptin at 36 months were significantly lower than the ones reached with glibenclamide.
Glibenclamide and sitagliptin similarly decreased the HbA1c level after 30 and 36 months compared with baseline, 12 months of metformin, and 24 months of pioglitazone. Both FPG and PPG significantly decreased compared with baseline with glibenclamide and with sitagliptin without significant differences between the two treatments. Furthermore, we observed that FPG and PPG obtained with glibenclamide and sitagliptin were significantly lower than the ones reached with metformin at 12 months and with pioglitazone at 24 months. FPI was significantly increased by glibenclamide at 36 months both compared with metformin monotherapy at 12 months and compared with pioglitazone at 24 months (P<0.05). On the other hand, sitagliptin significantly decreased FPI compared with 12 months of metformin and with glibenclamide at 36 months. At 36 months glibenclamide significantly increased HOMA-IR compared with pioglitazone at 24 months, whereas sitagliptin decreased HOMA-IR compared with baseline, 12 months of metformin, and 24 months of treatment and also compared with glibenclamide at 36 months. Although sitagliptin did not change HOMA-β, this value was significantly increased by glibenclamide compared with 12 months of metformin, pioglitazone at 24 months, and sitagliptin at 36 months. FPPr was not influenced by glibenclamide, whereas it was decreased by sitagliptin compared with baseline, 12 months of metformin, and glibenclamide. There was a significant decrease of Pr/FPI with glibenclamide compared with baseline, metformin, and pioglitazone at 24 months. Sitagliptin increased the Pr/FPI ratio at 36 months, compared with baseline, 12 months of metformin, and pioglitazone at 24 months. Both glibenclamide and sitagliptin increased the C-peptide response compared with baseline at 36 months.
Euglycemic hyperinsulinemic and hyperglycemic clamp derived measures of β-cell function (Table 3)
There was an increase of the M-value with glibenclamide at 30 and 36 months; no other variations were observed in the group treated with glibenclamide regarding β-cell secretory function during the clamp. With sitagliptin, instead, the M-value was increased at 30 and 36 months; the difference was significant between sitagliptin and 12 months of metformin, between sitagliptin and pioglitazone, and between sitagliptin and glibenclamide at 36 months. First- and second-phase secretions were also improved after 30 and 36 months in the sitagliptin group. First- and second-phase secretions were significantly higher with sitagliptin compared with 12 months of metformin, pioglitazone at 24 months, and glibenclamide.
AIRarg and DI were significantly increased by sitagliptin compared with baseline. There was also a significant difference between the values obtained with sitagliptin versus 12 months of metformin, versus pioglitazone at 24 months, and versus glibenclamide.
Discussion
In the first part of our study we observed that a combination of metformin and pioglitazone was effective in improving glycemic control and insulin resistance. Metformin and pioglitazone also improved β-cell function, increasing the M-value, first- and second-phase secretion, AIRarg, and DI, confirming what we have already reported in our previous studies. 29,30 In fact, we previously conducted a study where we compared metformin and pioglitazone monotherapy versus their combination or versus a combination of glimepiride+metformin in reducing insulin resistance evaluated using an euglycemic hyperinsulinemic clamp. We observed that pioglitazone+metformin-based therapy is associated with the most quantitatively relevant improvement in insulin resistance–related parameters, whereas the sulfonylurea+metformin treatment has less relevant effects. 29 In the current study no significant increase of body weight was observed with the combination of pioglitazone and metformin, confirming what we have already reported. 6,7 In the second part of our study, instead, we compared the effects of a triple therapy with glibenclamide or sitagliptin added to the already ongoing metformin+pioglitazone combination. Sitagliptin and glibenclamide triple therapies gave a similar decrease of glycemic control, as already reported by Nauck et al. 31 and Seck et al., 32 who compared sitagliptin and the sulfonylurea glipizide in patients inadequately controlled with metformin. Our results about sitagliptin are in line with what was reported by Fonseca et al., 33 who, similarly to us, assessed the efficacy and safety of sitagliptin in combination therapy with metformin and pioglitazone in patients with type 2 diabetes. Despite the similar decrease of HbA1c, however, sitagliptin significantly decreased body weight compared with glibenclamide, similarly to what reported by Arjona Ferreira et al., 34 who observed a decrease in body weight with sitagliptin (–0.6 kg) versus an increase (+1.2 kg) with the sulfonylurea glipizide. Regarding HOMA-IR, it increased with glibenclamide addition compared with metformin+pioglitazone dual therapy, whereas it decreased with sitagliptin addition. This is in line with a previous study by our group where we compared pioglitazone and glibenclamide 35 : pioglitazone gave a reduction of HOMA-IR, which was not observed with glibenclamide; this is due to the different mechanism of action of the two drugs. A similar trend was recorded for FPI. Regarding the effects on β-cell function, a previous study by Harrison et al. 36 reported that β-cell function can be preserved for at least 3.5 years after diagnosis of type 2 diabetes when intensive therapy is initiated early in the disease process. This was true regardless of the method used to attain intensive control (insulin-based regimen or a triple combination of metformin, pioglitazone, and glibenclamide, both after an initial 3-month insulin treatment period). Given the design of the study, however, the authors were unable to differentiate whether the β-cell preservation effect was attributed to the initial insulin-based therapy that all patients received in the run-in phase or to ongoing therapy received after randomization. At this regard, in our study the sitagliptin+pioglitazone+metformin combination gave a better increase of DI (+51%) compared with glibenclamide+pioglitazone+metformin (+22%), suggesting that sitagliptin has a better preservation effect on β-cells. The results about sitagliptin are in line with what already reported in two previous studies, 11,12 where sitagliptin, added to metformin, but not placebo+metformin, gave a greater increase of HOMA-β, M-value, AIRarg, and DI compared with the placebo+metformin group.
A limitation of our study is that we did not record if the improvement of β-cell function was maintained after the suspension of triple therapy; on the other hand, we focused our attention on insulin resistance parameters, not on inflammatory biomarkers. However, to the best of our knowledge, this is the first study comparing sitagliptin or glibenclamide in addition to the metformin+pioglitazone combination.
Conclusions
Our study confirmed that dual combination therapy is more effective than monotherapy in improving glycemic control. Furthermore, when the metformin and pioglitazone combination is not enough to maintain an adequate glycemic control, sitagliptin should be preferred to glibenclamide as the third agent because of its positive effect on β-cells.
Footnotes
Author Disclosure Statement
The authors have no relevant affiliations or financial involvement with any organization or entity with a financial interest in or financial conflict with the subject matter or materials discussed in the manuscript. This includes employment, consultancies, honoraria, stock ownership or options, expert testimony, grants or patents received or pending, or royalties. No writing assistance was used in the production of this manuscript.