
Abstract
Background:
The prevention of hypoglycemic events is of paramount importance in the daily management of insulin-treated diabetes. The use of short-term prediction algorithms of the subcutaneous (s.c.) glucose concentration may contribute significantly toward this direction. The literature suggests that, although the recent glucose profile is a prominent predictor of hypoglycemia, the overall patient's context greatly impacts its accurate estimation. The objective of this study is to evaluate the performance of a support vector for regression (SVR) s.c. glucose method on hypoglycemia prediction.
Materials and Methods:
We extend our SVR model to predict separately the nocturnal events during sleep and the non-nocturnal (i.e., diurnal) ones over 30-min and 60-min horizons using information on recent glucose profile, meals, insulin intake, and physical activities for a hypoglycemic threshold of 70 mg/dL. We also introduce herein additional variables accounting for recurrent nocturnal hypoglycemia due to antecedent hypoglycemia, exercise, and sleep. SVR predictions are compared with those from two other machine learning techniques.
Results:
The method is assessed on a dataset of 15 patients with type 1 diabetes under free-living conditions. Nocturnal hypoglycemic events are predicted with 94% sensitivity for both horizons and with time lags of 5.43 min and 4.57 min, respectively. As concerns the diurnal events, when physical activities are not considered, the sensitivity is 92% and 96% for a 30-min and 60-min horizon, respectively, with both time lags being less than 5 min. However, when such information is introduced, the diurnal sensitivity decreases by 8% and 3%, respectively. Both nocturnal and diurnal predictions show a high (>90%) precision.
Conclusions:
Results suggest that hypoglycemia prediction using SVR can be accurate and performs better in most diurnal and nocturnal cases compared with other techniques. It is advised that the problem of hypoglycemia prediction should be handled differently for nocturnal and diurnal periods as regards input variables and interpretation of results.
Introduction
Hypoglycemia in insulin-dependent diabetes patients is the aggregate of therapeutic hyperinsulinemia and an attenuated sympathoadrenal response to falling plasma glucose concentrations. 3 Of great importance is the finding that recent antecedent hypoglycemia, prior exercise, and sleep further impair the physiological and behavioral defenses against a potential subsequent hypoglycemia (i.e., hypoglycemia-associated autonomic failure [HAAF]) and therefore cause a vicious cycle of recurrent hypoglycemia. 2,4 The awareness of all these factors by diabetes patients may contribute to the prevention of hypoglycemia on a daily basis. Nevertheless, those with diabetes could take advantage of computational solutions that alert them for an upcoming hypoglycemia and thus enable its prevention.
The last advances in continuous glucose monitoring (CGM) technologies have promoted the research in predictive modeling of glucose metabolism both in type 1 and in type 2 diabetes. Autoregressive and autoregressive moving average models of the CGM time series 5 –9 as well as feed-forward neural networks 10 based only on recent CGM data were found to have short-term (up to 30 min) predictive capacity of the subcutaneous (s.c.) glucose concentration. More accurate predictions were achieved by applying a recurrent neural network on a wider (200-min) CGM history. 11,12 The fact that (1) the autocorrelation function of the s.c. glucose measurements vanishes at about 30 min 13 and (2) several exogenous inputs play a vital role in glucose regulation have led to predictive models incorporating more comprehensive information. 14 –19 More specifically, multivariate nonlinear regression techniques of machine learning, such as feed-forward 14,15 and recurrent neural networks, 16 –18 and support vector regression (SVR) 19 were efficiently used for this purpose, demonstrating the effect of additional inputs on short- and long-term predictions.
Although hypoglycemia is the limiting factor in the glycemic management of insulin-treated diabetes, there have been only a few studies that went one step further by addressing the problem of hypoglycemic event prediction. This problem involves the successful prediction of the beginning of the event and therefore differs from predicting single hypoglycemic values. 20 –22 On this basis, only statistical and time-series methods 23 –25 were evaluated for prediction horizons up to 55 min using hypoglycemic thresholds ranging from 60 mg/dL to 90 mg/dL. The results obtained are promising with sensitivity reaching 100% in a study 24 with lead times close to the examined prediction horizons. However, these methods were evaluated on CGM recordings of patients with type 1 diabetes who underwent an insulin-induced hypoglycemia test during their admission in clinical research centers. With the view to embedding these new models eventually into CGM systems or into diabetes advisory mobile systems, the need to test them under free-living conditions in daily life is evident.
We have previously proposed an individualized approach to predicting the s.c. glucose concentration that relies on the SVR technique, which was evaluated on a multivariate dataset of 27 type 1 diabetes patients in free-living conditions. 19 One of the innovations of our work was the experimentation with different inputs corresponding to combinations of variables associated with the s.c. glucose profile, the plasma insulin concentration, the rate of appearance of meal-derived glucose in the system circulation, the energy expenditure (EE) during physical activities, and the time of the day. Besides high performance over the full range of glucose values, more than 94% of both short-term (i.e., for 15 min and 30 min) and medium- to long-term (i.e., for 60 min and 120 min) hypoglycemic predictions were classified as clinically accurate or with benign errors according to the continuous glucose error grid analysis. 26
In this study, we extend our method to predict hypoglycemic events 30 min and 60 min in advance and provide a comparison of SVR with other well-established machine learning techniques. Considering that in type 1 diabetes hypoglycemia occurs most frequently at night during sleep and is potentially fatal if untreated, 27 we separated the hypoglycemic events into nocturnal and diurnal ones. In particular, for nocturnal events, we introduce new input variables in addition to those defined in our previous work 19 with the aim of capturing the effect of HAAF on the incidence of a future hypoglycemic event. To our knowledge, this is the first work that deals with the problem of hypoglycemia prediction as an event in free-living patients using SVR.
Subjects and Methods
Dataset
Fifteen type 1 diabetes patients, following multiple-dose insulin therapy, were monitored for from 5 to 22 days (average, 12.5±4.6 days) in free-living conditions within the European Union co-funded research project METABO. 28 The dataset consisted of three women and 12 men whose ages ranged from 19 to 65 years (average, 40.3±13.5 years) with a body mass index from 21.4 to 30.0 kg/m2 (average, 25.2±2.9 kg/m2) and hemoglobin A1c level from 5.2% to 8.5% (average, 7.1±1.2%). Patients wore the Guardian® REAL-Time CGM system (Medtronic Minimed Inc., Northridge, CA), which reports an average s.c. glucose value every 5 min. They were also recording information on food intake (i.e., type, amount, and time) and insulin regimen (i.e., type, dose, and time) on a daily basis, while a dietician calculated the amount of carbohydrates for each meal. In addition, the SenseWear® armband (BodyMedia® Inc., Pittsburgh, PA) physical activity monitor was used, which computes a range of relative variables (e.g., EE, metabolic equivalents [MET], sleep detection) every 1 min. The descriptive characteristics of the s.c. glucose dataset are given in Table 1.
Data are mean±SD values. A glucose concentration value of ≤70 mg/dL was defined as hypoglycemic; a glucose concentration value of ≥180 mg/dL was defined as hyperglycemic.
Glucose predictive model
The prediction of the s.c. glucose concentration at time (t+l), assuming that t is the time at which the prediction is made and l is the prediction horizon, is given by the SVR function
29
of the input
The input 1. The CGM glucose values (gl) within the last 30 min [i.e., 2. The rate of appearance of meal-derived glucose (Ra) within the last 30 min with respect to the time of prediction (t+l) [i.e., 3. The plasma insulin concentration (I
p) within the last 30 min with respect to (t+l) [i.e., I
p(t+l−30), I
p(t+l−5), I
p(t+l)]. The time course of I
p is calculated by the model of Tarin et al.,
31
which describes both the s.c. absorption kinetics for various insulin analogs and the associated plasma dynamics. 4. The meal-derived glucose inserted in plasma (SRa), with respect to (t+l), calculated cumulatively every 10 min over the last 90 min [that is, for i=0, …, 8. 5. The cumulative amount of EE (SEE) calculated every 10 min over the last 3 h [that is, for i=0, …, 17 and where EE expresses the instantaneous EE provided by the SenseWear armband. 6. The hour of day (h) identifying the 24-h intervals within a day.
In our study, the SVR model was built with a Gaussian RBF kernel, and the hyperparameters C and ɛ and the kernel parameter γ were optimized using the differential evolution algorithm,
32
in which the objective function was defined as the average root mean square error of the 10-fold cross-validation procedure. The three-dimensional search space was set as
For comparison purposes, the problem of hypoglycemic event prediction is also addressed by two other widely known machine learning techniques: the feed-forward multilayer perceptron 33 (MLP) and Gaussian processes 34 (GP) regression techniques. The feed-forward MLP is composed of one hidden layer with H neurons having a tangent sigmoid activation function and one output layer with one neuron having a linear function. The weights and bias parameters of the network are trained based on the Levenberg–Marquardt back-propagation algorithm applied in a batch mode and with early-stopping (i.e., validation set). The number of hidden neurons H is optimized individually for each patient based on 10-fold cross-validation. The GP model is built with an exponential quadratic kernel, while its hyperparameters (i.e., kernel parameters and noise precision) are learned for each patient separately through the maximization of the log likelihood function. Both MLP and GP are evaluated separately for each patient by 10-fold cross-validation.
Hypoglycemic event prediction
In accordance with the American Diabetes Association recommendations, 27 we use the threshold of 70 mg/dL to identify a plasma glucose concentration value, measured by the CGM system, as hypoglycemic. To this end, we define that (1) a hypoglycemic event starts when at least two consecutive s.c. glucose concentration values (i.e., 10 min or more) are ≤70 mg/dL, and (2) it ends when the glucose value rise above 70 mg/dL. 35 To treat potential oscillations either in the predicted or in the actual time-series, consecutive hypoglycemic events that are ≤30 min away are considered as the same event. At this point it should be mentioned that predictions are performed for horizons of 30 min and 60 min because higher horizons have been considered as impractical, 36 whereas lower ones are rather unhelpful. Moreover, a new glucose prediction is produced every 5 min, which is the sampling period of the CGM system used in this study.
A prediction of a hypoglycemic event is considered true-positive (TP) when the start of the actual hypoglycemic either precedes the start of the predicted one by ≤l min or follows the start of the predicted one by ≤l min. Otherwise, when a true hypoglycemic event is not predicted or a false hypoglycemic event is predicted, then a false-negative (FN) or a false-positive (FP) prediction, respectively, is identified. Note that we do not apply the term true-negative, which in our case would mean to correctly identify a non-hypoglycemic region (i.e., euglycemia or hyperglycemia) as such.
Because hypoglycemia occurring during nocturnal sleep is important for diabetes patients, we separate hypoglycemic events into nocturnal and diurnal ones. In particular, nocturnal hypoglycemia is defined as each hypoglycemic event occurring at night when the individual is asleep, whereas all the other events are characterized as diurnal. The sleep state is detected using the related information provided by the SenseWear armband activity monitor.
Determination of the input
The SVR glucose predictive model is fed with three different cases of input. In the first case, denoted herein as Case 1hypo (corresponding to Case 4 in Georga et al. 19 ), the input consists of the variables gl, I p, Ra, SRα, and h, whereas in the second case, namely, Case 2hypo (corresponding to Case 6 in Georga et al. 19 ), the variable SEE is additionally used.
The concept of HAAF led us to introduce an additional input case, denoted herein as Case 3hypo, which would also allow for the inclusion of its causes, namely, recent antecedent hypoglycemia, prior exercise, and sleep. The variable SEE, which concerns the EE during the last 3 h, may only explain hypoglycemia shortly after exercise. However, exercise-related HAAF is exemplified by hypoglycemia that typically occurs several hours (6–15 h) after exercise and thus is often nocturnal. 4
HAAF is mainly associated with hypoglycemic events that occur during sleep. Thus, we define Case 3hypo only for nocturnal events, whereas Case 1hypo and Case 2hypo are applied to the prediction of both nocturnal and diurnal ones. This means that in Case 3hypo the SVR model is trained to predict only the night glucose time series. Thus, in addition to the inputs of Case 1hypo, Case 3hypo includes: 1. The total EE during the day due to physical activities of intensity of <3 METs (EE
daily,<3METs). 2. The total EE during the day due to physical activities of intensity ≥3 METs (EE
daily,≥3METs). 3. The time passed from the start of the sleep state (t
sleep). 4. A Boolean variable describing the incidence or not of a hypoglycemic event during the previous 24 h (hypo).
Moreover, experimental and clinical observations have indicated that glucose levels change more gradually at night than during the day. 37 Therefore, in the present analysis for each of the previous cases as regards the nocturnal events, we consider one subcase (i.e., Case 1ahypo, Case 2ahypo, Case 3ahypo), where the history of gl is set equal to 60 min.
Evaluation criteria
The proposed method is evaluated by computing the measures of sensitivity, precision, and time lag. Sensitivity, defined as TP/(TP+FN), relates to the method's ability to identify positive hypoglycemic events. On the other hand, precision, defined as TP/(TP+FP), reflects the probability that a predicted event is true. Finally, time lag, defined as the mean absolute temporal error between the start of the actual and the predicted hypoglycemic event, is a highly crucial measure that reflects the temporal gain in preventing the upcoming event.
Results
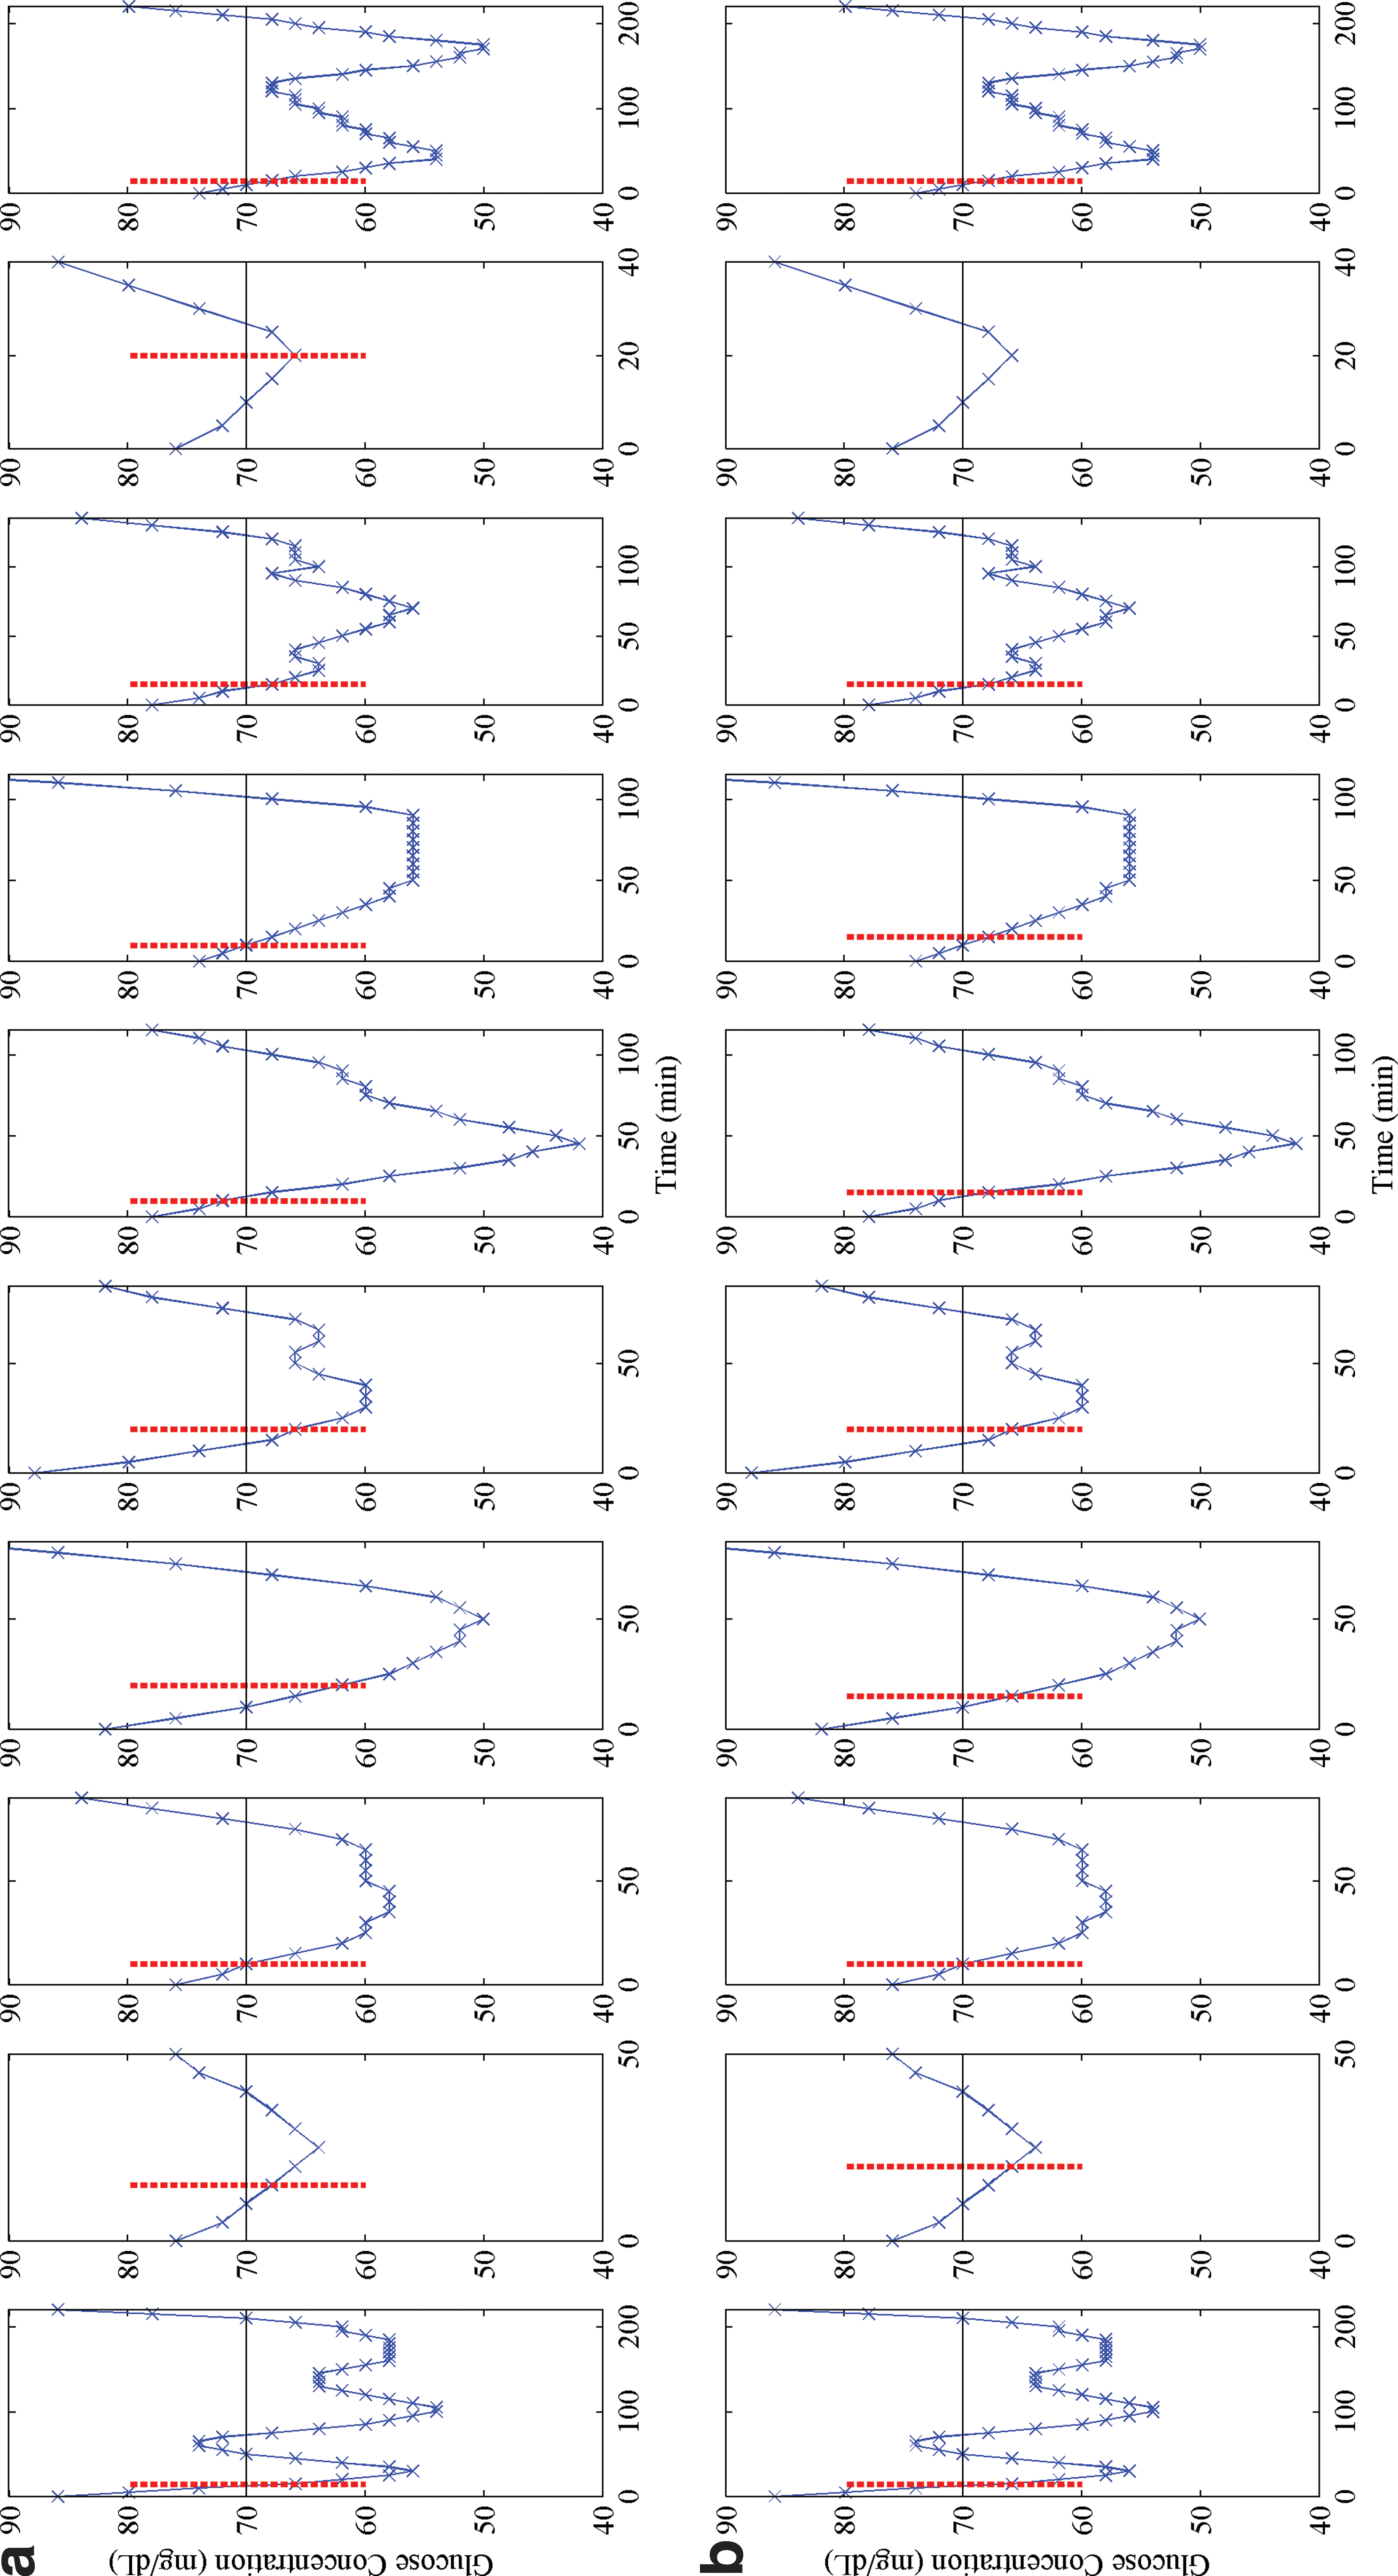
The average results obtained in all 15 subjects of the study are reported in Table 2 separately for nocturnal and diurnal hypoglycemic events. In Case 1hypo, the 30-min and 60-min nocturnal predictions are of satisfactory sensitivity and of high precision, but they are associated with relatively high time lags. Case 2hypo, as expected, does not induce significant changes in the number of TP and FP outcomes. In contrast, Case 3hypo increases sensitivity and precision especially of 60-min predictions (average, 90% and 100%, respectively) and lowers markedly the time lag for both prediction horizons (average, 5.00 min and 6.18 min, respectively) compared with the previous cases. In Figure 1, we see the actual onset of the nocturnal events of a patient and the predicted onset (with 30-min horizon) denoted by a vertical dotted line. It can be observed that in Case 3hypo the time lag is smaller than in Case 1hypo. The sensitivity of Case 1hypo and Case 2hypo is almost unaffected by increasing the gl history from 30 min to 60 min (Case 1ahypo and Case 2ahypo), whereas there is a noticeable improvement in their precision rate. Regarding Case 3ahypo, it results in predicting correctly 94% of the events with 98% precision for both prediction horizons. Nevertheless, it is obvious that gl history has a great influence on the time gain in the TP events for a 60-min prediction horizon.

The output of
Data are mean±SD values.
PRC, precision; SNS, sensitivity; TL, time lag.
Regarding diurnal hypoglycemic events, Case 1hypo predicts correctly 92% and 96% of the true hypoglycemic events 30 min and 60 min in advance, respectively, with 93% and 97%, respectively, of the positive predictions being indeed true. The time lag for both prediction horizons is less than 5 min. However, the sensitivity of the method is reduced when the variable SEE is additionally used in Case 2hypo, reaching 84% for 30-min predictions and 93% for 60-min predictions. In addition, there are no significant changes in precision rate compared with Case 1hypo, while the time lag is still less than 5 min. The output of Case 1hypo and Case 2hypo for a patient is illustrated in Figure 2, where for the ninth hypoglycemic event we observe that Case 2hypo generates a FN result contrary to Case 1hypo.
The output of
Table 3 presents the average results obtained by the MLP and GP prediction techniques. Regarding nocturnal events, SVR outperforms MLP in all cases except Case 3hypo for the 30-min prediction horizon and Case 2ahypo for 60 min. We observe that Case 3hypo and Case 3ahypo improve significantly the performance of MLP, and especially the time lag, for both horizons. On the other hand, GP produces smaller time lags than SVR and, consequently, higher sensitivities for most of the input cases, which becomes more apparent in 60-min predictions. More specifically, the sensitivity of GP in Case 3hypo for 30-min and 60-min predictions is 95% and 98%, respectively, reaching 100% in Case 3ahypo for both horizons, and all time lags are less than 5 min. However, SVR and GP techniques have similar precision rates. As far as diurnal events are concerned, SVR performs better than both other techniques except for Case 2hypo for the 30-min prediction horizon, where it has a slightly lower sensitivity.
Data are mean±SD values.
PRC, precision; SNS, sensitivity; TL, time lag.
Table 4 presents the evaluation results of the three techniques only on diurnal hypoglycemic events verified by a finger-stick blood glucose measurement. The most significant changes are observed for Case 1hypo, where the 30-min sensitivity of SVR and GP is reduced to 82% and 71%, respectively, whereas the 60-min sensitivity of MLP and GP is reduced to 48% and 57%, respectively. However, it should be noted that blood glucose measurements were not available for all hypoglycemic events.
Data are mean±SD values.
SNS, sensitivity; TL, time lag.
Discussion
The objective of this study was to evaluate the ability of the SVR glucose predictive model, which was presented in a previous study, 19 to predict hypoglycemic events over 30-min and 60-min time horizons. The novelty of our work consists in that (1) this problem is addressed with the SVR technique based on a multivariate dataset acquired in free-living conditions from multiple patients and (2) new inputs are introduced for treating hypoglycemia during nocturnal sleep.
This specific problem has so far been dealt only through linear mathematical approaches that exploit solely the recent CGM profile. 23 –25 The CGM signal itself is indeed the most important feature but mainly explains its subsequent behavior for up to 30 min 13 and thus allows only for short-term predictions of low accuracy. 5 –10 We demonstrated herein the implicit or explicit influence of the exogenous inputs on the glucose dynamics. This is actually the main advantage of the proposed method over the ones presented in the literature 23 –25 ; it has the ability to learn the effect of patient's contextual information (e.g., meals, insulin, exercise, sleep) on the s.c. glucose concentration, without requiring any a priori knowledge about their physiological relationships. Moreover, the SVR technique may accurately explain both linear and nonlinear relationships between the input variables and the glucose dynamics, while exhibiting a very good generalization performance. In addition, for the first time we examined thoroughly additional indicators of hypoglycemia concerning (1) those related to the HAAF concept mechanisms triggering nocturnal hypoglycemia and (2) the slow change of glucose time series during night, which were proved to contribute to significantly better predictions.
Results for 15 type 1 diabetes patients suggest that our SVR method performs adequately well in all cases for both prediction horizons. One important finding is that the method's sensitivity to nocturnal hypoglycemic events increases in Case 3hypo, whereas it shows no significant change in Case 2hypo, compared with Case 1hypo, which means that even a summary of the daily physical activities affects nocturnal hypoglycemia. This is also reflected in reduced time lags. The comparative assessment of SVR with MLP and GP regarding nocturnal events has demonstrated that GP and SVR have comparable performance for the 30-min horizon, whereas GP shows better sensitivity as well as improved time lags for the 60-min horizon compared with SVR. The improvement of predictions in Case 3hypo and Case 3ahypo is systematically observed for all techniques, which verifies the observations.
Regarding diurnal predictions, the SVR performs generally better compared with the MLP and GP techniques. There is one exception in Case 2hypo, which concerns the introduction of information on physical activity, where for the 30-min horizon the sensitivity of SVR is lower than the other techniques. Unexpectedly, this sensitivity is even smaller than in Case 1hypo, as opposed to the corresponding MLP and GP cases. This leads us to conclude that the poorer SVR prediction in Case 2hypo should be possibly attributed to the technique itself and not to the introduction of this extra information. Another unexpected finding is that diurnal predictions over 60-min horizons are better than those over 30-min horizons for SVR. This was also found for MLP. However, a direct comparison of the results for 30 min and 60 min should not be made because the set of hypoglycemic events on which the methods are evaluated are different (i.e., the events for 60 min is a subset of the ones for 30 min). This stems from the fact that different datasets have been constructed for each horizon (e.g., instances at which meal or insulin events occurred in the meantime were excluded). 19
The methods presented in the literature for hypoglycemic event prediction 23 –25 have been all assessed in datasets acquired from short-term (usually 24-h) studies conducted under controlled conditions in clinical settings. This enables fairly accurate predictions despite the fact that they apply time series or statistical analysis of the continuous glucose concentration values without using any exogenous inputs. In particular, Eren-Oroklu et al. 25 have reported a sensitivity of 89%, a precision rate of 78%, and a lead time of 27.7 min, having set the hypoglycemic threshold to 60 mg/dL and the prediction horizon to 30 min. Moreover, the method by Dassau et al. 24 predicted 91% and 100% of the hypoglycemic events 35 min and 55 min ahead, respectively, with a threshold of 80 mg/dL. Although our method is evaluated under free-living conditions, it compares favorably with them regarding sensitivity and lead times for both horizons, while showing a much better precision.
The proposed method has the potential to be applied in everyday life conditions given that it is adequately accurate, achieves rapid response times, and is not intrusive. Moreover, it has been designed to be fully automatic for potential use in smart mobile devices, but this could only be feasible should we have access to the CGM data in real time, something that is not available in current CGM devices. To ensure its proper and reliable operation, the patient should record systematically the food and insulin intakes and wear the physical activity monitor. An activity monitor does not constraint the usability of the method because today there are light, comfortable, and discreet devices that accurately track daily physical activities. Moreover, the number and timing of the CGM sensor calibrations inevitably affect the quality of the predictions. Therefore, such predictions are only reliable if the CGM device is suitably calibrated, whereas nocturnal predictions should be interpreted with caution.
One crucial issue in machine learning techniques, when applied to real and dynamic problems, is that they need frequent retraining so as to reflect the most recent state of the examined system. Thus, the rate of the SVR model updating and the optimal observation period required for data collection constitute some issues under examination. An improvement of the proposed approach could be the use of fuzzy logic for the definition of hypoglycemic events in place of the sharp threshold of 70 mg/dL. Moreover, additional descriptive characteristics could be devised for summarizing the daily physical activity (e.g., number, intensity, and duration of exercise events, etc.) for nocturnal hypoglycemic event prediction considering that even a simplified input had a significant effect. Nevertheless, the potential incorporation of the proposed method either into a CGM system or into a smartphone as a personal diabetes management system necessitates an extensive clinical validation.
Conclusions
In this work, we presented a study on the prediction of nocturnal and diurnal hypoglycemic events in type 1 diabetes based on real-life data. For the first time, the problem was treated with the SVR technique, and a detailed comparison was presented with the MLP and GP techniques. We demonstrated that the prediction of nocturnal hypoglycemic events becomes more accurate for all techniques when HAAF-related factors are additionally considered. By increasing the glucose history at night, we obtained considerably lower delays between the predicted and the actual glucose signal. Regarding the diurnal events, the SVR predictions are highly accurate; however, the introduction of physical activity worsens SVR performance but not MLP and GP predictions. Nevertheless, further evaluation of the proposed method is needed in order to draw accurate and safe conclusions that can be applied to the therapeutic procedure of type 1 diabetes.
Footnotes
Acknowledgments
This work was supported in part by the European Commission Project METABO “Controlling Metabolic Diseases Related to Metabolic Disorders,” FP7-ICT-2007-1-216270.
Author Disclosure Statement
No competing financial interests exist.