
Abstract
Background:
Hypoglycemia is a potentially fatal condition. Continuous glucose monitoring (CGM) has the potential to detect hypoglycemia in real time and thereby reduce time in hypoglycemia and avoid any further decline in blood glucose level. However, CGM is inaccurate and shows a substantial number of cases in which the hypoglycemic event is not detected by the CGM. The aim of this study was to develop a pattern classification model to optimize real-time hypoglycemia detection.
Materials and Methods:
Features such as time since last insulin injection and linear regression, kurtosis, and skewness of the CGM signal in different time intervals were extracted from data of 10 male subjects experiencing 17 insulin-induced hypoglycemic events in an experimental setting. Nondiscriminative features were eliminated with SEPCOR and forward selection. The feature combinations were used in a Support Vector Machine model and the performance assessed by sample-based sensitivity and specificity and event-based sensitivity and number of false-positives.
Results:
The best model was composed by using seven features and was able to detect 17 of 17 hypoglycemic events with one false-positive compared with 12 of 17 hypoglycemic events with zero false-positives for the CGM alone. Lead-time was 14 min and 0 min for the model and the CGM alone, respectively.
Conclusions:
This optimized real-time hypoglycemia detection provides a unique approach for the diabetes patient to reduce time in hypoglycemia and learn about patterns in glucose excursions. Although these results are promising, the model needs to be validated on CGM data from patients with spontaneous hypoglycemic events.
Introduction
Therefore, real-time detection of hypoglycemia is an important goal of optimizing diabetes therapy. Not only is real-time hypoglycemia detection a help for people with hypoglycemia unawareness and nocturnal hypoglycemia, but also learning about glucose patterns and excursions is a very important step in optimal diabetes therapy. 5 The traditional self-monitoring of blood glucose (SMBG) using the finger stick method only gives a limited number of readings. With the relatively short duration of hypoglycemic events, SMBG is unlikely to detect hypoglycemia. In contrast, relatively new continuous glucose monitoring (CGM) devices, which measure interstitial glucose and produce a reading typically every 5 min, has potential as a method for detecting hypoglycemia. 6 –8 Unfortunately, CGM is inaccurate in the hypoglycemic range, with too many hypoglycemic events confirmed by the SMBG but not the CGM. 9 –11 Research has tried to deal with this inaccuracy through the development and optimization of CGM recalibration algorithms. However, the state-of-the-art recalibration algorithms are typically based on simple linear regression models, which are limited in their ability to assess the complex dynamics between interstitial glucose and plasma glucose (PG). 12 –17 On the other hand, pattern classification models—machine learning classification approaches that are flexible enough to consider linear as well as nonlinear relationships—have been applied with success to improve retrospective hypoglycemia detection in professional CGM. 18 These models have not yet been applied to real-time hypoglycemia.
The aim of this study, therefore, was to develop and evaluate the performance of a pattern classification model for real-time detection of hypoglycemia in CGM data.
Materials and Methods
Subjects
The study population consisted of adults with type 1 diabetes (sample size n=10; all male; age, 44±15 years; body mass index, 23.8±1.4 kg/m2; diabetes duration, 18.2±13.8 years; daily insulin dose, 40±10.7 U) recruited from the Steno Diabetes Center, Gentofte, Denmark. There were no incidences of celiac disease or lipohypertrophy, but 30% of the participants had impaired hypoglycemia awareness assessed by a standardized questionnaire. 19 Each subject was studied in two repeated experimental sessions. In each session, hypoglycemia was induced 2 h after the start of monitoring with an injection of insulin aspart (NovoRapid®; Novo Nordisk A/S, Bagsværd, Denmark). The bolus size was determined by an experienced diabetologist assessing PG at injection time and normal daily insulin dose. When subjects reached a PG nadir of 2.5 mmol/L (45 mg/dL), they were given oral juice to recover. During the sessions the subjects wore a CGM device (Guardian RT®; Minimed Inc., Northridge, CA) producing a reading every 5 min, which was calibrated by a nurse as indicated by the device. Furthermore, capillary blood samples were drawn every 10 min or more frequently, in the period from insulin injection, during PG nadir and to a PG rise above 3.9 mmol/L (70 mg/dL), but otherwise approximately every 30–60 min. The samples were analyzed with a HemoCue® Glucose 201+ glucose analyzer (HemoCue, Ängleholm, Sweden).
Written informed consent was obtained from all subjects, and the study protocol was approved by the Regional Ethics Committee.
Data processing
In total, 20 datasets, which include CGM, PG readings, and insulin information, were obtained from the 20 sessions. Three datasets were excluded because of CGM dropouts of more than 15 min or hypoglycemic events before the insulin injection, leaving a total of 17 includable datasets from 10 subjects. In the few CGM dropouts of 15 min or less, data were reconstructed using spline interpolation. For classification evaluation purposes, a PG value for each CGM reading was generated by resampling PG using spline interpolation. A “hypoglycemic event” was defined as at least one PG reading below 3.9 mmol/L (70 mg/dL). 19 –23 A subsequent minimum period of 30 min with no PG readings below 3.9 mmol/L (70 mg/dL) was defined as the end of the event.
Pattern classification
We developed a pattern classification approach to classify CGM readings into one of the two classes: being within hypoglycemia, or not, as described above. The classifications were evaluated, based on the concurrent PG readings. The approach was based on extracting “features” from the CGM data and insulin information and applying a machine learning classification model, using those features that produce the best model fit. Based on literature, 18,20 several features derived from parameters in different time intervals were suggested (Table 1). This systematic approach resulted in a large feature dimension, which had to be reduced. The fast SEPCOR algorithm 21 was used to make an initial feature elimination of each feature separately, and a more precise elimination was performed testing feature combinations with forward selection. 22 SEPCOR listed each of the 762 features by a descending variability measure, which is the difference of the means of each class divided by the sum of the variances of each class. Features with variability measure below 0.1 were eliminated. Of the remaining features, the top feature was correlated with the rest, and if the correlation exceeded 0.4, the feature with lower variability measure was eliminated. In the next iteration the second top feature was correlated with each feature below, and if 0.4 was exceeded the feature below was eliminated, and so on. This correlation procedure continued for all the remaining features below. The remaining features after SEPCOR elimination were with the forward selection tested in combinations using the Support Vector Machine (SVM) model. In SVM a discriminant function is calculated from a training dataset. From this discriminant function it is possible to decide whether a test sample belongs to either of the two classes. SVM in combination with one or more features was defined as a model. To avoid overfitting, leave-one-subject-out cross-validation was applied during training of these models. In Layer 1 of forward selection, each feature was tested individually, and the best model (largest area under the curve [AUC] for the receiver operating characteristics [ROC] curve) was picked out. In Layer 2, the feature of the best model from Layer 1 was tested together with each of the remaining features in new models, and the best model was picked out, and so on. These iterations continued until the model and thereby the feature combination with highest ROC-AUC was found. An overview of this pattern classification approach can be seen in Figure 1. All software was developed in MATLAB® (version R2011b; MathWorks, Natick, MA).
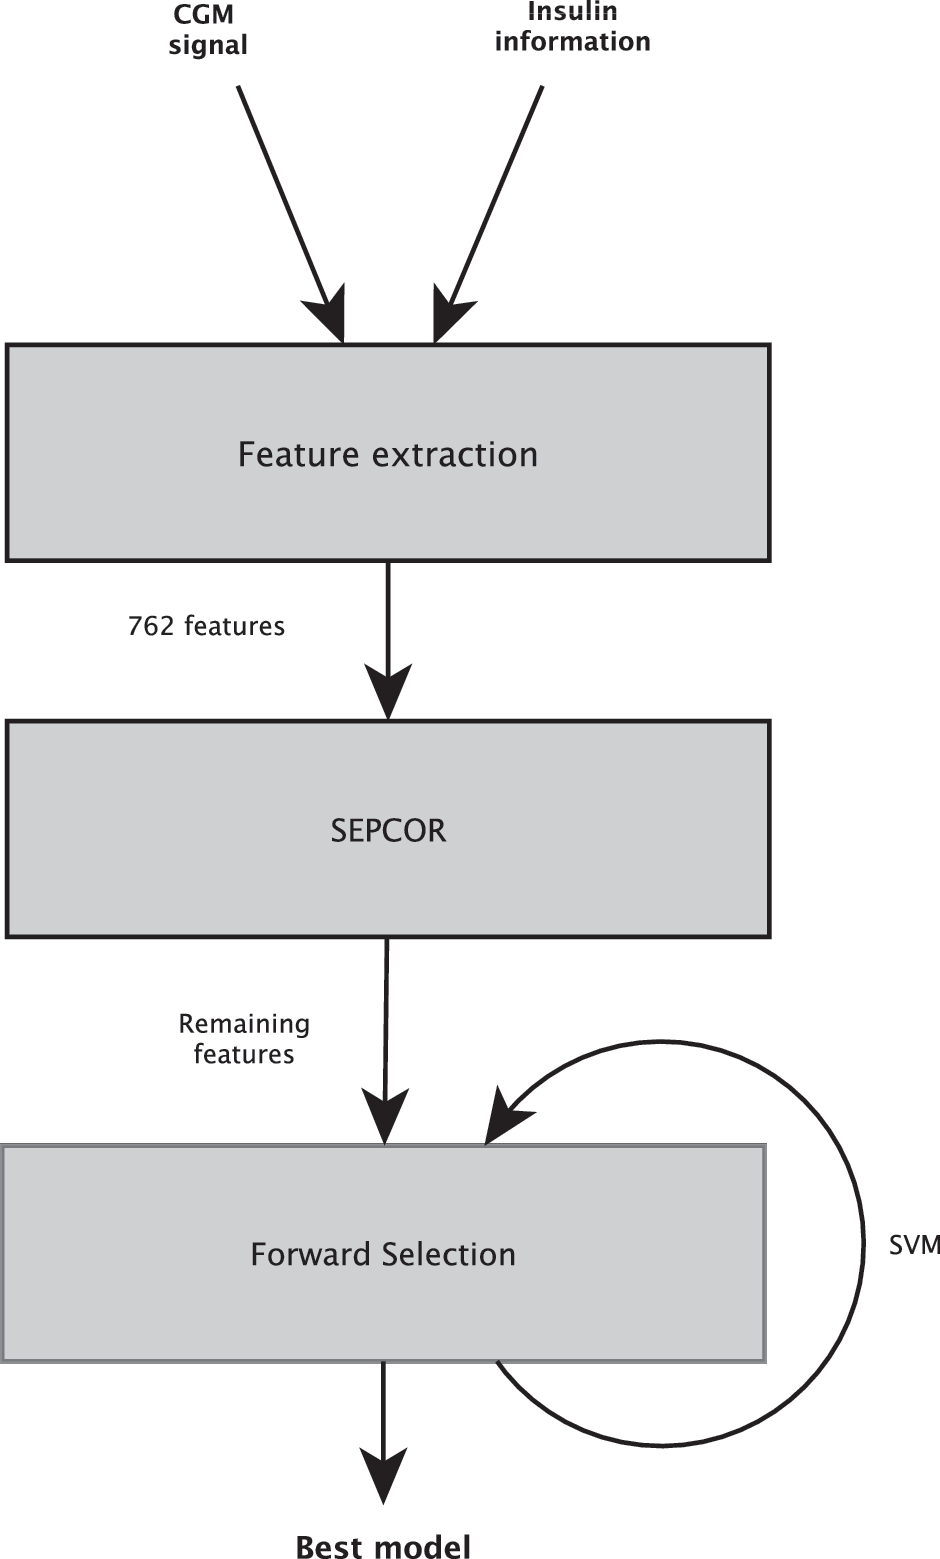
Illustration of how the concepts of pattern classification were put together to identify a model capable of detecting hypoglycemia. (1) Features were extracted from the continuous glucose monitoring (CGM) signal and insulin information. (2) SEPCOR was used to make an initial feature elimination. (3) Forward selection in combination with the Support Vector Machine (SVM) model was used to find the best feature combination of the remaining features after the SEPCOR elimination and thereby the best model.
Because linear regression, skewness, and kurtosis are all tested in 253 different time intervals, in total 762 features exist.
“Multiple intervals” means that the statistical measure is calculated in intervals from t=−120, −115, −110,…, 0 min with a signal processing window size of w=15, 20, 25,…, 120 min. Note that t+w is <0.
Performance
The classification performance was evaluated by sample-based sensitivity and specificity. Each CGM reading was classified, and the truth of each classification was defined as the concurrent PG reading. With this definition, it was possible to find the number of true-positive, false-negative, true-negative, and false-positive (FP) results and thereby calculate the sample-based sensitivity and specificity. In forward selection, the ROC curve was calculated for each feature combination. The ROC-AUC was used as the performance measure for that model. The performance of the CGM readings alone (without the pattern classification model applied to its data) was also evaluated with sample-based sensitivity and specificity based on PG readings.
The utility of the best model (found by above measures) in practice was evaluated using event-based sensitivity and specificity. However, it was only possible to derive event-based true-positive, FP, and false-negative. True-positive was defined as a minimum of four consecutive CGM readings classified as hypoglycemic, 23 where at least one classification was true. FP was defined as a minimum of four consecutive CGM readings classified as hypoglycemic, but with no true classifications. False-negative was defined as a hypoglycemic event with no CGM readings classified hypoglycemic. It was not possible to define true-negative because it is impossible to interpret time without hypoglycemia as event-free. Therefore, as a surrogate for event-based specificity we used the number of FPs in the total sampling period. A curve is presented for the utility of the best model, with number of FPs on the first axis in relation to sensitivity on the second axis. An additional measure for the degree of utility was to calculate lead-time defined as the time between detection of a hypoglycemic event and the hypoglycemic nadir based on PG readings. Finally, mean absolute relative difference and the mean difference between the PG and CGM reading at the PG nadir were calculated and are presented.
The ability of the CGM device alone to detect hypoglycemic events was evaluated by defining a true detected hypoglycemic event as at least one CGM reading below 3.9 mmol/L (70 mg/dL) during the hypoglycemic event. The lead-time of the CGM alone was defined as the time between the first CGM reading below 3.9 mmol/L (70 mg/dL) and the hypoglycemic nadir based on PG readings.
Results
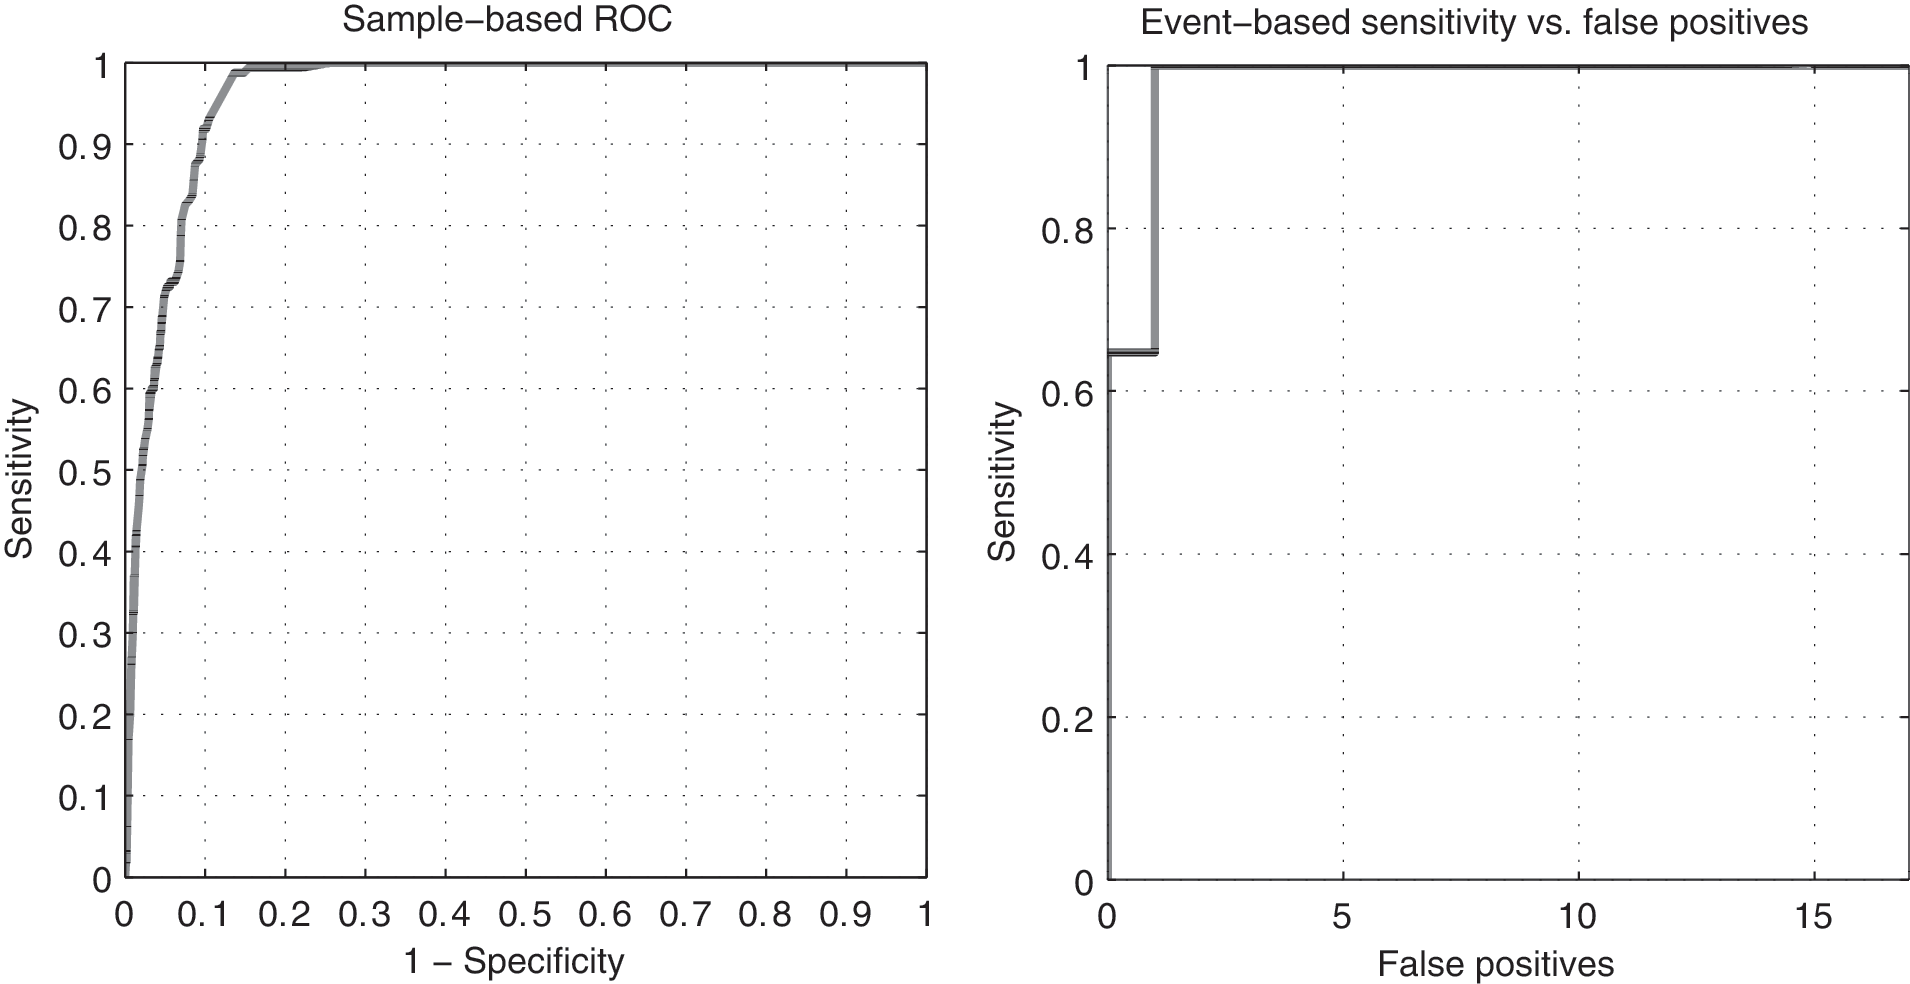
There were in total 17 hypoglycemic events in the 17 datasets. Characteristics of the 17 hypoglycemic events can be seen in Table 2. SEPCOR eliminated 748 features, which resulted in 14 remaining features. Thereafter, forward selection eliminated seven features, leaving a total of seven features. These seven features compose the best model and are F Lin.reg.[–50,0], F d0CGM, F Skew.[–35,–20], F Kurt.[–60,–40], F Skew.[–100,–5], F Kurt.[–75,–50], and F Kurt.[–50,–25] (see Table 1 for explanation of the features). The ROC-AUC with this feature combination was 0.962. The performance of this pattern classification model can be seen in Figure 2 and Table 3. With the presented model it was possible to detect all 17 hypoglycemic events with only one FP. In comparison, the CGM alone only detected 12 of the 17 events but with no FP. Figure 3 shows an example of the model's ability to detect hypoglycemia. In this session, the subject experienced one hypoglycemic event, which is detected by the model but not detected by the CGM alone.

The subject experienced one hypoglycemia episode during this session, which is detected by the model, whereas the continuous glucose monitoring (CGM) is far from detecting it. SMBG, self-monitoring of blood glucose.
Data are mean (±SD; minimum, maximum) value, number, or percentage. The last parameter is the mean difference of the continuous glucose monitoring (CGM) reading and plasma glucose (PG) reading at PG nadir (lowest PG value).
From insulin injection to plasma glucose crossing 3.9 mmol/L (70 mg/dL).
From PG dropping below 3.9 mmol/L (70 mg/dL) to rising above 3.9 mmol/L (70 mg/dL).
MARD, mean absolute relative difference.
The addition of the model increases the number of detected hypoglycemic events by almost 30%, while adding only one false-positive (FP). Furthermore, lead-time is increased by 14 min.
CGM, continuous glucose monitoring; FN, false-negative; TN, true-negative; TP, true-positive.
Discussion
Our model provides a means of detecting hypoglycemic events in real time. This is particularly useful for people with type 1 diabetes experiencing nocturnal hypoglycemia or people with type 1 diabetes and hypoglycemia unawareness. The model uses relatively few features from the CGM signal to classify each CGM reading as hypoglycemic or not. From the seven features, F Lin.reg.[−50,0], linear regression of the previous 50 min of CGM readings was most discriminative. This is plausible because a decline in blood glucose always precedes hypoglycemia. Furthermore, F d0CGM, the current CGM reading, is a good feature, which also makes sense because there, despite the CGM inaccuracy, is a high correlation between CGM and SMBG readings. Skewness and kurtosis of CGM readings in intervals of 15–95 min are less obvious features. However, the shape of the CGM signal in these intervals is likely to contain information on hypoglycemia, which could explain why these features were discriminative. The seven best features did not contain information about insulin, which is surprising because we expected that insulin, especially in this study, would be highly correlated with glucose. However, only time since last insulin injection was used as a feature, and other derived features might contain more information. In a study with “real-life” hypoglycemic events and multiple insulin injections or insulin pump, features such as insulin-on-board and AUC should be extracted and tested. The best features did not contain the first derivative (F d1CGM) either. The first derivative is sensitive to noise because of the estimation method used, which might explain why it was eliminated. More sophisticated first derivative estimators like Savitzky–Golay smoothing filters could be applied, but they extract information from the signal based on regression, which is already part of F Lin.reg..
The sample-based sensitivity and specificity of the CGM device in this study were calculated to 33% and 98%, respectively. Literature reports CGM sensitivities of 38–67% with similar specificities. 24 –26 A part of the incongruence may be explained by different calibration procedures. 9 Furthermore, the characteristics of the data in this study are different from other studies: in this study, hypoglycemia was insulin-induced, whereas hypoglycemia might be spontaneous in other studies. Insulin-induced hypoglycemic events may exhibit more pronounced rates of decline in interstitial glucose than spontaneous events, 27 which with the presented model make them easier to detect. On the other hand, the insulin-induced hypoglycemic events may have shorter duration than spontaneous events (due to the recovery at 2.5 mmol/L=45 mg/dL), which make them harder to detect (see Table 2 for duration). Another point is that fast-occurring hypoglycemic events are difficult for the CGM to detect, because of the blood–interstitial delay, thus making them the important events to detect for the model. In summary, the generalizability of our results is limited because of our experimental framework, and natural follow-up to this study would be one in which the same modeling approach is applied to and evaluated on free-living typical days of persons with type 1 diabetes.
The best pattern classification model presented in this article compared with the CGM alone improved the sample-based sensitivity with 48% points, whereas the specificity was reduced with 5% points. The model was able to detect 17 of 17 hypoglycemic events with only one FP, whereas the CGM alone detected 12 of 17 events with no false FP. This is considered a significant improvement, especially because the incongruence between CGM and PG readings varies significantly with a minimum difference of 0.2 mmol/L (3.6 mg/dL) and a maximum difference of 4.5 mmol/L (81 mg/dL), and the mean absolute relative difference is high. Moreover, the lead-time was increased with 14 min, which would enable the user to act faster and thereby reduce time in hypoglycemia. In a recent study by Keenan et al., 16 the sample-based improvement of sensitivity was 27% points (vs. 48% points in this study) with a reduction of 2% points in specificity (vs. 5% points in this study). In another study with insulin-induced hypoglycemia, Eren-Oruklu et al. 28 reported an event-based sensitivity of 89% (50/54 events) with six FP. The sensitivity is better in this study, and the number of FP is less. However, the apparently fewer number of FP should be interpreted with caution, in light of our smaller study population; also, monitoring over a longer time may increase the number of FP.
These promising results suggest that it is possible to utilize pattern classification to successfully detect hypoglycemia. The models could easily be implemented in the current and future CGM systems, therefore making them very flexible. Although such rule-based systems are objective and in accordance with manual data interpretation by clinicians, it remains a simplified and generalized approach to the art of medicine.
Conclusions
The pattern classification model presented in this study provides a unique approach to optimize real-time detection of hypoglycemia in CGM data. The model compensates for the CGM inaccuracy by assessing several features from the CGM signal and converts this information into a decision about the presence of hypoglycemia. Although the CGM inaccuracy is inconsistent, the model detects all hypoglycemic events in the current dataset and only produces one FP. An implementation of this model, for example, in existing CGM devices would be a tremendous help for people with type 1 diabetes who have hypoglycemia unawareness or nocturnal events, not only to shorten the duration of the events, but also to learn about their glycemic pattern in order to adjust glucose-regulating factors, such as insulin, diet, and exercise. However, the pattern classification model was developed in an experimental setting and needs to be trained and tested on data from people with type 1 diabetes under typical everyday conditions.
Footnotes
Acknowledgments
This work was supported by funding from Novo Nordisk A/S.
Author Disclosure Statement
No competing financial interests exist.