




Abstract
Background:
Insulin resistance (IR) and hyperinsulinemia as well as obesity play a key role in the metabolic syndrome (MetS), type 2 diabetes (T2D), and associated cardiovascular disease. Unfortunately, IR and hyperinsulinemia are often diagnosed late (i.e., when the MetS is already clinically evident). An earlier diagnosis of IR would be desirable to reduce its clinical consequences, in particular in view of the increasing prevalence of obesity and diabetes conditions. For this purpose, we developed a mathematical model capable of detecting early onset of IR through small variations of insulin sensitivity, glucose effectiveness, and first- or second-phase responses.
Materials and Methods:
Murine models provide controlled conditions to study various stages of IR. Various degrees of hypercholesterolemia, obesity, IR, and atherosclerosis were induced in low-density lipoprotein receptor-deficient mice by feeding them cholesterol- or sucrose-rich diets. IR was assessed by oral glucose tolerance tests. Controls included animals fed exclusively, or switched back to, regular chow. A nonlinear mathematical model of the order of 5 was developed by refining Bergman's “Minimal Model” and then applied to experimental data.
Results:
Different metabolic constellations consistently corresponded to specific and close-meshed changes in model parameters. Reduced second-phase glucose sensitivity characterized an early impaired glucose tolerance. Later stages showed an increased first-phase glucose sensitivity compensating for decreased insulin sensitivity. Finally, T2D was associated with both first- and second-phase sensitivities close to zero.
Conclusions:
The new mathematical model detected various insulin-sensitive or -resistant metabolic stages of IR. It can therefore be implemented for quantitative metabolic risk assessment and may be of therapeutic value by anticipating the start of therapeutic interventions.
Introduction
Depending on ethnicity, genetic, and lifestyle risks, 30–40% of the population of developed countries develops MetS. 1 Although the importance of glucose intolerance, dyslipidemia, obesity, and hypertension is well recognized, various definitions of the MetS exist. 1 –6 For example, the World Health Organization and the European Group for the Study of Insulin Resistance include IR among defining central criteria; in contrast, the International Diabetes Foundation uses central obesity as a diagnostic criterion. 1 –6
IR and hyperinsulinemia are strongly linked to an early onset of T2D, obesity, dyslipidemia, and endothelial dysfunction, as well as CVD. 3,7 Initially, an insufficient effect of insulin, resulting from either insufficient insulin secretion or insufficient insulin effect at the cellular level, is met by a compensatory increase in insulin secretion, and plasma glucose levels remain in the euglycemic range (Figure 1a). Prolonged excessive demand for insulin, associated, for example, with obesity, often leads to decreasing function of pancreatic β-cells, increasing hyperglycemia, and eventually manifest T2D. The diagnostic criteria for the final stages of IR and T2D in humans are well established. 5,6

Development of insulin resistance, overview of murine studies, and optimization of the mathematical model.
Dyslipidemic conditions, especially increased levels of free fatty acids, also contribute to IR. Free fatty acids result mainly from adipose tissues because of the lipolysis of triglyceride-enriched lipoproteins. 1 –4,7 Conversely, increasing IR generates more free fatty acids, mainly by increasing lipolysis, and thus worsens dyslipidemic conditions. 1 –4,7 Therefore, we used an in vivo model susceptible to both diet-induced IR and dyslipidemia.
Because IR is initially clinically silent, it may remain undetected while already exerting pathogenic effects relevant for diabetes and CVD. The main difficulty in establishing a mathematical model capable of detecting the onset of IR lies in the lack of well-defined physiological correlates of early-stage IR that might be used for a noninvasive diagnosis.
In both humans and mice, insulin glucose homeostasis is usually first assessed by measurements of fasting or fed plasma glucose and insulin respectively C-peptide. A widely used diagnostic follow-up procedure is the oral glucose tolerance test (OGTT), which measures glucose and insulin responses to a defined glucose bolus administered orally. Although OGTTs can detect reduced insulin secretion, conclusive evidence for IR (as opposed to pancreatic β-cell damage) requires hyperinsulinemic euglycemic clamps. 8,9 Other assays include insulin tolerance tests and insulin suppression tests. Many of these are invasive. Mathematical models permitting extraction of additional information on the onset of IR from OGTTs would therefore be of value, in particular if they predict later T2D.
We here report the development of a novel mathematical model of insulin glucose homeostasis based on Bergman's “Minimal Model,” which provides measures of glucose effectiveness 1/T G and insulin sensitivity kX . To improve modeling of the physiological first-phase insulin response, we introduced the respective first- and second-phase parameters k G1 and k G2 into the equation and carried out data analysis in two sequential steps. The new model was first validated with the help of a human reference dataset based on intravenous glucose tolerance tests (IVGTTs). 10 It was then applied to data obtained by performing OGTTs on five groups of low-density lipoprotein receptor (LDLR)-deficient (LDLR −/−) mice, an established model of hypercholesterolemia, insulin resistance, diet-induced MetS, and atherosclerosis. 11 –20 In these murine groups, various degrees of IR and stages of the MetS were induced by feeding them either regular rodent chow or an obesogenic high-fat, high-cholesterol diet for various periods. We also switched one group back to regular chow, to mimic the return to a healthy diet after onset of the MetS. We thus induced various metabolic constellations resulting from the underlying genetic defect of LDLR −/− mice or the various dietary regimens. We then characterized these constellations by conventional clinical parameters and by using our mathematical model, in the hope that the latter would indicate early stages of the MetS and thus permit early diagnosis of the pathogenic process and earlier therapy. Preliminary data from this study have been presented previously in abstract form. 21
Materials and Methods
Murine model of the MetS
In order to mimic different stages of human IR, an established murine model of atherosclerosis and T2D was used. 11 –20 Five groups of age-matched male LDLR −/− mice (n=43) were fed normal rodent chow for 74 days, at which time an OGTT was performed on Group A. Group B was fed an established obesogenic and atherogenic diet containing 1.25% cholesterol and 21% fat (Teklad TD96121; Harlan, Indianapolis, IN) for 109 days, and an OGTT was performed after 78 days. Group C followed the same regimen but was then switched back to regular chow to detect the benefit of a low-risk diet after the onset of IR. Groups D and E were controls fed regular chow. A schematic overview of experimental groups is provided in Figure 1b.
OGTTs were performed after 16 h of fasting. Twenty-five microliters of blood was collected from the retroorbital plexus of isofluorane-anesthetized mice prior to as well as 15, 30, 60, 90, and 120 min after gavaging with a sterile 10% glucose solution (1.5 mL/kg of body weight). Plasma glucose levels were determined using glucose test strips (Devine Medical Supplies, Santa Fe Springs, CA) and a glucometer (MediSense; Abbott, Chicago, IL) four times a day. Plasma insulin level was determined by an ultrasensitive mouse enzyme-linked immunosorbent assay (catalog number 10-1150-01; Mercodia, Uppsala, Sweden).
To assess metabolic changes by the criteria used in humans, the homeostasis assessment model of IR (HOMA-IR) index was calculated from fasting insulin I
0 and fasting glucose G
0:
Mathematical model of glucose–insulin homeostasis
Any mathematical model of the glucose–insulin homeostasis must reflect the complex metabolic changes observed in vivo. One of the first models of the glucose insulin homeostasis was the “VT-model,” 22 also known as the “Minimal Model.” 23 It provides established parameters with a physiological meaning, such as glucose efficiency and insulin sensitivity. We previously used the Minimal Model 24 –26 and now expanded it as follows.
The Minimal Model considers three compartments: the plasma glucose G(t), the plasma insulin I(t), and the interstitial insulin X(t), which summarizes insulin in non-plasma tissues and is also called the remote insulin compartment according to Bergman et al.
23
The change of plasma glucose G(t) is driven by an internal effectiveness (with time constant T
G) and a nonlinear expression that is controlled by the current interstitial insulin X(t):
The reciprocal time constant 1/T G is often interpreted as “glucose effectiveness,” and the gain kX is known as “insulin sensitivity” of the glucose system. 27 To simulate the dynamic situation of an OGTT, we started the simulation at t=0, when exogenously administered glucose reaches the plasma. Hence, in our model an initial plasma glucose concentration G 0 is assumed that is already elevated compared with its basal level: G 0>G basal. Note that this is not identical to the glucose measurement at “T0” of an OGTT, which denotes the basal equilibrium before glucose administration.
The change of plasma insulin I(t) is modeled in a similar way. An internal clearance (with time constant T
I) and an external input v(t) are distinguished:
Here, the basal insulin concentration is used as initial condition I 0=I basal because no external insulin excitation is applied, and the insulin responses are presumed to lag behind the initial glucose increase. The external input v(t) is considered to be linear. The input v(t) must be controlled by the plasma glucose G(t). Bergman et al. 22,23 suggested the time-variant function v(t)=max[0, γt(G(t)−G basal)]. From our point of view, this approach has two disadvantages: an early plasma insulin peak (for small times t) cannot be modeled, but it is observed in OGTT as a consequence of an increased plasma glucose level. Bergman et al. 22,23 solve this by assuming an initial insulin concentration I 0>I basal, but this does not correspond to the test conditions because no initial insulin is applied to the subject. Second, there is no physiological motivation for an increasing insulin reaction just because the time t increases.
To make the model more consistent with actual physiological events, we suggest differentiating between a first- and second-phase insulin reaction. The first-phase reaction is controlled by the time derivative d(ΔG(t))/dt of plasma glucose in combination with a lag element (small time constant T
1). The second-phase reaction is controlled by ΔG(t) itself again in combination with a lag element (larger time constant T
2>T
1). Both parts are weighed with gains k
G1 and k
G2 and summed up in v(t). The frequency domain transfer function is:
Hence, we introduce k G1 and k G2 as “first-phase” and “second-phase glucose sensitivity” of the insulin system, respectively. This simplifies the model approach of Grodsky, 28 who distinguished a labile (fast) and a stable (slow) insulin compartment with a threshold for insulin release. It can also be considered to be a model of the controller that regulates the insulin secretion as a function of the current plasma glucose. The use of a proportional (P) and a time derivative (D) part find its equivalent in technical PD controllers. 29
The second-order transfer function in Eq. 3 is transformed into two first-order differential equations (Eqs. 4 and 5) in the time domain. Among the infinite number of state–space representations we obtain the Jordan Canonical Form by introducing the states v
1(t) and v
2(t) according to Eq. (3). The output equation (Eq. 6) includes a feed-through term:
The third compartment for the interstitial insulin X(t) is modeled in line with Bergman et al.
22,23
As in Eq. 2, there is an internal clearance (time constant TX
) and a linear excitation that is controlled by the insulin I(t):
Because we assign the insulin sensitivity kX to Eq. 1, the state X(t) has the dimension of an insulin concentration, which seems to be more appropriate than the dimension of min−1 used by Bergman et al. 22,23
In order to obtain a state–space model
29
Equation 6 is inserted into Eq. 2, and Eqs. 1, 2, 4, 5, and 7 are summarized to a vector differential equation of the order n=5 with the state vector
Parameter identification
For parameter identification, the mathematical model is typically evaluated over the time horizon of an OGTT, which is usually 120 min. As the initial condition, a glucose excitation G
0>G
basal and a basal insulin concentration I
0=I
basal are assumed. As illustrated in Figure 1c, the model outputs for plasma glucose level G(k) and plasma insulin level I(k) are compared with the corresponding in vivo measurements G
exp(k) and I
exp(k). The deviations are weighed with w
G and w
I and assessed within an objective function that sums up the square errors over the measurements
We try to reach a balanced weighting and a dimensionless objective function J by choosing w G=(1 mg/dL)−2 and w I=(0.667 μU/mL)−2. If no measurement is available, the corresponding w G or w I is set to zero. In order to consider parameter constraints, J is set to infinity in case of forbidden parameter combinations.
An optimization algorithm has to find an optimal set of model parameters
Validation of the model with human data
As a first step to quantify the model, we followed the program of Pacini and Bergman. 10 Their values determined from a frequently sampled IVGTT were converted to define the time constants T G, T I, and TX and the gain kX . As basal values for G basal and I basal, the last measurements were taken (Table 1). In a second step, the respective time constants T 1 and T 2 for the first- and second-phase insulin response were defined in line with the step response in Grodsky, 28 and an optimization was carried out in order to identify the corresponding gains k G1 and k G2 (Table 1). In vivo measurements and in silico results of the IVGTT are shown in Figure 2. The evaluation of the objective function from Eq. 9 resulted in J=24.76, which corresponds to a maximum root mean squared error of 24.76 mg/dL for plasma glucose G(t) or of 16.51 μU/mL for plasma insulin I(t). The model obtained serves as a human reference model in the following analyses.
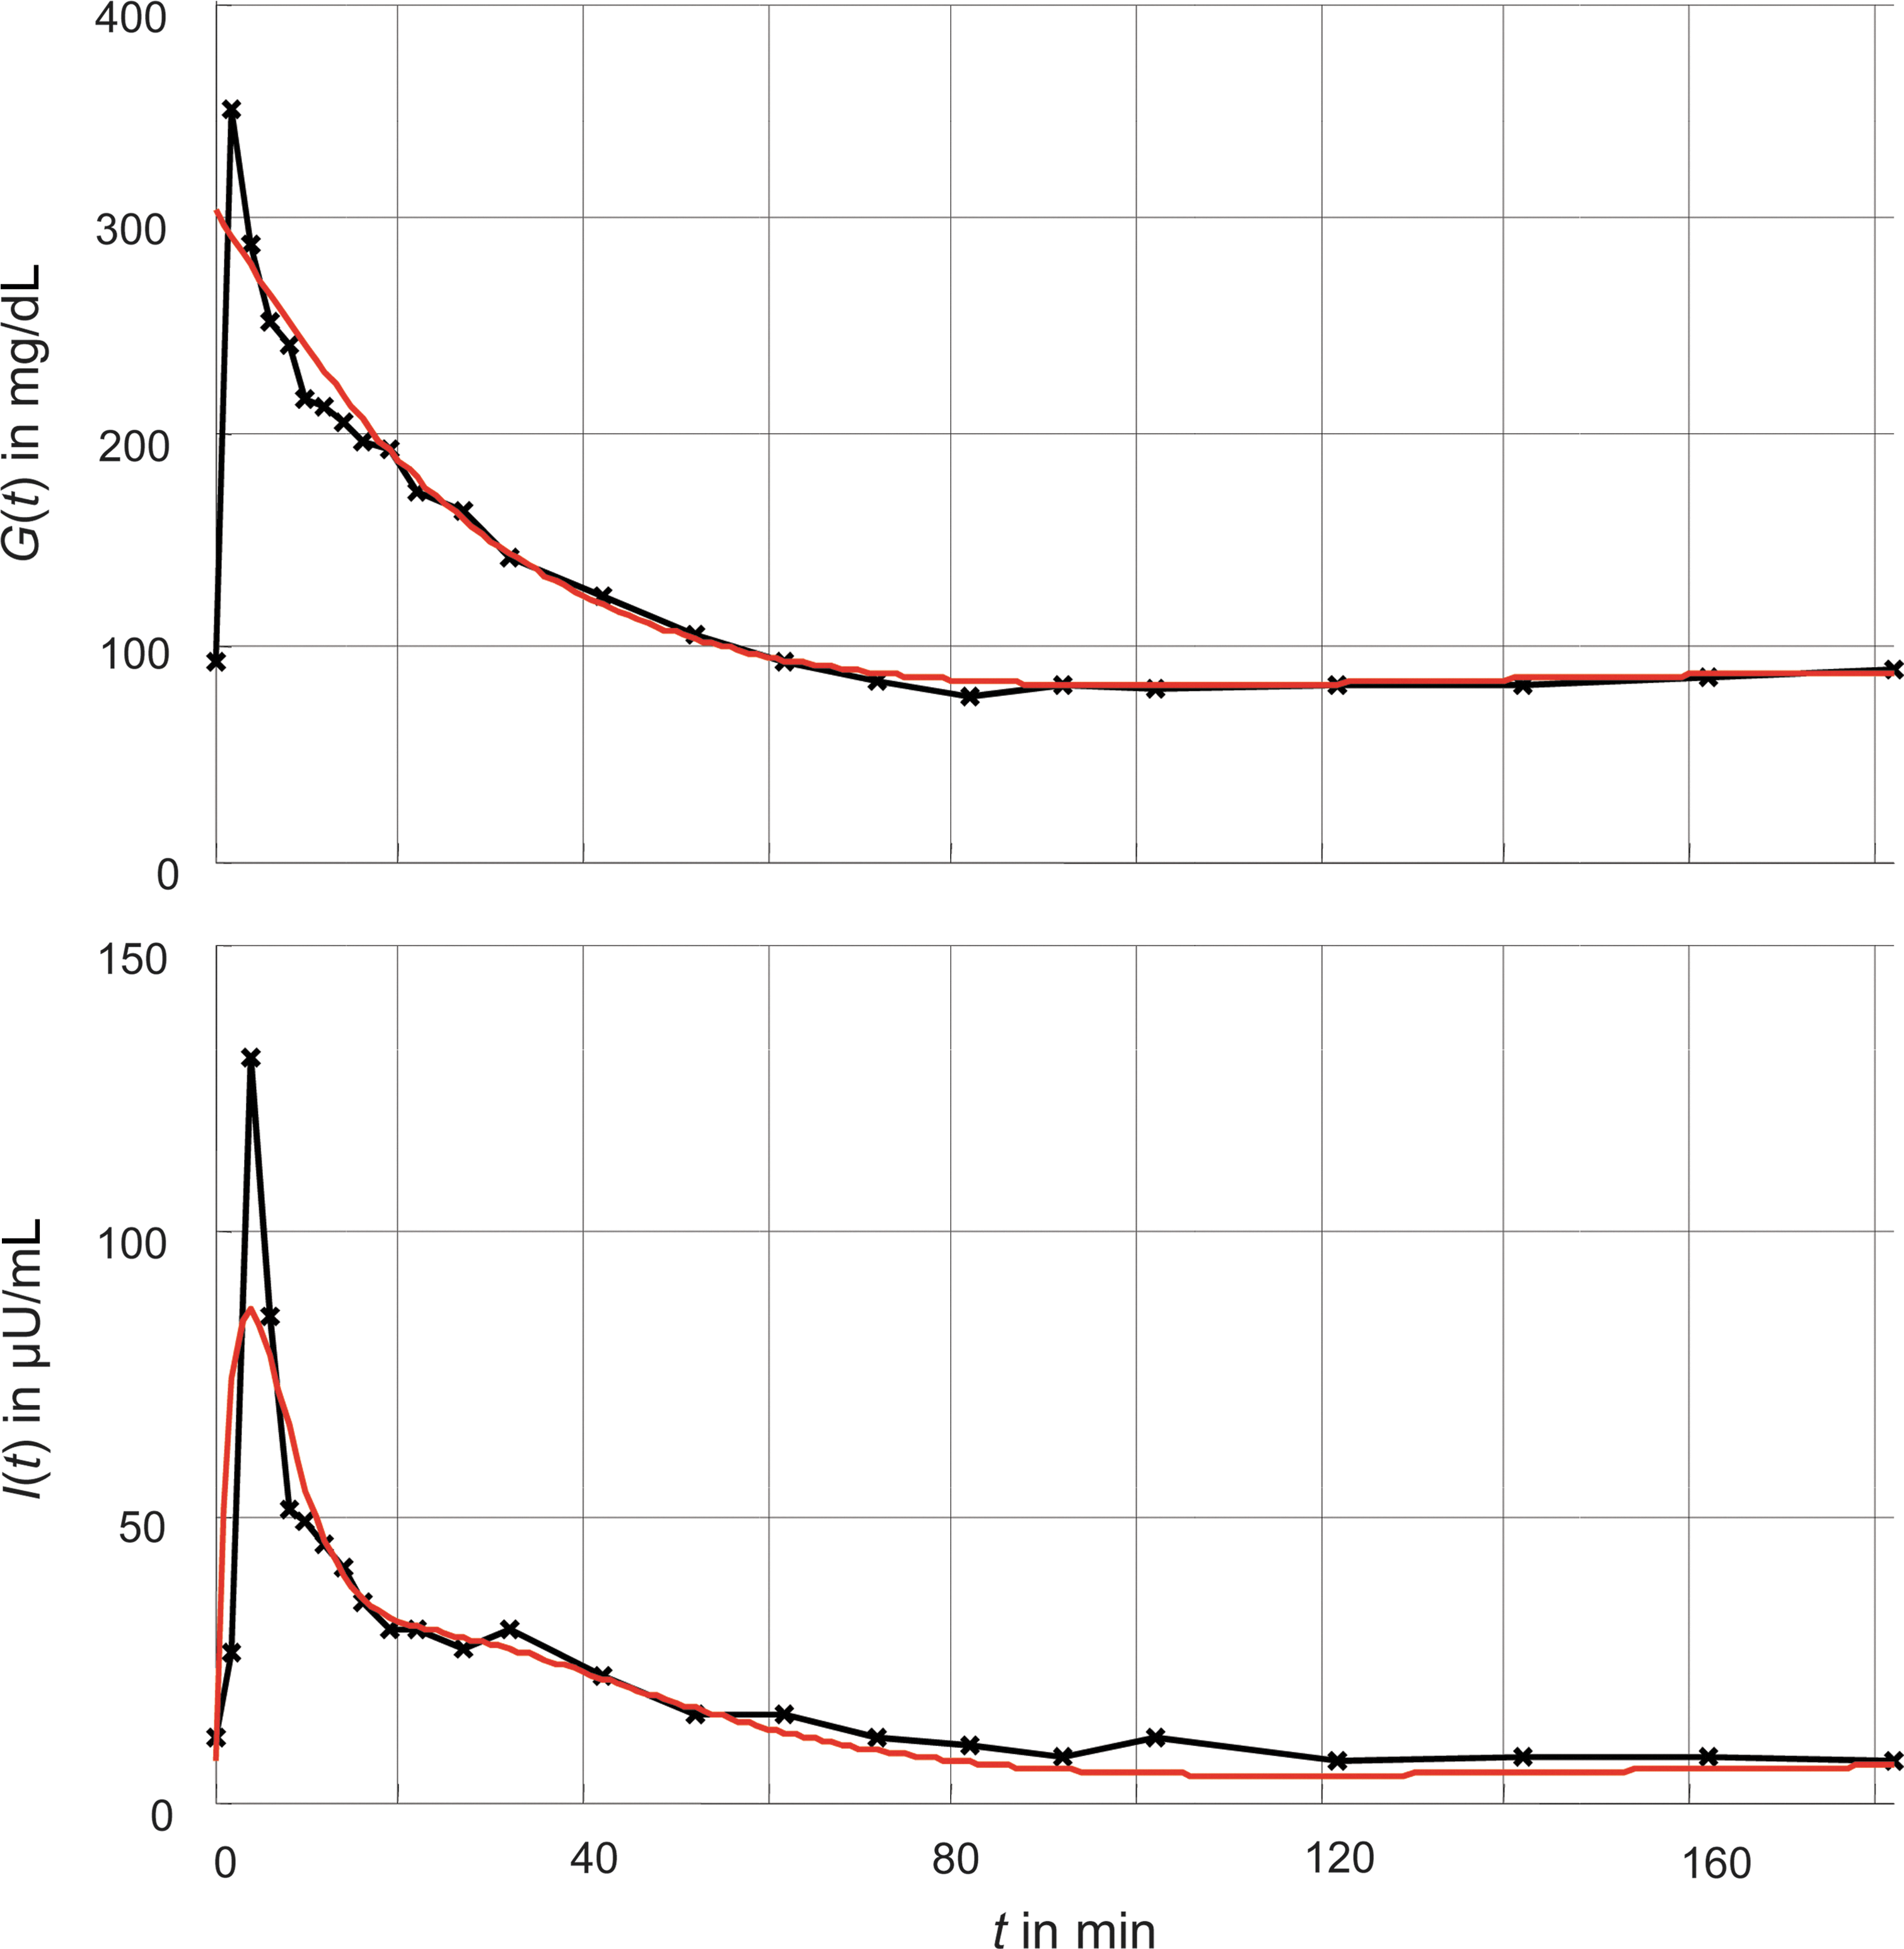
Comparison of in vivo measurements of a frequently sampled intravenous gluocse tolerance test from Pacini and Bergman
10
and its corresponding in silico simulation of our model. Color graphics available online at
Results
Murine model
Body weights, plasma cholesterol, and plasma triglyceride levels before, during, and after the obesogenic diet are summarized in Figure 3a–c. As expected, endogenous and dietary risk factors could be linked to unbalanced metabolic conditions, such as altered plasma cholesterol and triglyceride levels (compare Group B vs. Groups A and D in Fig. 3b and c). The change back to normal chow resulted in declining plasma lipids in Groups C and E but no significant changes in body weights (Fig. 3a–c).
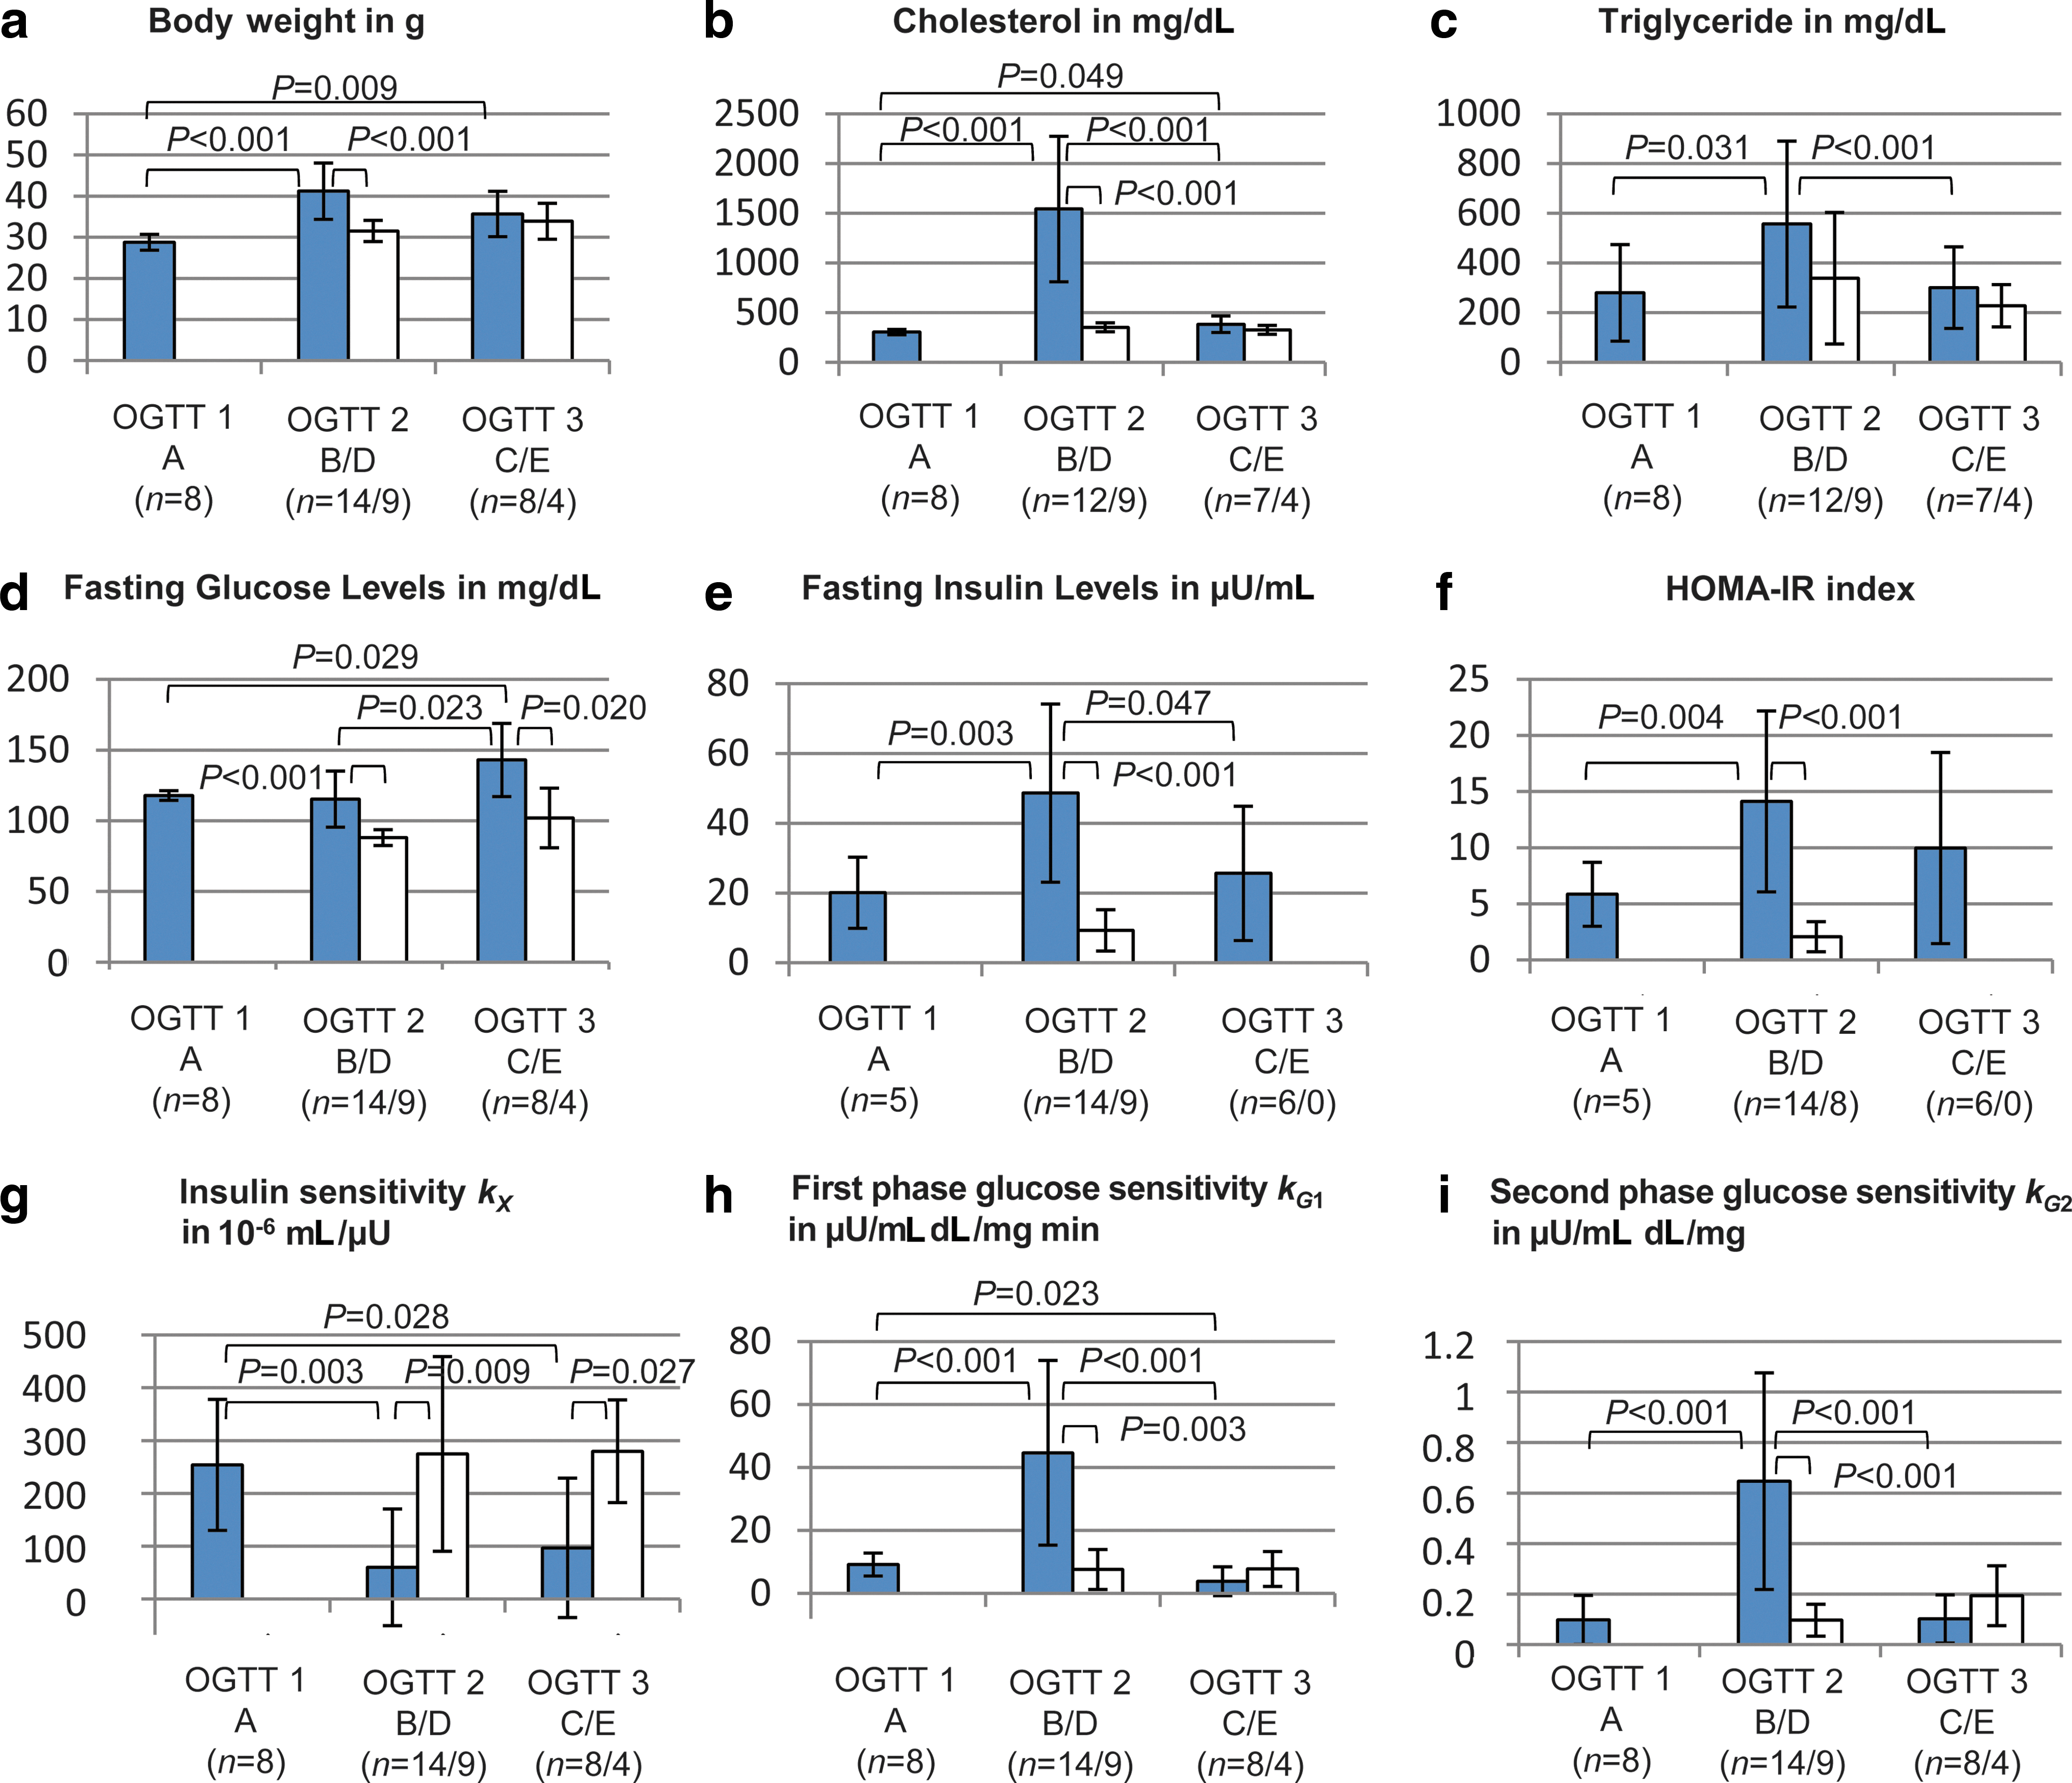
Fasting measurements are displayed in Figure 3d and e. OGTT measurements are shown in Figure 4. Several phenotypes with different degrees of IR were evident. Compared with Groups A and D, Group B showed significantly increased fasting insulin levels but no increase in fasting glucose levels. This indicates that insulin levels required to maintain euglycemia were higher than those on regular chow and that Group B had IR but did not suffer from a manifest diabetes. With the return of insulin-resistant obese mice to regular chow in Group C as well as an increasing age and persisting weight gain, insulin levels were reduced significantly compared with Group B, but glucose levels continued to increase. Thus, β-cell damage progressed irreversibly over time, and a persistent degree of IR and an onset of T2D characterize Group C.
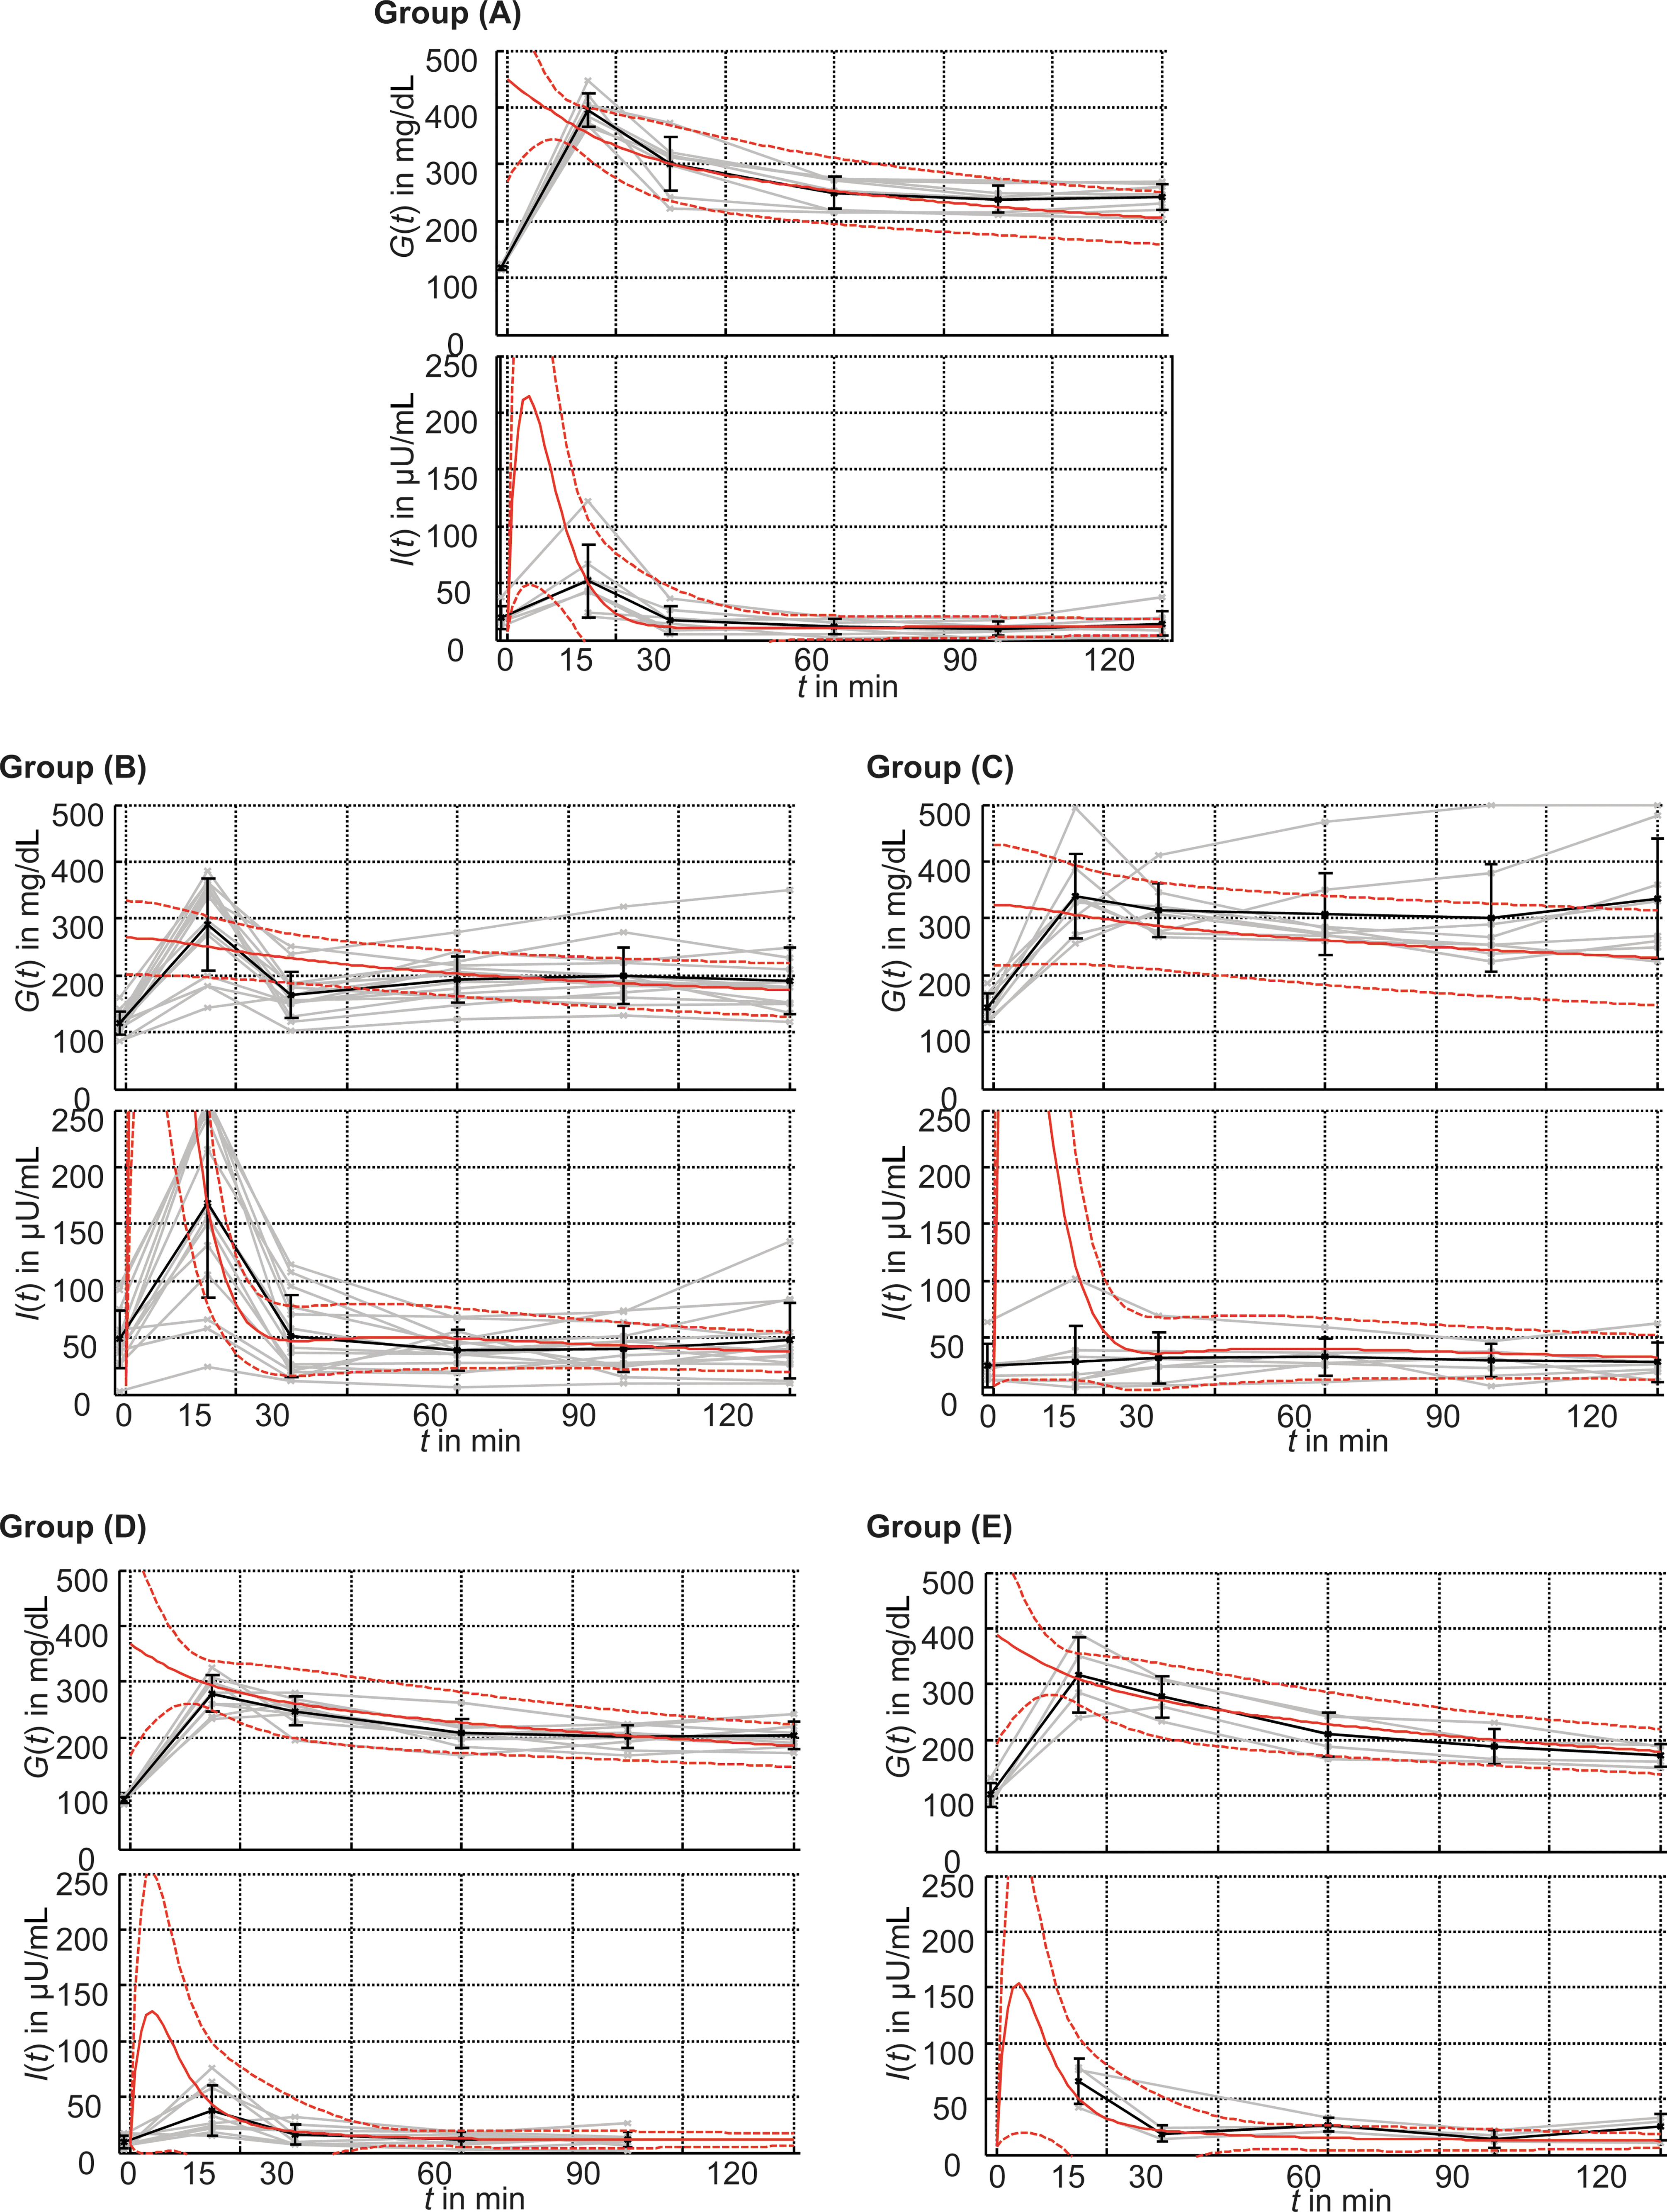
Comparison between the actual oral glucose tolerance test data of murine Groups A–E and the predictions by the mathematical model. Plasma glucose G(t) and insulin I(t) were measured before glucose administration and 15, 30, 60, 90, and 120 min thereafter. Data of individual subjects are shown in gray, and group means with SD error bars in black. Additionally, the corresponding in silico predictions are plotted. The solid line denotes the group mean; dashed lines denote the corresponding SD. Color graphics available online at
Note, however, that data of the control groups (A, D, and E) do not represent physiological levels in wild-type mice but strongly reflect the underlying genetic defect resulting in spontaneous hyperlipidemia. Furthermore, animal and human glucose responses cannot be compared directly. The same is true for the threshold for manifest T2D. By human standards specified in the guidelines of the World Health Organization, 6 Group C comes closest to the human threshold for T2D. Increased HOMA-IR also indicated IR in Groups B and C 3 but could not distinguish the different underlying mechanisms. For this purpose, dynamic reactions such as those retrieved from an OGTT have to be considered, which can be done by a dynamic model.
Application of the novel mathematical model to the murine data
We then applied our mathematical model to see whether it was sensitive to early stages of IR. From our point of view the time constant T G of glucose effectiveness and the insulin sensitivity kX , as well as the glucose sensitivities k G1 and k G2 are of particular diagnostic interest. Furthermore, the initial plasma glucose level G 0 is identified in order to allow the model to adapt to the different form of initial glucose administration of an OGTT.
In the in silico simulations based on the murine data we observed that T G and kX were closely associated. Identification of both constants in one model may therefore lead to inconsistent results. For this reason, we first determined the parameter set {T G,k G1,k G2,G 0} in an initial analysis. As Table 2 shows, T G is growing to large values for all control groups (A, D, and E) that are only limited by the maximum number of iterations of the optimization algorithm. Therefore, T G can be assigned to an arbitrary large value. We chose T G=1,000 min for simplicity and optimized {kX ,k G1,k G2,G 0} in the main analysis. Table 3 indicates the objective functions obtained for all groups in the initial and the main analysis. As expected, the objective function J performed better in the main analysis (i.e., yielded smaller values than in the initial analysis for all groups). It is interesting that the in silico experiments achieved smaller values of J for the groups not subjected to the extreme high-fat diet (A, D, and E), which means that the model characterization is better in these cases.
Data are mean±SD values for model parameters T G, k G1, and k G2 for Groups A, D, and E. Differences from the human reference model are observed for T G and k G2, whereas k G1 tends to be in the same order.
Simplex optimization does not converge and is stopped after reaching the maximum of 150 iteration steps.
Data are mean±SD values. A small value J represents a good model representation (see Eq. 9 in Materials and Methods).
In order to assess the mathematical model, its in silico predictions of the murine OGTTs were compared with the actual in vivo measurements (Fig. 4). A good agreement was seen for Groups A, D, and E. The markedly impaired glucose tolerance (IGT) of Groups B and C resulted in high insulin levels for t<20 min and larger SDs.
Model-based differentiation among different stages of the MetS
IGT associated with LDLR deficiency
We then determined whether metabolic changes meeting the criteria for IGT can be detected in the experimental groups not exposed to the high-fat diet (i.e., Groups A, D, and E). The HOMA-IR index was greater than 5 in Group A, which suggests IR, but well below 5 in Group D. The mathematical model provided more consistent information. Table 2 indicates the parameters identified in mice and compares them with those of the human reference model. Within the obvious limitations of such a comparison, the following conclusions are supported: • The first-phase glucose sensitivity k
G1 is in the same order as in the human reference model. Hence, the first-phase insulin response seems to be similar. • In contrast, the second-phase glucose sensitivity k
G2 is reduced by a factor of 3–8. This may indicate increased glucose resistance in the second phase. • During parameter identification the estimate of T
G is growing continuously to very large values until the iteration is aborted. If T
G is striving to infinity, the glucose efficiency 1/T
G is going to zero. It seems to be a common characteristic of the LDLR
−/− mice that their ability to clear glucose (without insulin stimulation) is disrupted.
Together, initial analysis of data with the novel model indicates an early diabetes phenotype charactecterized by a reduced second-phase insulin response and a marginal self-contained glucose clearance in LDLR −/− mice.
Combined effect of LDLR deficiency and obesogenic high-cholesterol high-fat diet
In Group B, fasting glucose levels were normal, but fasting insulin levels were markedly increased, most likely in order to compensate for the rapid onset of IR.
Again, the mathematical model may provide an explanation. Figure 3g–i shows the parameters identified by the main analysis of all five groups. Compared with the previously discussed Groups A, D, and E, the insulin sensitivity kX
is decreased in Group B. At the same time the glucose sensitivities k
G1 and k
G2 are increased, most likely in order to compensate for the loss of insulin sensitivity. For example, in relation to Group A the gain ratios are
T2D
The mean fasting glucose level of Group C in Figure 3d was 143.0 mg/dL. Thus, by human standards, these animals had a manifest T2D. The in silico model yields exactly the same diagnosis: the glucose sensitivities k G1 and k G2 are significantly lower than those of Group B, whereas the insulin sensitivity is not able to compensate this.
Compared with the IGT group (Group A), it is
In summary, the new mathematical model allows detections of different stages of IR and is sensitive to its early progression.
Discussion
Insights from the mathematical model
We here introduce a novel model designed to be sensitive to early patterns of the MetS and thus to facilitate early diagnosis of IR. Compared with previous methods, reviewed for example by Matsuda, 31 our model not only provides a measure of insulin sensitivity, 32 but also determines additional parameters, which allow us to distinguish between different close-meshed patterns of IR.
The key requirement of our mathematical model was to accurately reproduce the glucose–insulin homeostasis observed in vivo. It was derived from the ordinary differential equation type VT (or Minimal) Model 22,23 by adding two compartments. Such additions have been successfully performed in order to consider external influences (e.g., diets 33 ), to reflect more complex mechanisms, 34 or to distinguish different organs, 35 but they usually come at the price of requiring additional measurements. Our model has the advantage of being time-invariant and of differentiating between first- and second-phase insulin responses. For a broad review of model-based methods in the field of diabetes see the review of Cobelli et al. 27 ; different modeling approaches are compared by Makroglou et al. 36 and Mari. 37
After successful validation of the model with IVGTT data from a human reference population, we applied the novel model to different age- and genetically matched groups of LDLR −/− mice, which were fed either with standard chow for various time periods (dyslipidemia reflecting only the genetic defect) or with a standardized high-fat/high-cholesterol diet (combined effect of genetic defect and high-risk lifestyle). As shown in Table 4, four different stages of IR could be distinguished with the help of the mathematical model. These are in line with the prevailing hypothesis of a gradual process beginning with IGT and ending in severe T2D. The model allowed us to separate early stages of IR characterized by increasing insulin production from later stages showing decreased insulin levels and rising glucose levels and from T2D. It therefore appears that the model parameters {T G, kX , k G1, k G2} provide the means for an early diagnosis of IR in conjunction with a simple OGTT.
HOMA-IR, homeostasis assessment model of insulin resistance; IGT, impaired glucose tolerance; IR, insulin resistance; T2D, type 2 diabetes.
Provided that further validation in human subjects supports these findings, the method may offer practical and cost advantages. More important is that the method may provide an additional level of certainty in diagnosing early stages of IR and thus be of value for the prevention of the clinical consequences of T2D, mainly CVD.
With regard to basic science applications in mice, the emphasis clearly lies on early detection. Currently, there is no clear consensus about what constitutes borderline hyperinsulinemia and hyperglycemia in the many genetically modified mouse models available. Nor is there an agreement on basic aspects of euglycemic clamps, such as the duration of fasting, the use of an initial insulin bolus, or the subsequent constant insulin infusion rate. 8 Technical aspects further complicate the comparison of data obtained by various groups. For example, no uniformly recognized standards exist for the time interval between catheter implantation, anesthetic agents, and the blood sampling technique from arterial catheters or peripheral sites. Glucose clamp studies in mice therefore often represent far more stressful conditions than those encountered in humans. In contrast, OGTTs are carried out under fairly standardized conditions even in mice, except for the duration of fasting. Our model, being sensitive to early changes of IR, should therefore be of great value. However, the very absence of uniform criteria for IR in mice, as well as the absence of histologic or other verifiable changes associated with the onset of IR, makes it difficult to establish the physiological significance—and relevance—of the new parameters introduced by our model.
Novel diagnostic indices
The HOMA-IR index is widely used for human screening purposes but was not able to differentiate stages of murine IR, probably because it is based on fasting measurements. Indices based on responses triggered, for example, by oral glucose, like in the OGTT provide more information. Stumvoll et al. 38 investigated several indices for IR, termed MCR, ISI, 1st PH, and 2nd PH, that are calculated as linear combinations of the (nonfasting) measurements of an OGTT. All of these indices showed good agreement with clamp measurements. They are, however, not obtained from a dynamic model (defined by differential equations), and their model coefficients could not be interpreted in the scope of a physiological model. Furthermore, these indices also utilize the body mass index, which hinders comparison with animal models. In contrast, Pillonetto et al. 39 provided an analytical solution for a truly dynamic index of insulin sensitivity, based on Bergman's model. Compared with this, our approach requires an optimization procedure to obtain the solution but determines a set of parameters. For the classification of different patterns of IR proposed in Table 4, a mere scalar index will be insufficient. For this purpose, a multidimensional set of parameters has to be provided, based on a model such as the one presented here or that proposed by Stumvoll et al. 38 The combination of in vivo data and mathematical procedures offers far more detailed pathophysiological insights into the glucose–insulin homeostasis and therefore permits an early diagnosis and greater therapeutic options.
Today, the computational resources needed for model evaluation and optimization no longer impede its widespread application. 24,25 Altogether, our model offers a novel perspective to diagnose and target IGT and early evolution of IR.
Footnotes
Acknowledgments
Work was supported by grants HL-067792 and HL-089559 (to W.P.) from the National Institutes of Health. C.E. was supported by a German Cardiac Society Research Fellowship.
Author Disclosure Statement
No competing financial interests exist for any of the authors. C.E. designed and carried out the experiments in the murine model. C.E. and C.A. developed the mathematical model and adopted it to the measured data. All authors analyzed and discussed the results and contributed to writing the manuscript.