




Abstract
Background:
Glucose variability has been identified as a predictor of hypoglycemia and has been associated with mortality in critically ill patients without diabetes. A popular metric to quantify glucose variability is the mean amplitude of glycemic excursions (MAGE). The “ruler and pencil” approach to calculate MAGE is operator-dependent and time-consuming for analysis of continuous glucose monitoring data. Therefore, several computer software programs have been developed for the automated calculation of MAGE. The aim of our study was to evaluate the agreement of currently available MAGE calculators when applied to the same set of continuous glucose monitoring (CGM) traces.
Materials and Methods:
Four software programs for calculation of MAGE were identified and used to calculate MAGE of 21 CGM traces from seven patients with type 1 diabetes. Subsequently, the median MAGE per calculator was calculated. The correlation between the MAGE calculators was evaluated by Spearman's correlation analysis. Between-group comparison was performed using analysis of variance.
Results:
The median MAGE (interquartile range) per calculator was 8.7 (7.1–10.7), 6.7 (5.5–8.6), 6.7 (5.2–8.6), and 5.8 (4.3–7.1), which was statistically different overall (P<0.001). The correlation coefficients between the calculators ranged from 0.787 to 0.999.
Conclusions:
Available computer programs developed to calculate MAGE show varying agreement. Although software programs for the calculation of MAGE would seem attractive to assess glucose variability, their use has limitations by different outcomes, in the absence of a gold standard.
Introduction
A
The mean amplitude of glycemic excursions (MAGE), based on the arithmetic mean of differences between consecutive peak and nadirs of differences greater than 1 SD of mean glucose, is designed to assess major, especially postprandial, glucose swings and exclude minor ones. 8 Together with SD, it has become a popular metric to assess glucose variability. However, MAGE has numerous limitations: it is unclear whether excursions smaller than 1 SD should indeed be discarded, it does not take the frequency of excursions into account, and there is a difference in outcome when ascending or descending limbs are used for calculation of MAGE. 9,10 Moreover, the “ruler and pencil” approach to estimate MAGE, which is often used by researchers when calculating MAGE, is time-consuming and operator-dependent for analysis of a large number of CGM data. 10 –12 Therefore, computerized determination has been recommended. 11
Several computer software programs have been developed for the calculation of MAGE. 9,12 –14 The original MAGE definition, however, does not give sufficient detail to develop a clear computing algorithm. 9,11 Thus, the question arises whether the available computer software programs produce identical MAGE values for a given glucose trial. The aim of the study was to evaluate the agreement of currently available automated MAGE calculators when applied the same set of CGM traces.
Materials and Methods
CGM data collection
CGM traces were obtained from seven patients with type 1 diabetes (mean age, 42±12 years) who had previously participated in a clinical study designed for the development of an artificial pancreas. All patients were admitted three times for a duration of 24 h to the clinical research center. At least a 1-week interval was set between the hospital admissions. After clinical research center admission (6:00 p.m.), patients were provided with a subcutaneous CGM sensor (SEVEN® Plus; DexCom, San Diego, CA), and CGM measurements were started after calibration according to the manufacturer's specifications. Patients received three meals during their stay in the CRC, namely, dinner at 7:00 p.m. (80 g of carbohydrates), breakfast at 8:00 a.m. (50 g of carbohydrates), and lunch at noon (60 g of carbohydrates). At 3:00 p.m. an exercise test was performed. CGM measurements finished at 6:00 p.m. with subsequent removal of the sensor.
MAGE calculators
Four currently available software programs for calculation of MAGE from CGM data were used for the purpose of this study: the Web-based application “GlyCulator,” 13 the Excel® (Microsoft®, Redmond, WA)-enabled workbook “EasyGV” 14 (© University of Oxford, Oxford, United Kingdom), the MAGE computer program offered by the Diabetes Service Center, Karlsburg, Germany, described by Fritzsche et al., 12 and the automated algorithm for MAGE calculation described by Baghurst et al. 9 In this article, the calculators will be referred to as Glyculator, EasyGV, Fritzsche, and Baghurst, respectively.
All calculators first generate the SD of a given CGM trace. Subsequently, Glyculator and EasyGV both calculate a single MAGE value from a given CGM trace without use of a graphical display of the glucose values. In contrast, the Fritzsche and Baghurst calculators generate a graph of the CGM values, which is then used to calculate MAGE.
Both Fritzsche and Baghurst give the user additional options for the calculation of MAGE. Specifically, Fritzsche et al. 12 proposed in their published article that incomplete excursions at the start or end of a glucose profile should not be included in the calculation of MAGE. Therefore, the Fritzsche calculator lets the user choose whether or not to consider the first and/or the final glucose value of the CGM trace as a start or end point of a glucose excursion. This results into four different MAGE values per CGM trace. The Baghurst calculator calculates MAGE of all upward excursions (MAGE+), downward excursions (MAGE−), and an average of all excursions (MAGE.avge).
Data analysis
Twenty-one CGM traces were reformatted to meet the requirements of the computer programs. SD and MAGE were calculated for each CGM trace with use of the available MAGE calculators. One single SD for each CGM trace was used because CGM traces did not exceed the maximum of 24 h. The SD of each calculator was compared with the SD calculated from the raw CGM data. Missing SD or MAGE values were identified and recorded. For the calculation of MAGE of Fritzsche, we changed the timestamps of the original CGM readings in a way that the CGM trace “started” at 0:00 a.m. (instead of 6:00 p.m.) and ended at 11:59 p.m. This was needed because the Fritzsche calculator was only able to calculate MAGE per day and not per CGM trace if a trace extended from before to after midnight.
In order to obtain an adequate comparison among the different MAGE calculations, we used one MAGE calculation per CGM trace per calculator. We selected the MAGE calculation of Fritzsche in which both the first and final glucose values were taken into account. The MAGE of Baghurst (i.e., either using MAGE+ or MAGE−) was selected by exploring the direction of the first excursion of the generated graph of each CGM trace. These selections were based on the original description of MAGE, 8 which graphically shows that the first and final glucose values of a CGM trace are considered as the start or end point of a glucose excursion and that the direction of the first excursion is used to either include the up- or downward excursions in the calculation of MAGE.
Statistical analysis
Data are presented as mean±SD values or median (interquartile range), as appropriate. The correlation between the MAGE values obtained by the different MAGE calculators was evaluated by Spearman's correlation analysis. A correlation coefficient (r) of at least 0.95 was considered a sufficient correlation, given the fact that the calculators aim at assessing the same metric. Between-group comparison of the median MAGE per calculator was performed using analysis of variance (Friedman's test). Post hoc testing was performed by use of Dunn's multiple comparison test. Finally, Bland–Altman plots were used to assess the agreement of the methods over the range of MAGE values. A P value of <0.05 was considered significant.
Results
Of the 21 provided CGM traces the mean number of CGM readings was 274 (268–281), mean duration of CGM readings was 23.2 (23.0–23.3) h, mean glucose was 8.4 (7.0–9.2) mmol/L, and mean SD was 3.0 (2.2–3.6) mmol/L. All calculators were able to calculate a SD from the given CGM traces, and those were similar to the SD generated from the raw CGM data.
The Glyculator, Fritzsche, and Baghurst calculators were able to calculate MAGE from all the provided CGM traces, whereas EasyGV showed a missing value in one out of 21 provided CGM traces. The reason for this missing value could not be determined.
Table 1 shows the correlation coefficients for MAGE calculation between the calculators, which ranged from 0.787 to 0.999. The median MAGE and corresponding interquartile ranges per calculator are shown in Figure 1: Glyculator, 8.7 (7.1–10.7); Fritzsche, 6.7 (5.5–8.6); Baghurst, 6.7 (5.2–8.6); and EasyGV 5.8 (4.3–7.1). Between-group comparison showed a significant overall difference between the median MAGE of all four calculators (P<0.001) (Fig. 1). Post hoc analysis showed a significant difference between Glyculator versus Fritzsche, Baghurst, and EasyGV (P<0.01 for all).
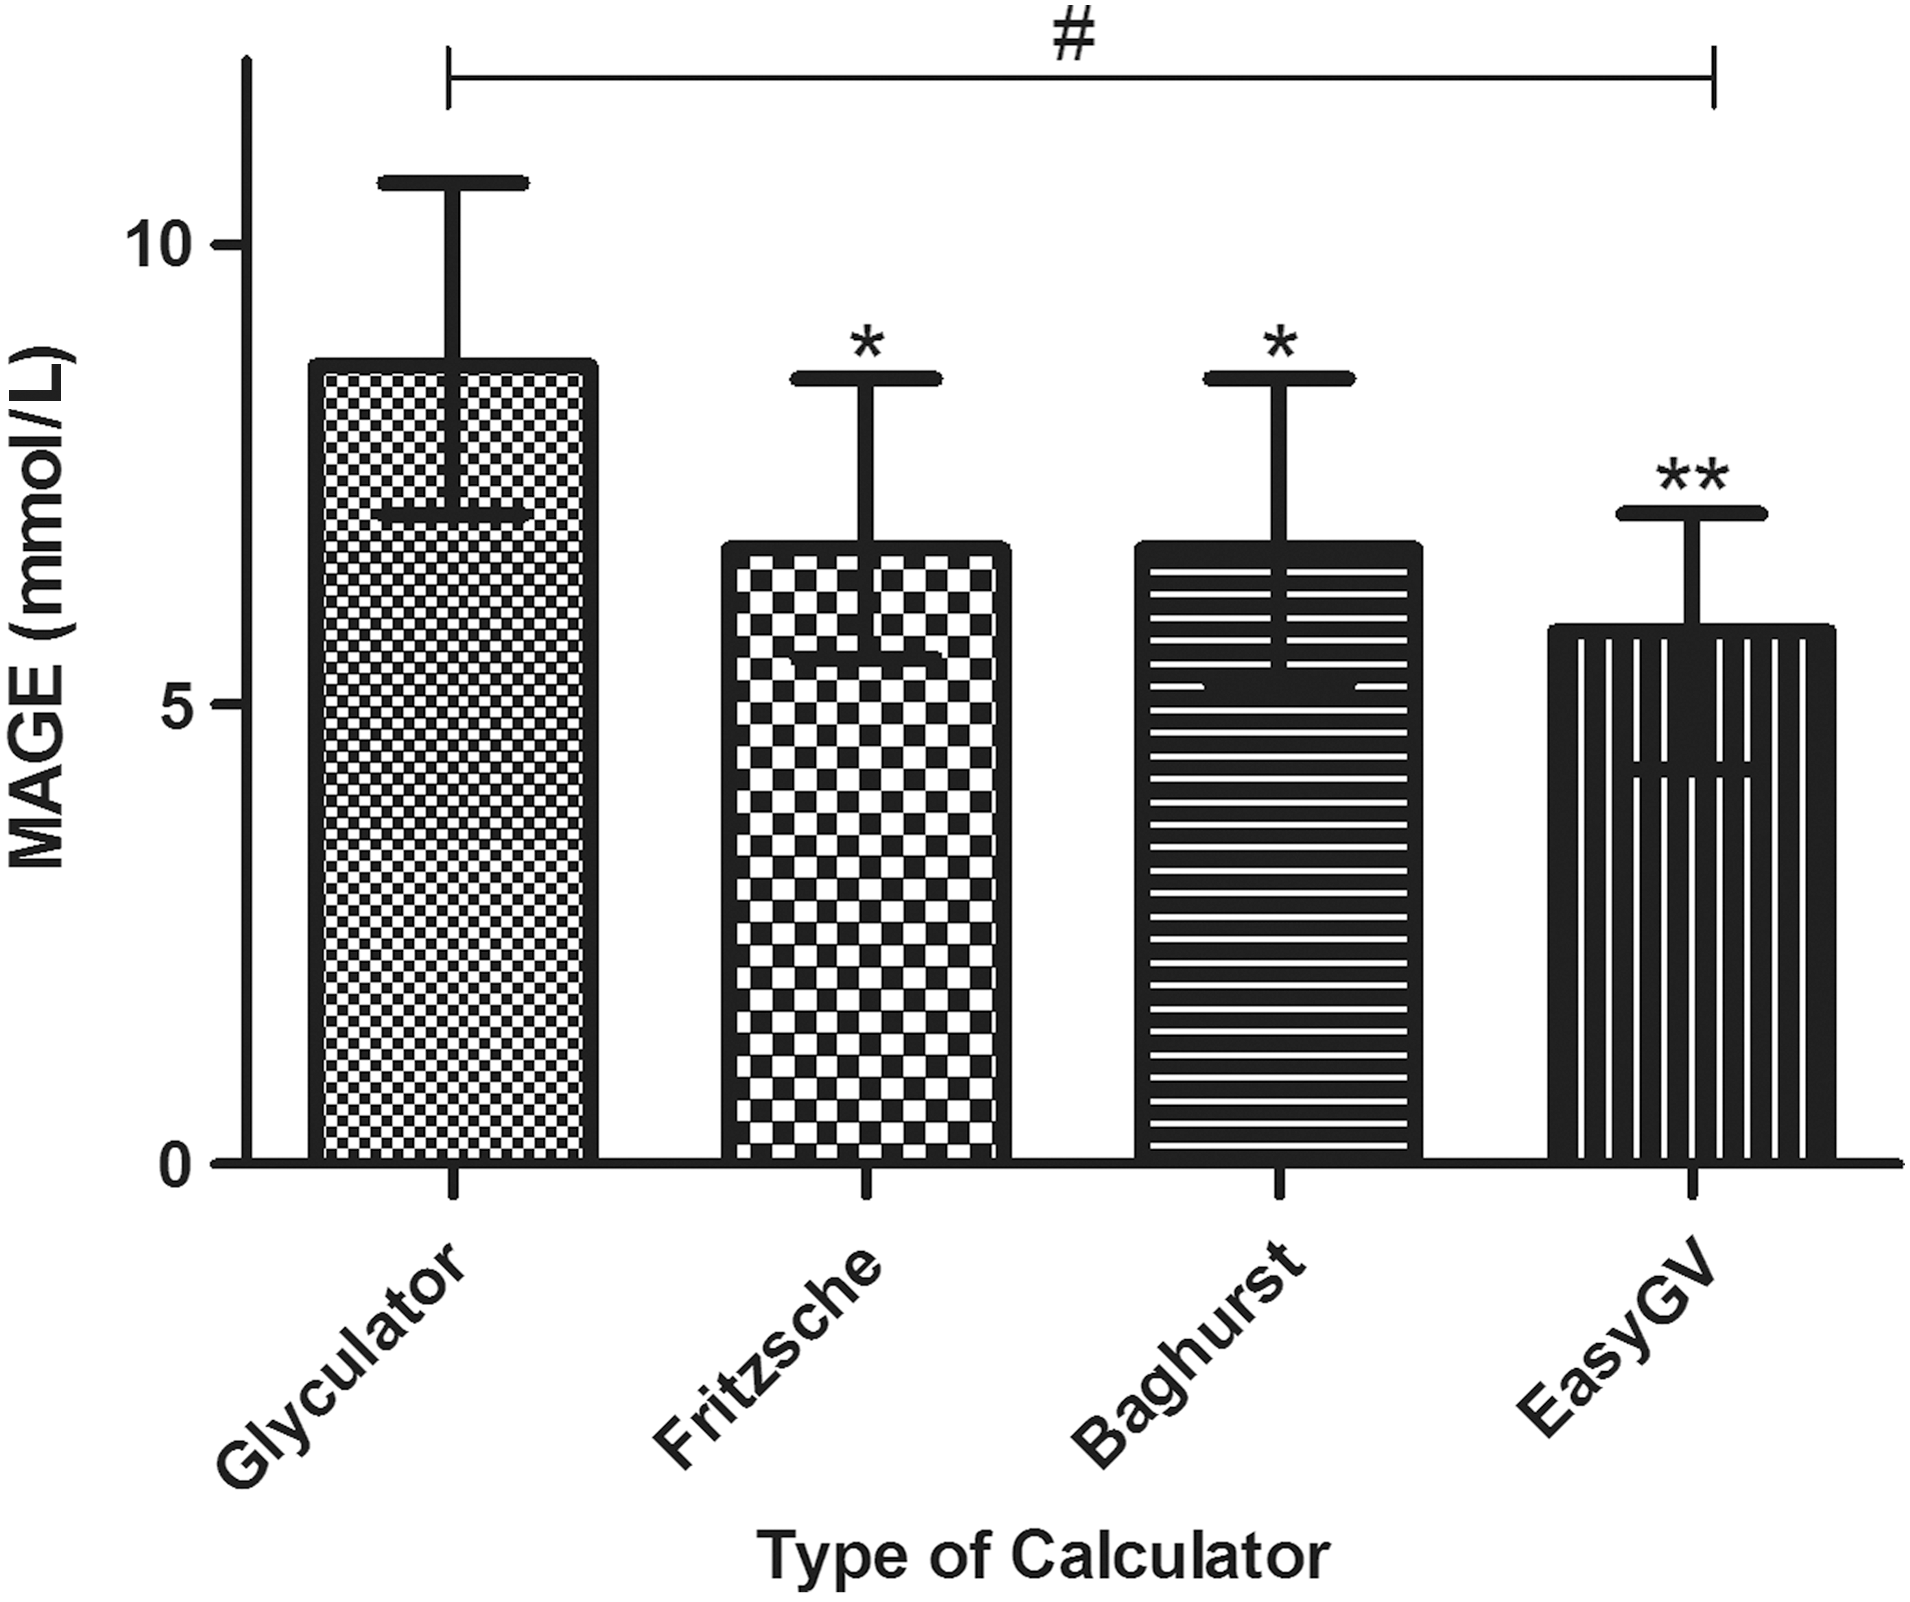
Variation in mean amplitude of glycemic excursions (MAGE) calculation per type of calculator. Data are shown as the medians with corresponding interquartile ranges. Statistical significance was determined using the Friedman test followed by Dunn's post hoc test. Between-group comparison showed a significant overall difference among all calculators: #overall P<0.001. *P<0.01, **P<0.001 compared with Glyculator in post hoc analysis.
P<0.001 for all comparisons.
We finally used Bland–Altman plots to assess the agreement of the MAGE calculators over the range of MAGE values (plots not shown). Mean differences were 2.41±2.56 (Glyculator vs. EasyGV), 1.81±1.22 (Glyculator vs. Fritzsche), 1.84±1.23 (Glyculator vs. Baghurst), −0.60±2.56 (EasyGV vs. Fritzsche), 0.57±2.55 (EasyGV vs. Baghurst), and 0.03±0.11 (Fritzsche vs. Baghurst) mmol/L, respectively. The differences between the calculators were independent of the absolute MAGE values.
Discussion
The current study shows varying agreement among the available computer programs developed and validated to calculate MAGE. A good agreement is only found between Fritzsche and Baghurst and not between the other calculators. Furthermore, an overall significant difference among the median MAGE values of all four calculators was found, in which Glyculator was most deviant. To our knowledge, this is the first article comparing different MAGE calculators applied on identical CGM datasets.
In view of these varying correlations among the currently available MAGE calculators, which are intended to measure the same MAGE, certain important issues should be considered. MAGE calculation was initially developed using hourly glucose samples, and it has never been formally validated for calculation from CGM data. Also, there is no “gold standard” for the calculation of MAGE. The somewhat complex explanation how MAGE should be determined in the original description for MAGE calculation by Service et al. 8 may have led to various interpretations how to translate this into a computed algorithm.
It should be noted that we made some choices in how to apply the Baghurst and Fritzsche calculators, according to what we thought would be most consistent with the original description of MAGE. 8 For the Baghurst calculator, we determined per trace whether the first excursion was an upstroke or downstroke, rather than applying MAGE+, MAGE−, or MAGE.avge. For the Fritzsche calculator, we decided to include both the first and last data point, rather than deleting these. With these choices, a correlation of 100% between these two calculators was seen, arguing for the notion that these are the correct choices and that with these choices these calculators perform a correct calculation of MAGE. Likely as this may be, we still cannot be certain that these are the correct choices. The exact way MAGE calculation is performed by Glyculator and EasyGV could not be determined from either the original descriptions or the software. Moreover, a graphical display of a glucose trail, such as provided by Fritzsche and Baghurst, seems a requirement for the automated calculation of MAGE.
Given the results of this study it becomes even more evident that MAGE is a complex measure to implement in clinical practice. In addition, considering the high correlation between MAGE with the overall SD, 11 one should question whether the use of MAGE offers any advantage over other measures in terms of its ability to determine glucose variability. SD may be superior in terms of its definition, ease, and consistency of computation, 11 although it remains a measure of dispersion rather then glucose variability. Mean absolute glucose change may become the standard for glucose variability. 7,10
This study should be viewed in light of its strengths and limitations. The main strength of the study was the considerable numbers of CGM traces that were systematically analyzed by the available calculators. A possible concern regarding this study is that we did not compare the results of the MAGE calculators with the graphical “ruler and pencil” approach, which possibly can be seen as the “gold standard” method in calculating MAGE. Although the interoperator variability for the manual calculation of MAGE has not formally been investigated, it seems unlikely that this will be less than for the available automated calculators. Also, given the amount of data, automated calculation seems preferable.
To conclude, although validated software programs for the calculation of MAGE would appear useful for clinicians in order to assess glucose variability, one should be aware of the operator dependency or interoperator variability of the available automated MAGE calculators. This limitation adds to the previously reported limitations of MAGE.
Footnotes
Acknowledgments
We acknowledge the AP@home Consortium for giving us access to the continuous glucose monitor trials used for our analysis.
Author Disclosure Statement
No competing financial interests exist.