
Abstract
Background:
Asymptomatic hypoglycemia in neonates may contribute to neurologic deficits during development. Whole-blood glucose sensors are often imprecise and inaccurate at the low glucose concentrations found in neonates.
Subjects and Methods:
In this study, a glucose sensor using a mutated glucose dehydrogenase that does not cross-react significantly with maltose was evaluated at three pediatric centers. Blood samples (n=575) from infants less than 30 days of age (hematocrit 23–70%) were analyzed using six reagent lots on three ACCU-CHEK® meters (Roche Diagnostics, Indianapolis, IN): the Inform II, Performa, and Aviva. Reference glucose level was determined in duplicate in perchloric acid extracts using a coupled hexokinase procedure.
Results:
Imprecision of glucose measurement using stable control materials ranged from 2.0% to 3.1% (coefficient of variation) using the glucose meters and from 0.8% to 5.3% (coefficient of variation) in perchloric acid–treated controls. The difference between meter glucose values and reference values showed a slight dependence on hematocrit from 23% to 70% (r=−0.391, P<0.001) but not in the typical range of neonatal hematocrit from 45% to 70% (r=−0.036, P=0.239). Linear regression of the aggregated results yielded the following relationship: Meter glucose=0.99×Reference Glucose+0.04; r 2=0.976; Syx =0.249. Receiver-operator characteristic analysis of the data using 2.2 mmol/L as the reference threshold for hypoglycemia yielded an area under the curve value of 0.993. All infants with a glucose level of <2.2 mmol/L were detected (100% sensitivity) when the meter glucose value was below 2.8 mmol/L.
Conclusions:
These data indicate that the modified ACCU-CHEK chemistry may be used effectively in neonatal settings to detect clinically significant hypoglycemia.
Introduction
The purpose of the current study was to assess the capacity of a whole-blood glucose monitor to detect clinically significant hypoglycemia in newborns. The requirement for small blood volumes and rapid testing makes whole glucose meters particularly attractive in screening nursery populations for hypoglycemia. However, newborns pose unique challenges for whole-blood glucose measurement. First, infant hematocrits are higher (55–65%) than those in normal adult males (40–50%) or females (35–45%), necessitating accurate correction for differences in sample water content. Second, postpartum hypoglycemia is relatively common as infants transfer from transplacental to oral nutrition, and glucose meter imprecision is greatest at these low glucose concentrations. Third, newborns with plasma glucose concentrations of ≤40 mg/dL may be clinically asymptomatic, but such concentrations have been associated with abnormalities of brain electrical activity and later neurocognitive deficits. 3,4 Thus, quick recognition and correction of hypoglycemia are essential to mitigate neurologic ramifications.
The Roche Diagnostics (Indianapolis, IN) ACCU-CHEK® blood glucose chemistry strip utilizes a bacterial glucose dehydrogenase belonging to a group of quinoprotein oxidoreductases that use pyrroloquinolone quinone as the cofactor rather than flavin or nicotinamide. The amount of current generated by glucose oxidation is proportional to the blood glucose concentration. The test strips in this study used a mutant glucose dehydrogenase that did not display significant reactivity to maltose (4-O-α-
Materials and Methods
Analytical
All analytic procedures were carried out by certified medical laboratory technologists. Three lots of test strips for each of the meter systems were provided to each site by Roche Diagnostics: Site 1 (ACCU-CHEK Performa) and Site 2 (ACCU-CHEK Inform II) used the same three strip lots, and Site 3 (ACCU-CHEK Aviva) used three distinct strip lots. Thus, in total, six strip lots were used in the study. Instrument integrity and imprecision of each meter were monitored daily at two concentrations. The order of sample application to the glucose meters was varied every 10 specimens. Spun hematocrit was determined using a Readacrit™ microcentrifuge system (Becton-Dickinson, Franklin Lakes, NJ) in singlicate for each specimen. Reference glucose was determined using a modified hexokinase/glucose-6-phosphate dehydrogenase procedure at a central location on perchloric acid (PCA) extracts of whole blood prepared at each site. PCA extracts were prepared by adding 50 μL of whole blood to 500 μL of 0.33 M PCA (in duplicate) within 10 min of glucose meter analysis (mean, 2 min). PCA-treated specimens were mixed and centrifuged at 10,000 g for 10 min to generate the whole-blood extract. Plasma equivalent results were derived from whole-blood glucose values by multiplying the perchlorate results by the ratio of plasma water content to whole-blood water content. Using values of plasma and red blood cell water content of 0.93 kg/L and 0.71 kg/L, respectively, whole-blood water content was calculated according the following equation: (hematocrit)(0.71 kg/L)+(1 – hematocrit) (0.93 kg/L). 1
Patient samples and hospital settings
Site 1 (Performa) was an academic tertiary-care children's hospital with an associated nursery located in St. Louis, MO. Samples at this site were derived from infants ranging in age from 1 to 30 days (average, 4.2 days) in both the nursery and the neonatal intensive care unit. Site 2 (Inform II) was a large multispecialty medical center with an associated labor and delivery service located in San Diego, CA. Samples at this site were derived from healthy nursery infants ranging in age from 1 to 11 days (average, 1.2 days). Site 3 (Aviva) was a large urban hospital for women and newborns located in Ogden, UT. Samples at this site were derived from infants in the neonatal intensive care unit ranging in age from 1 to 29 days (average, 10.5 days). At each site a remnant aliquot of whole blood not exceeding 0.2 mL was used for meter glucose determination, hematocrit measurement, and PCA extraction. The protocol was approved by the institutional review boards at each respective clinical site.
Statistical analyses
Descriptive statistics and linear least squares regression were performed using Excel 2007 (Microsoft®, Redmond WA). Receiver-operator characteristic (ROC) analysis was performed using SPSS version 20 (IBM, Armonk NY).
Results
Imprecision of glucose measurements
At the beginning and end of each testing day and at the beginning and end of each strip vial, two levels of ACCU-CHEK control were analyzed on each of the three study instruments at the three study sites. On each day that whole blood PCA extracts were shipped for reference glucose determination, three levels of stable control material (NERL Diagnostics, East Providence, RI) were also extracted with PCA and submitted along with the patient samples for reference glucose determination. Imprecision (coefficient of variation) of meter glucose analysis ranged from 2.7% to 3.1% at 2.5 mmol/L and 2.0% to 2.4% at 16.8 mmol/L across all three sites (n=209–395). Imprecision (coefficient of variation) of the reference glucose level ranged from 1.4% to 3.4%, 1.2% to 5.3%, and 1.0% to 4.4%, respectively, at concentrations of 2.8, 11.1, and 22.2 mmol/L across all sites (n=36–128). Site-specific data are displayed in Table 1.
CV, coefficient of variation; PCA, perchloric acid.
Sample characteristics at each site
The hematocrit values, glucose concentrations, and absolute differences between meter and plasma at each site are shown in Table 2. In general, hematocrit, glucose, and bias were normally distributed at each site. The range of glucose concentrations was similar at Sites 1 and 3 but slightly narrower at Site 2. The range of hematocrit values was broadest at Site 1, whereas higher hematocrits were overrepresented at Site 2, and samples from Site 3 tended to have lower hematocrit values. Although similar across all three sites, the mean bias at Site 2 was slightly higher than the other two sites, reflecting a significant number of spuriously elevated meter results. A majority of the most elevated meter results ([meter – plasma]>0.5 mmol/L) appeared to be due to sample specific factors as these occurred across multiple strip lots. A small fraction of the elevated results occurred in only one of the triplicate determinations, suggesting a strip-specific or operator-dependent mechanism.
Accuracy of meter glucose determination
The derived plasma glucose values across all sites ranged from 0.62 to 8.46 mmol/L. These results from whole-blood perchlorate extracts were compared with meter results from all three sites using linear least-squares regression (Fig. 1). The regression equation of this relationship was as follows: ACCU-CHEK glucose=0.99×Reference Glucose+0.04 (r=0.976, Syx =0.249). Bland–Altman analysis (Fig. 2) showed an average bias of 0.03 mmol/L (range, −0.80 to 1.76 mmol/L) across the range of observed glucose concentrations. The average percentage bias was 1.15% (range, −21.8% to 58.1%). Bias did not vary significantly with glucose concentration (r=0.006, P=0.81). Meter results exceeded ISO 15197 8 accuracy criteria across the range of concentrations observed. Of the 1,161 meter results, 1,158 (99.7%) were within 0.83 mmol/L (15 mg/dL) of the reference glucose value in samples with glucose concentrations ≤4.17 mmol/L (75 mg/dL). Of 552 results from specimens with glucose concentrations >4.17 mmol/L, 549 (99.5%) were within 20% of the reference glucose. Meter results also met accuracy guidelines in CLSI POCT 12-A3. 9 For samples with glucose concentrations >5.56 mmol/L (100 mg/dL), 72 (96%) of 75 meter results were within 12.5% of the reference value. For samples with glucose concentrations ≤5.56 mmol/L, >98% of the 1,638 meter results were within 0.67 mmol/L (12 mg/dL) and 20% of the reference glucose value.
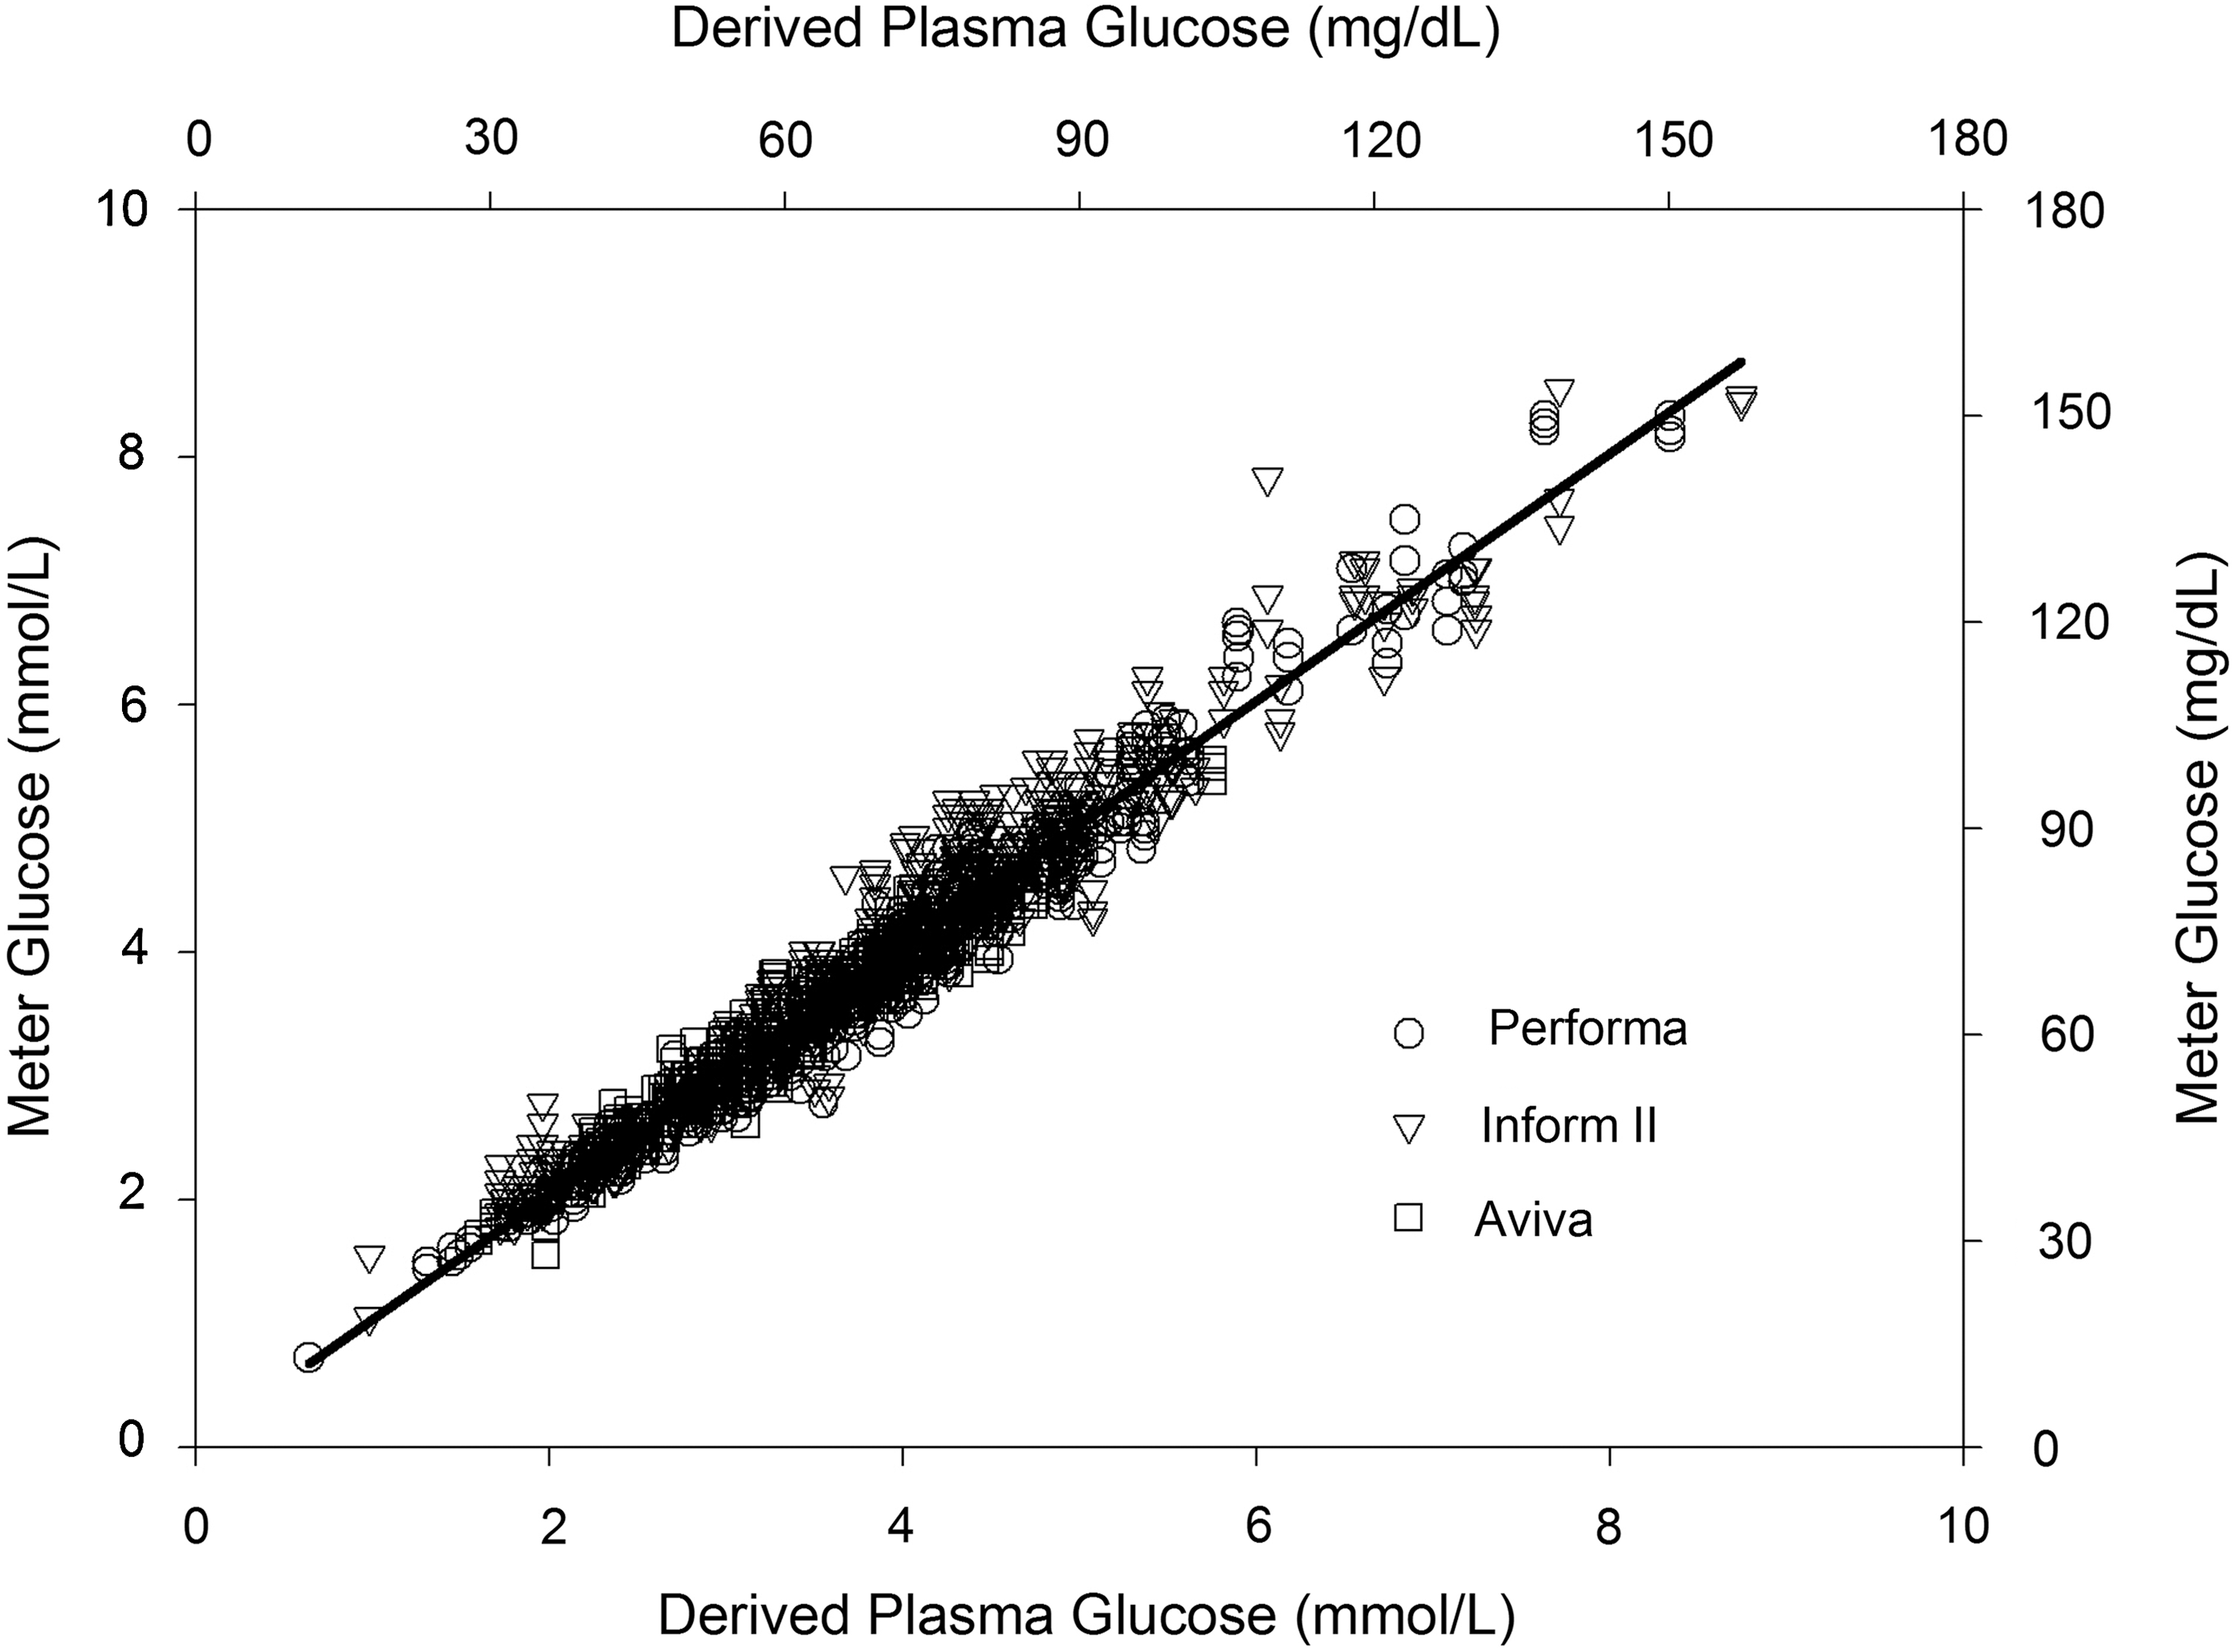
Comparison plot of meter glucose values versus derived plasma glucose values. All data derived from the Performa (○), Inform II (▿), and Aviva (□) meters are shown.
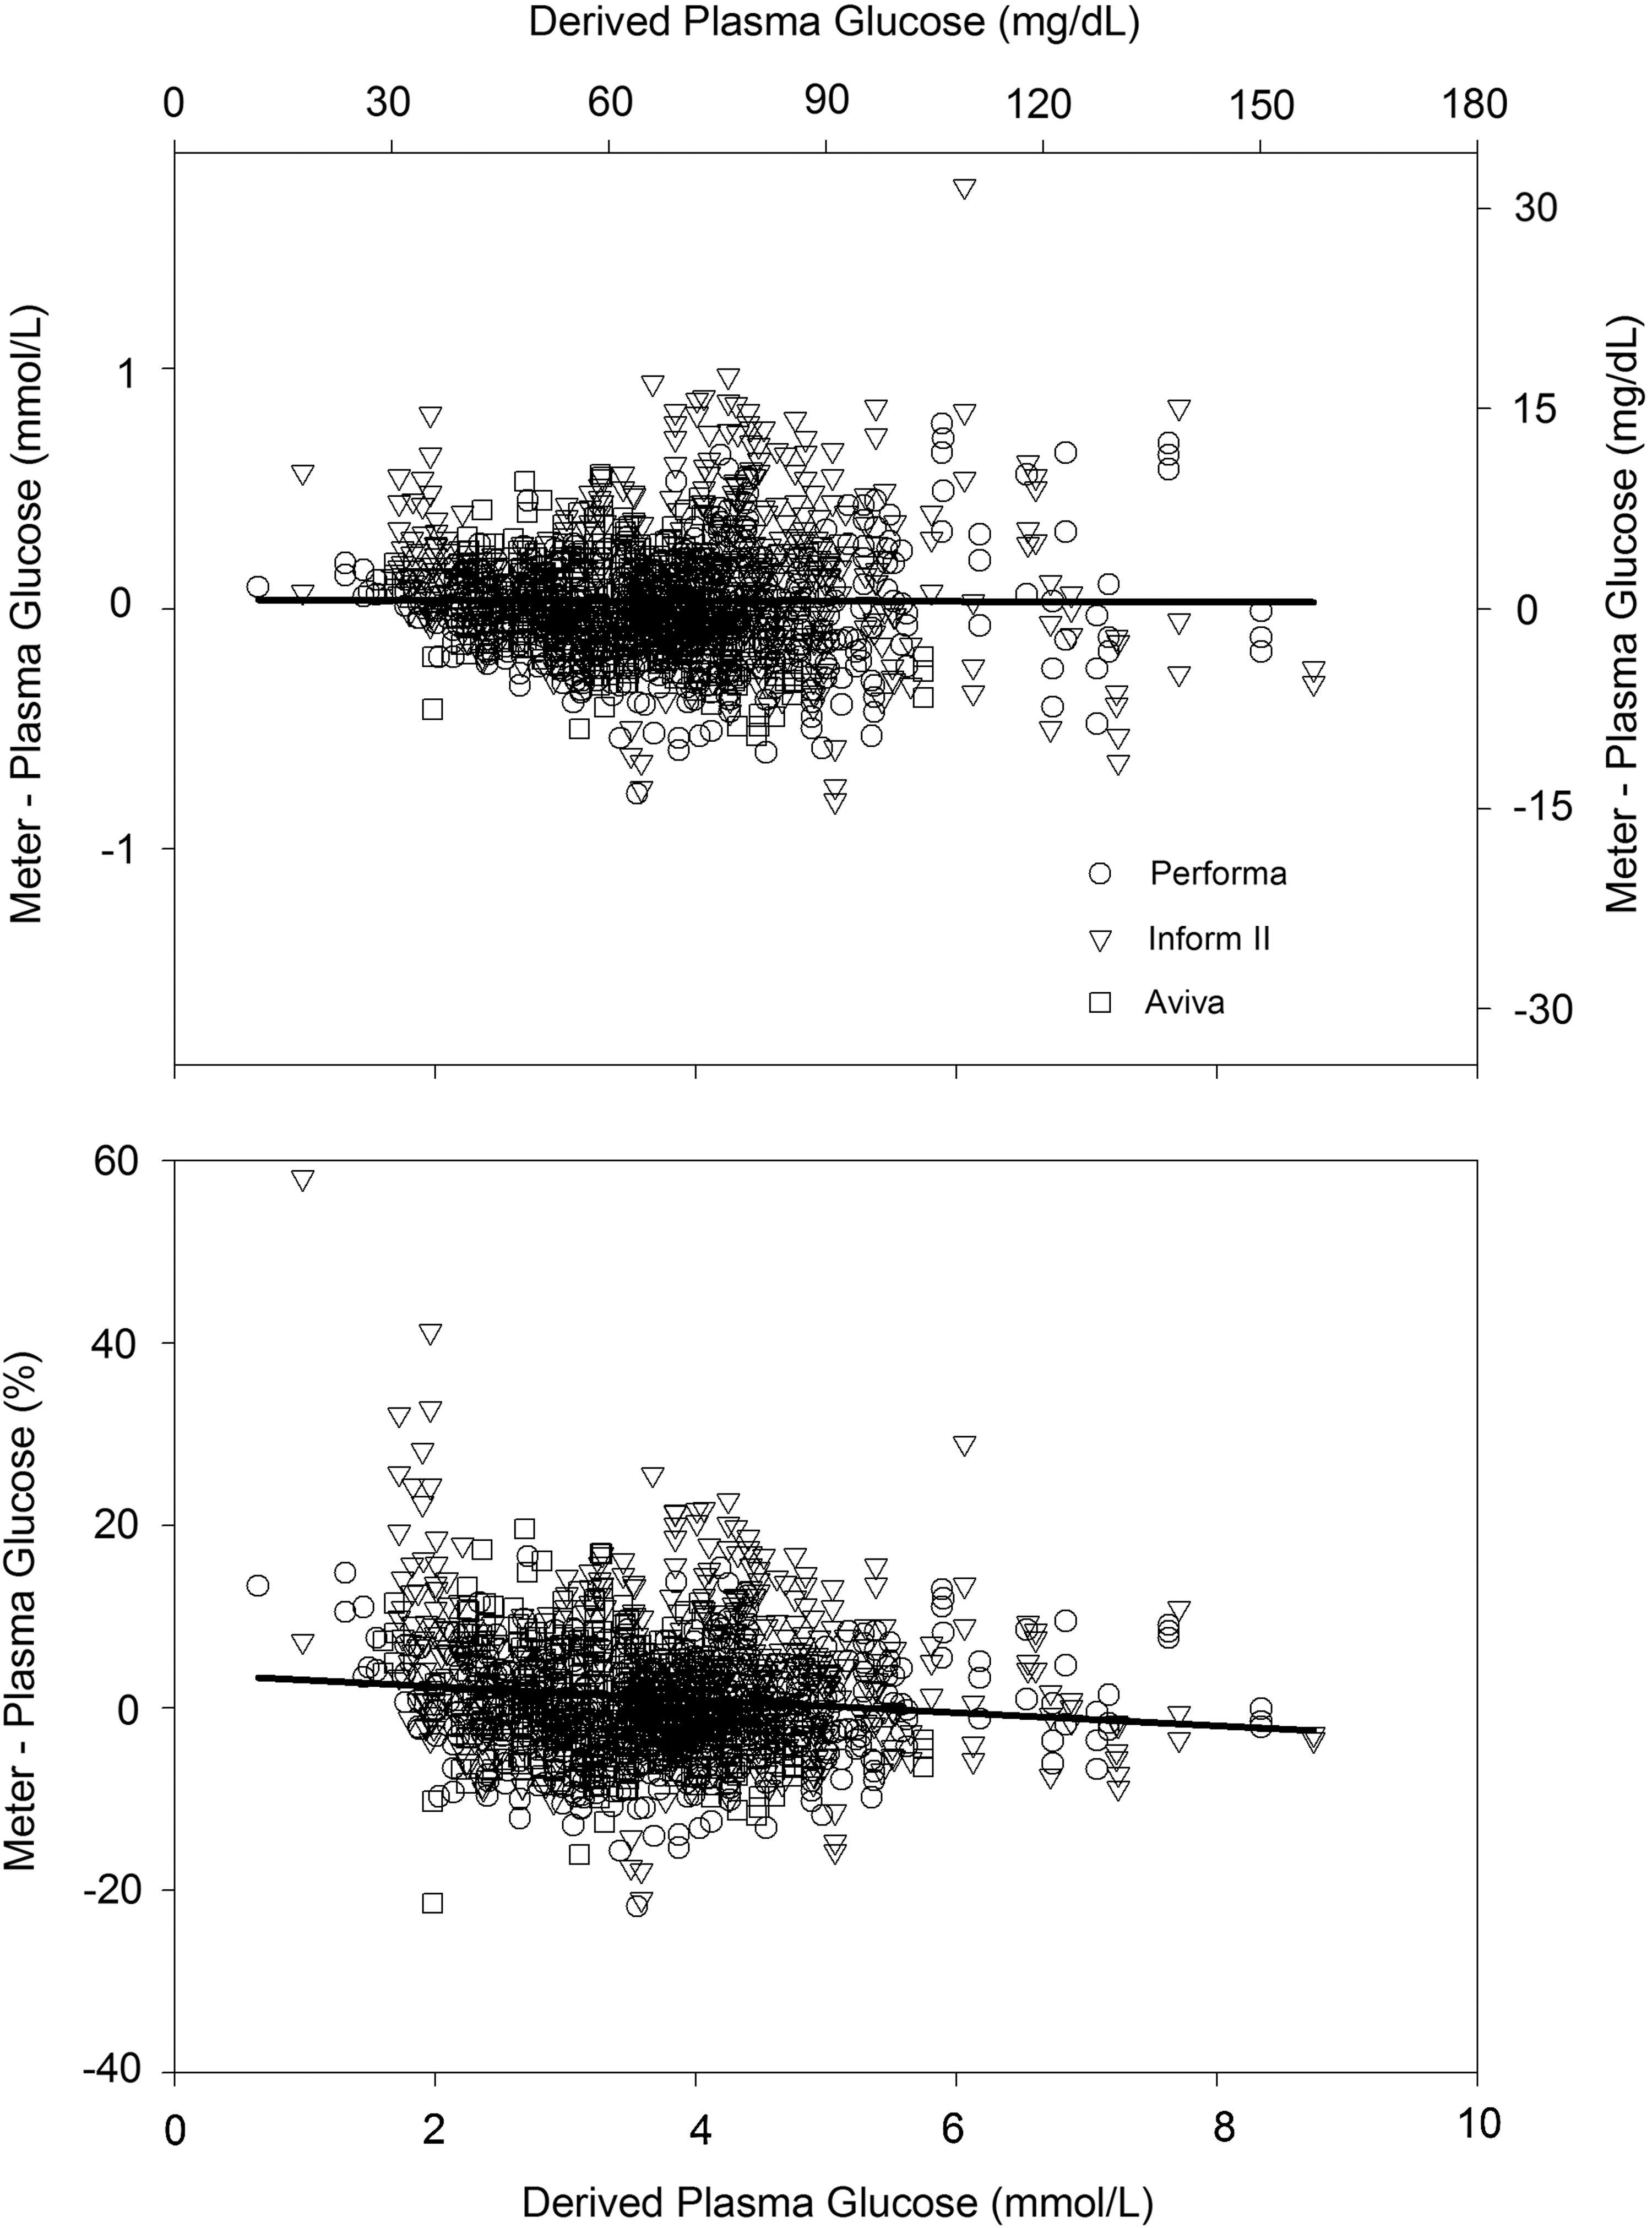
Bias of meter glucose versus plasma glucose across observed range of glucose concentrations:
Influence of hematocrit on meter glucose concentrations
Sample hematocrit varied from 23% to 70% across all clinical sites. Bias between the derived plasma glucose level and the meter concentration was significantly correlated with hematocrit (r=−0.391, P<0.001). Although the correlation was statistically significant, the slope of this relationship was modest (0.01 mmol/L decrease in glucose per 1% increase in hematocrit). Visual examination of the data (Fig. 3) indicated that the magnitude of the meter bias was greatest at hematocrits below 35%. In the range of hematocrit most commonly observed in the first neonatal week (45–70%), bias and hematocrit were not significantly correlated (r=−0.036, P=0.239).

Bias of meter glucose versus plasma glucose across range of observed hematocrit values:
Clinical performance
ROC analysis was performed to characterize the diagnostic accuracy of each meter system in detecting hypoglycemia (<2.2 mmol/L). The areas under the ROC curve for the Performa, Inform II, and Aviva systems (95% confidence interval) were 0.999 (0.997–1.00), 0.986 (0.979–0.993), and 0.999 (0.997–1.00), respectively. Across all platforms, a meter cutoff of 2.8 mmol/L detected all cases of hypoglycemia with a specificity of 99%.
Discussion
The performance of bedside glucose measurement has come under much recent scrutiny, in large part because of tight glycemic control programs in critically ill adults. 10 –13 In this study, we scrutinize the electrochemical detection of glucose in whole blood using a variant of glucose dehydrogenase with reduced maltose cross-reactivity in the detection of neonatal hypoglycemia. Neonates pose a particularly significant challenge to accurate bedside glucose measurement because hematocrits vary widely and glucose concentrations are routinely lower than those in adults. The stakes are high in this population as prompt recognition and treatment of neonatal hypoglycemia rely heavily on accurate glucose determination as asymptomatic hypoglycemia can lead to permanent neurologic impairment.
Although the slope and intercept of meter glucose versus plasma values indicate appropriate calibration, bias in individual specimens varied routinely by ±20%. This variability may derive from imprecision of the analytic system, operator-dependent factors (e.g., under-/overdosing, timing), patient-specific variables (e.g., matrix effects), or environmental factors (e.g., temperature, humidity, altitude). In this dataset, the impact of the operator is small as analyses were conducted by certified laboratory technologists. As a result, imprecision of the glucose meters was on par with many central laboratory methods using stable control solutions. Table 2 indicates a similar range of bias without respect to geography or patient population, so the source of the variable meter bias thus remains unclear.
Despite the observed bias, whole-blood glucose concentrations were clinically consistent with plasma values even at concentrations of <3 mmol/L, where historical performance of near-patient glucose monitors has been poor. Area under the ROC curve for detecting glucose less than 2.2 mmol/L approached 1.0, and meter glucose values were generally robust when challenged with an extreme range of hematocrit. At lower hematocrits typical of acutely ill infants, the apparent glucose level increased only slightly with decreasing hematocrit. In the range of hematocrit typical of healthier newborns, glucose was not affected by hematocrit. Collectively, these data indicate that by using a conservative cutoff concentration such as 2.8 mmol/L, the ACCU-CHEK blood glucose meter accurately detects plasma glucose concentration <2.2 mmol/L in neonates.
Footnotes
Acknowledgments
This study was supported by Roche Diagnostics.
Author Disclosure Statement
No competing financial interests exist.