
Abstract
Background:
Screening entire populations for diabetes is not cost-effective. Hence, an efficient screening process must select those people who are at high risk for diabetes. In this study, we investigated whether screening procedures could be improved using an extended predictive feature search.
Materials and Methods:
In order to develop our model and identify persons with diabetes (prevalence) we used data from years of the National Health and Nutrition Examination Survey (2005–2010), which has not been explored for this purpose before. We calculated all combinations of predictors in order to identify the optimal subset, and we used a linear logistic classification model to predict diabetes. V-fold cross-validation was used for the process of including variables and for validating the final models. This new model was compared with two established models.
Results:
In total, 5,398 participants were included in this study. Among these, 478 participants had unidentified diabetes. The established models had a receiver operating characteristics curve for the area under the curve (AUC) of 0.74 and 0.71 compared with an AUC of 0.78 for the new model, showing a significant difference (P<0.05). A proposed cutoff point for the established models yielded respective sensitivities/specificities of 63%/72% and 40%/72% compared with the new model, which had a sensitivity/specificity of 70%/72%.
Conclusions:
Our data indicate that simple healthcare and economic information such as ratio of family income to poverty can add value in deciding who is at risk of unknown diabetes by using extended investigations of predictor combinations.
Introduction
T
Inasmuch as screening entire populations is not cost-effective, priority in the screening process must rely on selecting those people at high risk for diabetes. 9,10 Several studies of diabetes screening have been published during the last decade. 2,11 Risk prediction or risk stratification models have a substantial potential to be utilized in a screening context in order to identify high-risk individuals who would subsequently undergo testing for diabetes. These models often include a combination of predictors, such as anthropometrics, lifestyle, hereditary conditions, and clinical measurements. 11 Multivariable statistical methods (i.e., logistic regression) are used to combine these risk predictors into a model. 11,12 Despite the large number of proposed models, not many are used in daily clinical practice. Optimal model performance is crucial for all tests. Most models are based on elimination of predictors with focus on statistical significance of the model, which may not yield optimal performance. 11 Cohort data obtained for a different scientific purpose are often used, and this can limit the models' use in an entire population. Furthermore, attempts are often made to construct models that present risk scores that reflect the complexity of the data, but that also may be perceived as simple and applicable in clinical practice. This is commonly done by collapsing continuous variables into two or more categories or preselecting predictors based on subjective judgment. 13 From a performance point of view, this may lead to an oversimplification and deterioration of the effectiveness of the proposed models. 14,15
In the present study, we investigated the feasibility and performance of a model based on extended predictive features and compared it with two widely accepted models.
Research Design and Methods
We used data from multiple years of the National Health and Nutrition Examination Survey (NHANES) (2005–2010), 16 where results from an oral glucose tolerance test (OGTT) and a fasting plasma glucose test were available to identify persons with undiagnosed diabetes using a logistic classification model.
The NHANES is a cross-sectional study conducted by the National Center for Health Statistics of the Centers for Disease Control and Prevention. To represent the U.S. population, NHANES uses complex, multistage probability sampling of the civilian, noninstitutionalized population. To produce reliable statistics, NHANES oversamples elderly persons and some racial and ethnic minorities. Participants aere limited to those 20 years of age and above. Pregnant women and participants with diagnosed diabetes are excluded. Based on these data, we developed and tested a new model for diabetes screening and compared it with two accepted screening models.
Selection of predictors to be included in this new model as well as validation of the model was done by V-fold cross-validation. We calculated all 16,383 possible combinations of predictors in order to find the optimal subset. We derived and tested the model on all combinations of nine (of 10) partitions of training data and one (of 10) partitions of test data. The accepted statistical methods ensured valid testing of the model performance, reducing generalization bias. 17,18
End point
Our primary objective was detection of undiagnosed diabetes (prevalence) in the cohort of NHANES. OGTT results of≥11.1 mmol/L or fasting plasma glucose of >7 mmol/L was used as a threshold for the diagnosis of diabetes. The American Diabetes Association recommends that a test result diagnostic of diabetes should be repeated to rule out laboratory error, unless the diagnosis is clear on clinical grounds. 19 Multiple test results were not available in our dataset, so one positive test was considered to be a diagnostic criterion.
Predictive variables
Multiple variables were selected to be investigated for their ability to distinguish between those without diabetes and those with undiagnosed diabetes. We selected several well-established risk factors, such as age, body mass index (BMI), and hereditary conditions, 20 –23 all available in the NHANES dataset. In addition, we selected several more uncertain predictors, such as self-perceived oral health, 24 which can be an early complication of diabetes, 25 and socioeconomic status in the form of income and educational level, which have been associated with diabetes-related mortality. 26
Possible predictor candidates were age, sex, family history of diabetes (yes/no) (questionnaire), history of hypertension (yes/no) (questionnaire), BMI, physical activity (yes/no) (questionnaire), waist circumference, educational level (questionnaire), income (questionnaire), race, self-perceived health (questionnaire), nicotine use (questionnaire), self-perceived dental condition (questionnaire), and blood pressure.
The NHANES questionnaire concerning physical activity was changed from 2006 to 2007 and forward. We considered the participants to be physically active if they answered “yes” to the following question: “Over the past 30 days, did you do any vigorous activities for at least 10 min that caused heavy sweating, or large increases in breathing or heart rate?” in the 2005–2006 cohort, or the question “Do you carry out any vigorous-intensity sports, fitness, or recreational activities that cause large increases in breathing or heart rate, like jogging or basketball, for at least 10 minutes continuously?” in the 2007–2010 cohort. Participants' family histories of diabetes were considered as binary without considering which family member had diabetes. Assessment of self-perceived oral health was formulated as “Rate the health of your teeth and gums” on a scale from 1 (excellent) to 5 (poor).
Missing data
We used multiple imputation to replace missing values. This imputation technique involves creating multiple copies of the data and replacing missing values with imputed values on the basis of a suitable random sample from their predicted distribution. Table 1 gives the distribution of missing values between variables included in the modeling. Multiple imputations allow patients with incomplete data to be included in analyses, thereby making full use of all available data and increasing precision and power without compromising validity. 27
Data are mean±SD or proportion of the group. Missing data describe the percentage of participants lacking information about a particular predictor.
NS, not significant.
Comparison with conventional models
Bang et al. 28 used data from NHANES 1999–2004 to model and develop a “patient self-assessment score” for use in a wide variety of community settings and clinical encounters (including patient waiting rooms or on the Internet) via a simple pencil-and-paper method. In brief, the model was compared with several other scoring systems and validated on a cohort of approximately 21,000 participants, with the primary end point being diagnosis of diabetes. The final model included variables of age, sex, obesity (BMI), history of hypertension, family history of diabetes, and physical activity predictors and was simplified for user-friendliness and presentation. Not many proposed models have been designed for and validated on an entire adult population (age >20 years). This is one advantage of using the model formulated by Bang et al. 28 as a foundation for comparison with our new model. In addition, we also used a model by Baan et al., 29 developed from a European Dutch population, for comparison. In brief, participants from the Rotterdam Study, 55–75 years old, not known to have diabetes, completed a questionnaire on diabetes-related symptoms and risk factors and underwent a clinical examination. The main finding from the evaluation of Baan et al. 29 was that the additional information from the questionnaire sparsely improved the prediction capability compared with using routinely collected data only.
We evaluated prediction models through sensitivity and specificity for predetermined cutoff points and receiver operating characteristics (ROC) based on logistic regression models comparing the area under the curve (AUC) of the new model with that of the sparser models proposed by Bang et al. 28 and Baan et al. 29 We used Student's t tests or z tests for proportions in order to compare the difference between the groups with and without diabetes.
Results
In total, 51 participants with diagnosed diabetes and 203 pregnant women were excluded. Thus, the study included a total of 5,398 participants. The cohort characteristics are given in Table 1. This cohort included 478 (8.8%, 478 of 5,398) patients with undiagnosed type 2 diabetes. Participants with undiagnosed diabetes had a tendency to be older, had a lower level of physical activity and a higher waist circumference and BMI, were less educated, earned less income, had less use of nicotine, and had a higher incidence of diabetes in their families than their counterparts without diabetes (P<0.05).
The final model, selected on the basis of performance from all possible combinations of predictors, was composed of BMI, waist circumference, age, history of hypertension, family history of diabetes, physical activity, education level, and race. Figure 1 presents the ROC curves for the two models. The established models had AUCs of 0.74 and 0.71, respectively, compared with an AUC of 0.78 (P<0.05 for both comparisons) for the new model. Table 2 presents sensitivity, specificity, positive predictive value, and negative predictive value at proposed cutoff points by Bang et al. 28 compared with the new model and the model of Baan et al. 29 with fixed specificity. For the cutoff point of 4 (risk score), the established models yielded sensitivities of 82% and 57%, respectively, 95% confidence intervals of 79.4%, 83.7% and 55.1, 58.5%, respectively, and a specificity of 56% for both. The new extended model yielded a sensitivity of 85% with 95% confidence interval (83.1%, 87.6%) when the specificity was maintained at the same level.
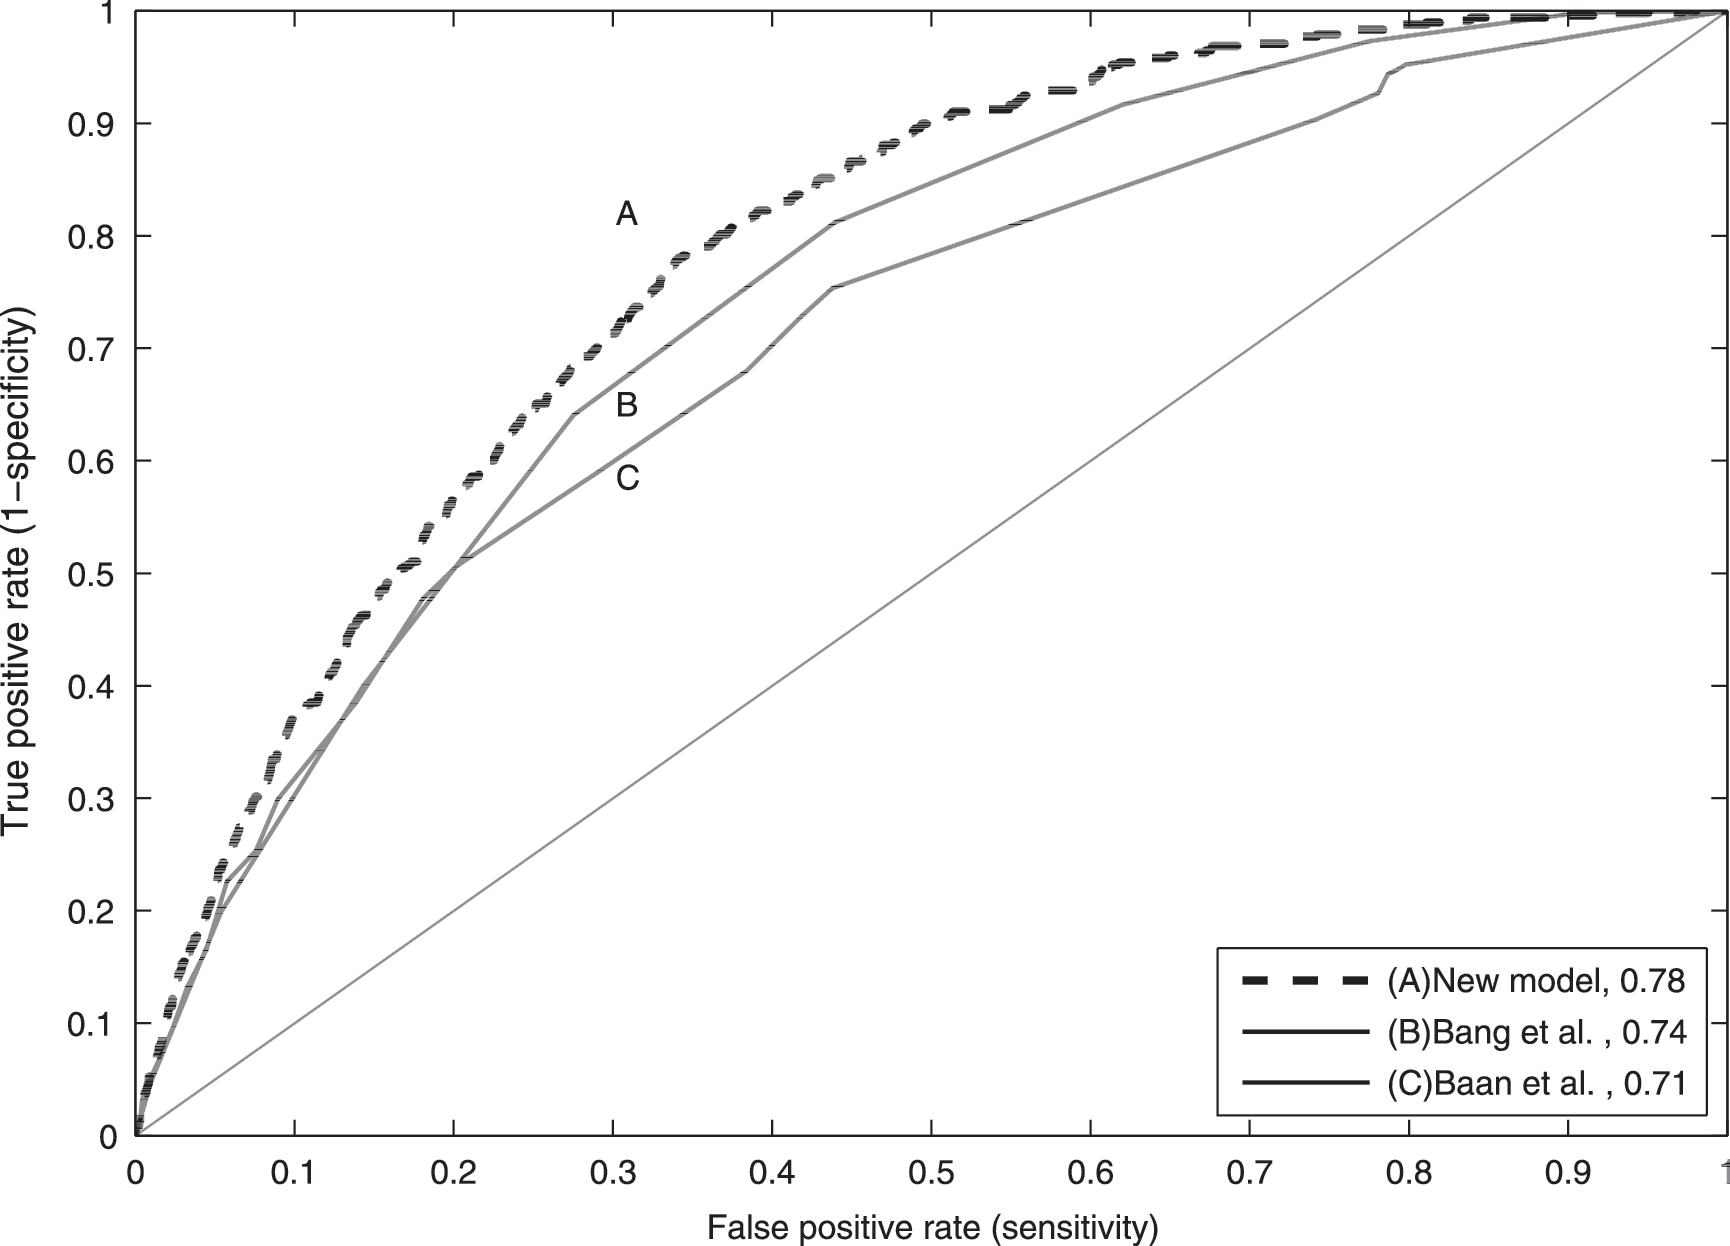
Receiver operating characteristics curve for the detection of undiagnosed type 2 diabetes: curve A, logistic model including age, sex, family history of diabetes, history of hypertension, body mass index, degree of physical activity, waist circumference, education level, income, race, health, nicotine use, dental condition, and blood pressure; curve B, Bang et al.28 screening score (1–10), based on age, sex, family history of diabetes, history of hypertension, body mass index, and physical activity; and curve C, Baan et al. 29 screening score, using age, antihypertension medication, body mass index, and gender as predictors and the oral glucose tolerance test or fasting plasma glucose as the reference standard.
Sensitivity, specificity, positive predictive value (PPV), and negative predictive value (NPV) for different cutoff points were calculated. Sensitivities are shown with 95% confidence interval.
For the cutoff point of 5 (risk score), the established models yielded a sensitivity of 63% (61.7%, 65.1%) and 42% (40.7%, 42.9%), respectively, and a specificity of 72%. The new model yielded a sensitivity of 70% (68.2%, 71.9%) when the specificity was held at the same level. The new model thus yields better sensitivity at both cutoff points. The increased sensitivity from the new model corresponds to discovering 33 additional patients with diabetes compared with Bang et al. 28 and an additional 129 patients compared with Baan et al. 29 when the cutoff point of 5 (risk score) is used in the population sample.
The total computation time for all predictor combinations for the new model took approximately 8 h on a standard laptop (Dell, Round Rock, TX) (Intel® [Santa Clara, CA] Core i5-2410 CPU with 2.30 GHz, 4 GB RAM, 64-bit) using a self-written algorithm (MATLAB® R2011b; Mathworks, Natick, MA).
Discussion
Numerous diabetes prediction models have been developed over the years, 2,11 –13,28 –31 and most studies use modeling approaches focusing on simplicity and statistical selection of predictors rather than performance. Most studies also use specific cohorts, which often exhibit small age ranges or racial/ethnic origin groups, thus limiting their generalizability to an entire population. We explored whether an extended investigation of predictor combinations could lead to better performance in a diabetes screening model for a population of people over 20 years of age.
Our results show that information about education level, racial/ethnic origin, and waist circumference can significantly improve sensitivity and specificity of an established model when screening for diabetes by using a full investigation of possible predictor combinations. Using this kind of information can help reduce unwarranted screening for type 2 diabetes, thus lowering costs 10 of performing additional test such as glycosylated hemoglobin/OGTT for high-risk persons. Waist circumference and/or BMI have been used in most models, 12,13,28 –31 as has racial/ethnic origin, which is not surprising, as we know that racial differences are associated with the development of diabetes in some groups. 32 To our knowledge, information about education level has not been used in screening models, possibly because this kind of data is related to diabetes through lifestyle. Overall, however, it seems sensible to include this information. Saydah and Lochner 26 have shown that having less than a high school education was related to a twofold higher mortality from diabetes, after controlling for gender, age, ethnicity, marital status, and BMI.
The performance of the established model by Bang et al. 28 in the present cohort was different from that originally reported when we examined it on our cohort. The cutoff point was ≥4 (risk score), and sensitivity and specificity were reported between 91% to 97% and 38% to 51%. Our validation yielded sensitivity and specificity levels of 82% and 56%, respectively. The major difference between the studies was that we used a diagnostic criteria based on fasting plasma glucose and OGTT, whereas the Bang model used only fasting plasma glucose, possibly because OGTT was only available in one of the two validation datasets. From the perspective of the ROC, the model by Baan et al. 29 performed equal to that of Bang et al. 28 for specificities above 80%. Below this threshold, however, the performance of the model of Baan et al. 29 model is inferior. This model was originally developed and validated in a cohort 55 years of age and older, which might explain the poor performance of the algorithm on a cohort that used an entire adult population.
These findings highlight the difficulties of comparing results across different population samples, even when identical underlying sample techniques are used. Models generally perform best on the data for which they have been developed, and they perform better on a training dataset than on a validation dataset. 18 We used the accepted cross-validation approach, which is basically an average of the performance of multiple models. 17,18 Our main concern when using this approach is the representativeness of the participants included in the study. NHANES uses complex, multistage probability sampling of the civilian, noninstitutionalized population to create a realistic and representative sample of the U.S. population. Participants included in this study had an undiagnosed diabetes prevalence of 8.8%, which is significantly higher than the estimates from the International Diabetes Federation, which cites 2.6–3.4% of the U.S. population. 33 Although our cohort is believed to be representative of the U.S. population, it should be emphasized that elderly persons and some racial and ethnic minorities, with higher prevalence of diabetes, have been oversampled in the NHANES. However, the comparison of our new model with the established models tested under similar conditions is valid, without a potential bias from the sampling. Several other studies have used (earlier) versions of the NHANES for the purpose of developing a diabetes screening model. 28,32
Our end point was undiagnosed diabetes by definition, although incidence prediction of diabetes and people with impaired glucose tolerance, also known as prediabetes, was beyond the scope of this study. In many respects, however, these issues are similar to those we have investigated. Hence, we believe our approach could add to these models as well. 34 For a model to have generalizability over time and to other populations, the model needs to be validated precisely with respect to these factors. 18 Further validation of our screening approach with other samples and for other uses is therefore important.
When developing models to predict undiagnosed diabetes, it is necessary to maintain a balance between including too many model variables and too few. 35 Automated variable selection methods have been used in most studies involving prediction of diabetes. Collins et al., 11 in a systematic review of diabetes prediction, showed that 56% of the studies used automated variable selection to develop their model. These methods are suitable for prespecified hypothesis testing, but in a predictive/classification approach, where performance is the goal, these techniques may not always yield optimal performance and in some cases may also create unstable models. 36
The artificial simplicity presented in most models developed over the last decade is based on the belief that simplicity is the key in implementing a model successfully and in ensuring that it is accepted widely. Nevertheless, almost all models could easily be implemented in a standard Web page and made available for clinical use or to the public and still maintain the complexity without oversimplification. Our findings, based on a relatively large dataset of 5,398 participants encompassing 14 variables, showed that it is feasible to do a full investigation of the optimal subset of predictors to be included in the model. It should be noted, however, that in more complex datasets focusing on classification, elimination methods from machine learning can be used with success in a medical context. 37 In brief, machine learning concerns the development and study of systems that can learn from data.
We have shown how simple healthcare and economic data (such as ratio of family income to poverty) can help determine who is most at risk for undiagnosed diabetes. We have also shown that a calculation of all possible predictor combinations is feasible and can improve the performance of the predictive model.
Footnotes
Author Disclosure Statement
No competing financial interests exist.