
Abstract
Background:
Color affects emotions, feelings, and behaviors. We hypothesized that color used in self-monitoring of blood glucose (SMBG) is helpful for patients to recognize and act on their glucose levels to improve glycemic control. Here, two color-indication methods, color record (CR) and color display (CD), were independently compared for their effects on glycemic control in less frequently insulin-treated type 2 diabetes.
Subjects and Methods:
One hundred twenty outpatients were randomly allocated to four groups with 2×2 factorial design: CR or non-CR and CD or non-CD. Blood glucose levels were recorded in red or blue pencil in the CR arm, and a red or blue indicator light on the SMBG meter was lit in the CD arm, under hyperglycemia or hypoglycemia, respectively. The primary end point was difference in glycated hemoglobin (HbA1c) reduction in 24 weeks. Secondary end points were self-management performance change and psychological state change.
Results:
HbA1c levels at 24 weeks were significantly decreased in the CR arm by −0.28% but were increased by 0.03% in the non-CR arm (P=0.044). In addition, diet and exercise scores were significantly improved in the CR arm compared with the non-CR arm. The exercise score showed significant improvement in the CD arm compared with the non-CD arm but without a significant difference in HbA1c reduction. Changes in psychological states were not altered between the arms.
Conclusions:
CR has a favorable effect on self-management performance without any influence on psychological stress, resulting in improved glycemic control in type 2 diabetes patients using less frequent insulin injection. Thus, active but not passive usage of color-indication methods by patients is important in successful SMBG.
Background
S
It is unclear why SMBG has no distinct effect on glycemic control for type 2 diabetes patients with less frequent insulin injection. However, a higher frequency of SMBG tests is associated with improved glycemic control in patients with type 1 diabetes 5 and also with type 2 diabetes. 6 The low frequency of SMBG tests in patients using less frequent insulin injection might be a factor in the observed lack of improved glycemic control. SMBG is more helpful in diabetes management and glycemic control in conjunction with comprehensive self-care education, skills training, and ongoing support for patients. 4,7 However, many patients, especially those with less frequent SMBG, take no action when their SMBG meter displays hyperglycemia or hypoglycemia. 8 The unmet need of SMBG is to find a simpler, more efficient, and more economical method of promoting improvement in self-management and glycemic control.
To address this issue, we compared two separate color-indication methods: color record (CR) and color display (CD), both of which add color to emphasize high or low blood glucose levels in SMBG. Color is known to directly affect emotions, feelings, and behaviors in humans. It motivates different cognitive learnings: red produces avoidance motivation and enhances detail-oriented task; blue produces approach motivation and enhances creative task. 9,10 We show here that CR has a favorable effect on self-management performance without any influence on psychological stress, resulting in improved glycemic control mostly due to an increase in motivation for exercise and diet.
Research Design and Methods
Participants
This study, called the Color IMPACT study (Color in SMBG Improves self-management Performance by Approaching Cognitive Transmission), is a prospective, randomized, controlled, single-center, open trial with a 2×2 factorial design to evaluate the effect of two color-indication methods used in SMBG—CR and CD—on glycemic control in type 2 diabetes patients. Outpatients at Kyoto University Hospital (Kyoto, Japan) were recruited. Inclusion criteria were type 2 diabetes with insulins, ongoing SMBG, age between 20 and 80 years old, glycated hemoglobin (HbA1c) levels between 7.0% and 10.5%, and ability to diet and/or exercise. Exclusion criteria were diabetes duration of <1 year, initiation or treatment change with insulin or glucagon-like peptide-1 receptor agonists within 4 months, SMBG operated by other persons, severe comorbidities (e.g., severe cardiovascular disease, liver and renal disorders, malignancy), depression or psychiatric problems, impaired vision or synesthesia, abnormal hemoglobinemia, pregnancy, inability to follow trial procedures, or patients unsuitable for this study as judged by physicians. The study protocol was approved by the Institutional Review Board of Kyoto University Hospital (protocol number E1332) and is in compliance with the Helsinki Declaration. Written informed consent was obtained from all subjects.
Procedures
The study duration was 24 weeks. The subjects were assigned according to a 2×2 factorial design to one of four groups (Fig. 1): (A) no CD and no CR group, (B) no CD and CR group, (C) CD and no CR group, and (D) CD and CR group with a randomly generated allocation code using balanced design (age, gender, HbA1c, diabetes duration, and the number of SMBG tests) in consecutively numbered sealed envelopes.

The 2×2 factorial design and the number of subjects in each group and arm. BG, blood glucose.
All of the subjects visited the hospital every 4 weeks, and laboratory data including HbA1c, frequency of SMBG tests, and all documented medications were collected at 0, 4, 12, and 24 weeks. Subjects completed a questionnaire on self-management performance and psychological states at 0, 4, 12, and 24 weeks. Physicians-in-charge also filled in an original questionnaire about SMBG at 0 and 24 weeks.
Six diabetologists and three certified diabetes nurses participated in the study; the concepts and methods of the study were all learned in the same manner by all participants.
Intervention
All subjects were newly provided with a blood glucose meter (OneTouch® Ultra Vue™; Johnson & Johnson K.K., Tokyo, Japan) and instructed by one of the three nurses at enrollment. The subjects were requested to use the meter and record blood glucose levels manually in self-monitoring notes during the study.
The OneTouch Ultra Vue emphasizes blood glucose levels with five color-indicator lights (red, orange, green, light blue, and blue), which appear in a rectangle shape (4.5 mm tall×14.5 mm wide) under blood glucose value in black numbers (14 mm tall×6–10 mm wide) on a display screen (42 mm tall×33 mm wide) with white background for 180 s. In Groups C and D, red, orange, green, light blue, and blue are shown when blood glucose levels are ≥8.9 mmol/L (160 mg/dL), 7.3–8.8 mmol/L (131–159 mg/dL), 5.0–7.2 mmol/L (90–130 mg/dL), 3.9–4.9 mmol/L (71–89 mg/dL), and <3.8 mmol/L (70 mg/dL), respectively (CD arm) (Fig. 1). However, the indicator lights were turned off, and blood glucose levels were shown just in black on the meter for Groups A and B (non-CD arm).
Self-monitoring notes are provided by the Japan Association for Diabetes Education and Care and commonly used by patients to record blood glucose levels in Japan. In the study, subjects in Groups A and C recorded their blood glucose levels on the note manually in black pencil (non-CR arm). Groups B and D recorded their blood glucose levels in black and marked them with red or blue pencils when their glucose levels were ≥8.9 mmol/L (160 mg/dL) or <3.8 mmol/L (70 mg/dL), respectively (CR arm) (Fig. 1).
Measurements
The primary end point was difference in HbA1c reduction in 24 weeks between the CR (B+D) and non-CR (A+C) arms and the CD (C+D) and non-CD (A+B) arms. The secondary end points were differences in self-management performance change and psychological state change and the difference in HbA1c reduction in 24 weeks in treatment-unchanged subjects. Self-management performance was evaluated by the Summary of Diabetes Self-Care Activities Measure (SDSCA). 11 The higher mean scores by subscales indicate the higher level of each self-care practice. Psychological states were measured using a validated, abridged version of Profile of Mood States (POMS). 12 SDSCA was used to determine the effect of color on self-management performance, and POMS was performed because SMBG is reported to be associated with depression. 13 We also examined physicians' attitude to SMBG because lack of physicians' interest in the results of SMBG decreases motivation of patients. 14 The original physician questionnaire consisted of four closed questions with a 5-point Likert scale from 0 (“not at all”) to 4 (“extremely”): physician's satisfaction with the physician–patient relationship; sharing a common goal for glycemic control with patients; usefulness of SMBG for physicians in glycemic control; and usefulness of SMBG for patients in glycemic control. All questionnaires were administered by certified diabetes nurses.
Statistical analysis
To examine the primary end point, the independent-samples Student's t test was used. The dependent-samples Student's t test was used to compare the means of HbA1c levels between baseline and 24 weeks in the CR, non-CR, CD, and non-CD arms. Similarly, the independent-samples Student's t test was used to compare the change in the score on diet subscale of the SDSCA, the change in the score on all subscales of the POMS, and the change in HbA1c levels in 24 weeks in treatment-unchanged subjects. The Mann
Results
Subjects
One hundred twenty subjects were enrolled in the study and randomized to one of four groups: Group A, n=31; Group B, n=27; Group C, n=29; and Group D, n=33. These four groups were structured for the factorial design: a non-CR arm consisting of Groups A and C; a CR arm consisting of Groups B and D; a non-CD arm consisting of Groups A and B; and a CD arm consisting of Groups C and D (Fig. 1). The mean±SD age was 66.8±9.9 years old, 40.6% of the subjects were female, the diabetes duration was 17.7±9.3 years, the mean HbA1c level was 7.88±0.85%, the SMBG frequency was 2.04±0.95 times per day, and the frequency of insulin injection was 2.16±1.09 times per day. There was no significant difference in demographic data of the subjects at the baseline among the four arms (Table 1). No significant differences were found in the socioeconomic status or levels of education between arms (data not shown). One hundred one of the 120 subjects (84.2%) completed the study. Nine subjects (15.0%) in the non-CR arm, 10 (16.7%) in the CR arm, nine (15.5%) in the non-CD arm, and 10 (16.1%) in the CD arm were dropped because of hospitalization for diabetes and comorbidities, with no significant difference among the arms.
Data are mean±SD values.
CD, color display; CR, color record; HbA1c, glycated hemoglobin; SMBG, self-monitoring of blood glucose.
HbA1c findings
HbA1c levels (mean±SE) were significantly decreased in the CR arm by −0.28±0.12% (from 7.92±0.12% to 7.64±0.15%, P=0.018) but were increased by 0.03±0.10% in the non-CR arm (from 7.84±0.12% to 7.87±0.16%, P=0.783) at 24 weeks (Fig. 2A and C). The change in HbA1c levels in 24 weeks between the CR and non-CR arms was significantly (P=0.044) different at −0.31% (95% confidence interval, −0.61 to −0.01). On the other hand, HbA1c levels were not significantly decreased, from 7.95±0.12% to 7.81±0.16% (P=0.191) in the CD arm and from 7.81±0.12% to 7.70±0.15% (P=0.334) in the non-CD arm in 24 weeks (Fig. 2B). The change in HbA1c level in 24 weeks was −0.14±0.10% in the CD arm and −0.11±0.12% in the non-CD arm with no significant difference (P=0.866) between the arms (−0.03%; 95% confidence interval, −0.33 to 0.28) (Fig. 2D). Correlation between change in HbA1c and the number of SMBG tests (times per day) was not found in the CR arm (Pearson's product-moment correlation coefficient=–0.050, P=0.728) (data not shown). The other factors such as age, sex, socioeconomic status, and education levels did not affect the difference in change in HbA1c between the CR and non-CR or the CD and non-CD arms.
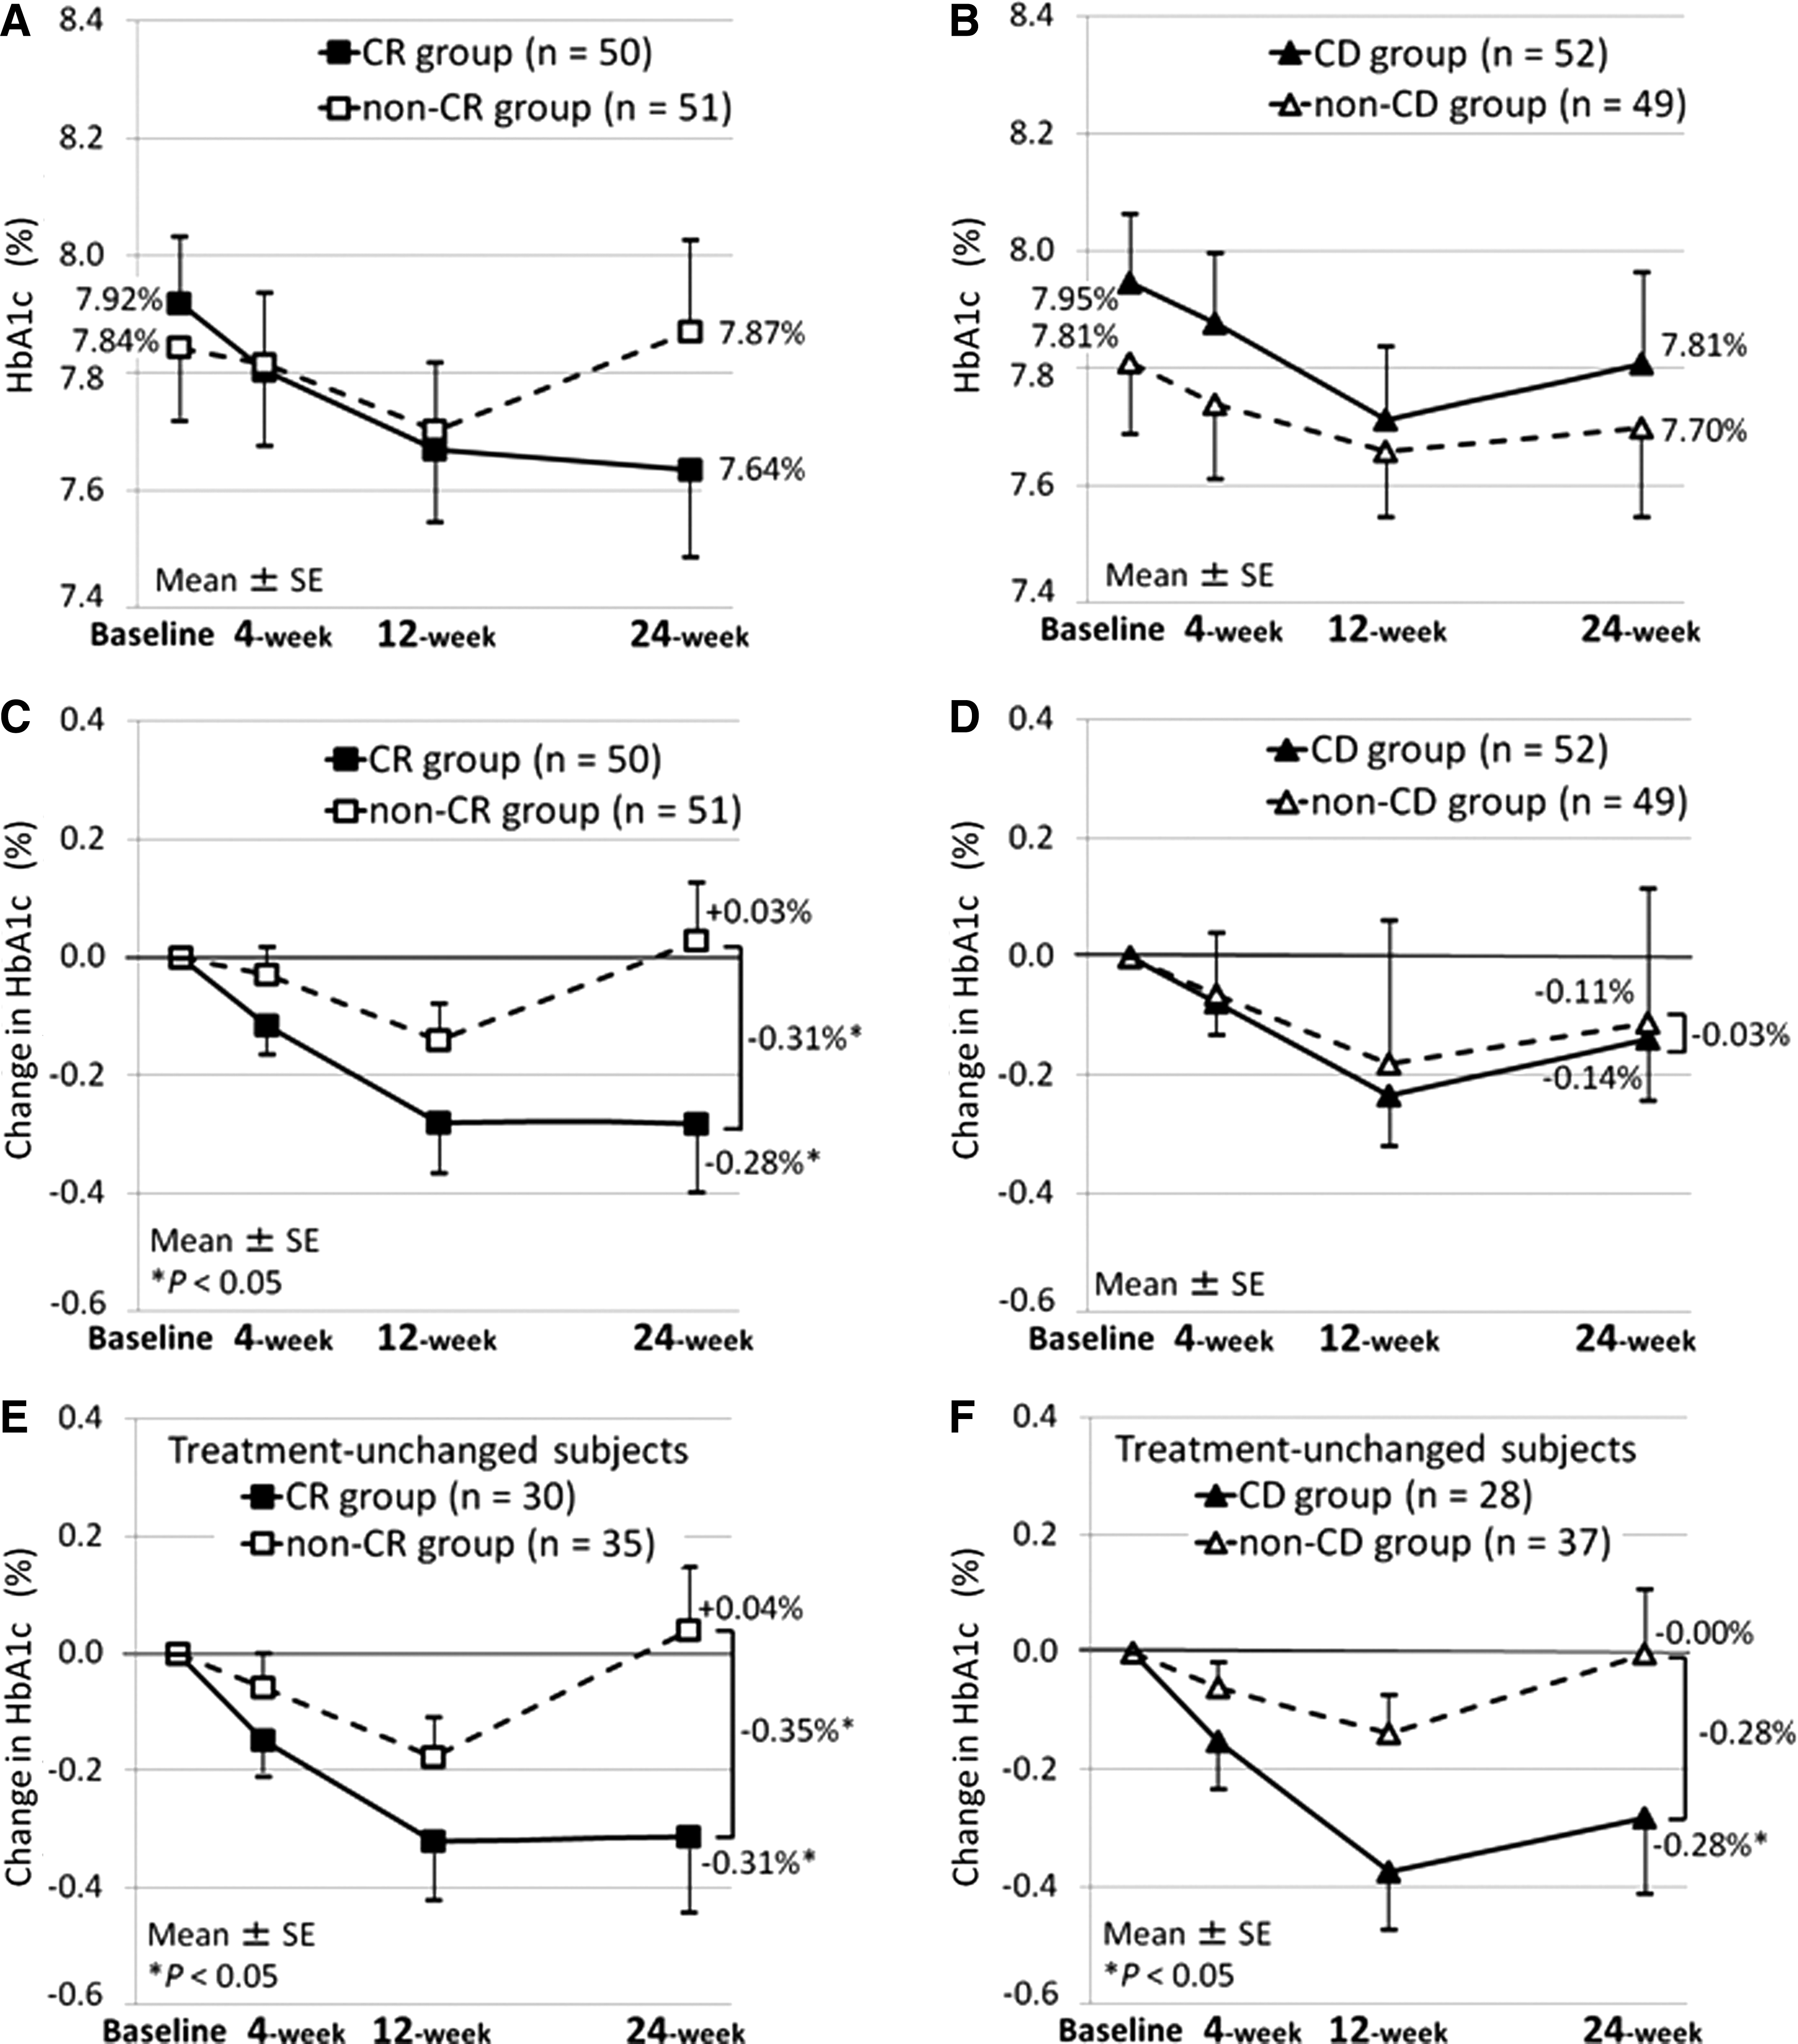
Glycated hemoglobin (HbA1c) levels during the study.
Treatment-unchanged subjects also were analyzed for the effect of color on glycemic control. In these subjects, a significant change in HbA1c level at 24 weeks was observed in the CR arm compared with that in the non-CR arm (−0.31±0.13% [P=0.021] vs. 0.04±0.11% [P=0.715]) (Fig. 2E). The difference in change in HbA1c level between the CR and non-CR arms was −0.35% (95% confidence interval, −0.69 to −0.02; P=0.038). On the other hand, changes in HbA1c level in 24 weeks were −0.28±0.13% in the CD arm (P=0.037) and 0.00±0.11% in the non-CD arm (P=0.981) (Fig. 2F). The apparent difference in change in HbA1c level between the arms was not significant (−0.28%; 95% confidence interval, −0.62 to 0.06; P=0.106).
Self-management performance
There were no statistically significant differences in the baseline scores on diet, exercise, and medication subscales of the SDSCA between the CR and non-CR arms and between the CD and non-CD arms (Table 2). Scores on the diet and exercise subscales of the SDSCA in 24 weeks were significantly increased in the CR arm compared with those in the non-CR arm. The change in diet subscale score (mean±SE) was 0.21±0.15 points in the CR arm and −0.23±0.16 points in the non-CR arm. The difference in change in diet scores between the CR and non-CR arms was 0.44 points (95% confidence interval, 0.01 to 0.87; P=0.043). Median change in exercise subscale score in 24 weeks was 0.50 (interquartile range, −1.00 to 1.00) points in the CR arm and 0.00 (interquartile range, −1.00 to 1.00) points in the non-CR arm with a significant difference between the arms (P=0.045).
Diet data are mean±SE values. Exercise and medication data are median (interquartile range) values. Values for the physician's questionnaire are number (percentages).
P<0.05 was considered to indicate a significant difference.
Question 1 was physician's satisfaction with the physician–patient relationship; Question 2 was sharing a common goal for glycemic control with patients; Question 3 was usefulness of self-monitoring of blood glucose for the physician in glycemic control; and Question 4 was usefulness of self-monitoring of blood glucose for the patient in glycemic control.
CD, color display; CR, color record; SDSCA, Summary of Diabetes Self-Care Activities Measure.
Median change in the score on exercise subscale in 24 weeks was 0.50 (interquartile range, −0.50 to 1.00) points in the CD arm and±0.00 (interquartile range, −2.00 to +0.50) points in the non-CD arm. The difference between the arms was statistically significant (P=0.045), but there were no significant differences in change in the scores of diet (P=0.696) and medication (P=0.095) subscales between arms. The change in medication subscale score was similar between each of the two arms (CD vs. non-CD, P=0.095; CR vs. non-CR, P=0.095) (Table 2).
Psychological states
The baseline scores on all subscales of POMS in each arm were within the normal range. There were no significant differences in all subscale scores at baseline and at 24 weeks between the CR and non-CR arms and between the CD and non-CD arms (data not shown).
Physicians' perspectives on SMBG
There were no significant differences in all questions between each of the two arms at baseline. With regard to Question 2 (sharing a common goal for glycemic control with patients), the scores were improved at 24 weeks from baseline by 26.0% in the CR arm and by 9.8% in the non-CR arm with a significant difference between the arms (P=0.033). However, a significant difference was not found between the CD arm (15.4%) and the non-CD arm (20.4%) (P=0.510) (Table 2). There were no significant differences in the other three questions at 24 weeks between the two arms.
Discussion
The goal of the present study was to ascertain whether or not two color-indication methods used in SMBG—CR and CD—improved glycemic control through an increase in self-management performance in less frequently insulin-treated type 2 diabetes patients. We hypothesized that color-indication methods might motivate patients to recognize hyperglycemia and hypoglycemia and to begin problem-solving behavior. However, only CR has a favorable effect on glycemic control, through motivation to diet and exercise.
Correlation of change in HbA1c level and number of SMBG tests was not found in the CR arm. In addition, the number of SMBG tests was similar between the CR and CD arms. It is important in SMBG usage not to merely check blood glucose levels more frequently, but also to take action on the findings. Recording their blood glucose levels in blue or red can facilitate patients' change of behavior, as motivation to diet and exercise was increased during the study. On the other hand, although motivation to exercise was increased, glycemic control was not improved in the CD arm. Even though hyperglycemia and hypoglycemia are emphasized on the SMBG meter in the CD arm, the information did not always cause behavioral changes. These results suggest that active but not passive usage is important in successful SMBG.
Action by patients is a key to improve glycemic control in type 2 diabetes treated less frequently with insulin injection. SMBG is recognized as one tool for such self-management. However, it has been reported that many patients often do nothing when blood glucose levels are high or low when using the existing noncolor method of SMBG. 8 Furthermore, physicians' lack of interest in the results of SMBG decreases motivation of patients. 14 However, in our study, sharing a common goal for glycemic control was increased in the CR arm compared with the non-CR arm, indicating that CR in SMBG can be beneficial in promoting mutual understanding and partnership between patients and healthcare professionals. As a result, self-management performance and HbA1c levels were improved in the CR arm not only of all subjects but also of treatment-unchanged subjects.
Change in psychological states was not observed in either arm of the present study. The ESMON study showed that SMBG was associated with higher scores on depression when newly diagnosed diabetes patients were reviewed by healthcare professionals at a long-term interval (3 months). 13 On the other hand, SMBG with adjuvant counseling at 0, 4, 12, and 20 weeks resulted in improvements for general well-being and depression. 15 In our study, all subjects were reviewed by nurses at 0, 4, 12, and 24 weeks in addition to regular monthly assessment by physicians. All subjects were free to ask the nurse's advice at any time. Reassurance is a key for continued self-monitoring. 14 Subjects in our study showed a sense of reassurance and were not distressed by poor results of SMBG.
The potential weakness of this study is that this was a single-center trial and that the sample size is too small to determine whether the combination of CR and CD is more effective for glycemic control than CR alone. However, subanalysis suggested that CR alone has a more favorable effect on glycemic control compared with combination of CR and CD (data not shown), implying that too much information for patients may not necessarily improve motivation to life-style modification and glycemic control. Further studies are needed to clarify which patients are more likely to benefit from CR, CD, and other methods of SMBG.
In summary, CR has a favorable effect on self-management performance without any influence on psychological stress and results in improved glycemic control in less frequently insulin-treated type 2 diabetes patients. Our results indicate that providing medical care and educational aid are not always helpful for self-management; however, this might not be limited to SMBG usage. Maintenance of a balance of intervention between patients and healthcare professionals is important for optimized self-management.
Footnotes
Author Disclosure Statement
No competing financial interests exist. The study conception and protocol were performed by A.N., S.H., I.H., K.H., and N.I. Subject training was performed by A.N., I.H., and Y.S. Statistical analysis was performed by N.H., K.N., and A.H. Manuscript development was performed by A.N., S.H., I.H., K.H., and N.I.