




Abstract
Background:
A feasibility version of the GlucoClear™ continuous glucose monitoring system (Edwards Lifesciences, Irvine, CA), the intravenous blood glucose (IVBG) system, developed to facilitate glycemic management, was evaluated.
Materials and Methods:
Two pilot studies were conducted. Ten volunteers with diabetes (1,725 matched pairs) and 10 patients scheduled for intensive care unit (ICU) admission following surgery (1,393 matched pairs) were studied. The patients' blood glucose concentrations were monitored by the IVBG system every 5 min for up to 72 h. The accuracy of the IVBG system was calculated and compared with the Yellow Springs Instrument (YSI) (Yellows Springs, OH) and Radiometer (Copenhagen, Denmark) measurements to determine the percentage of matched pairs that met 15/20%, 10/15%, 12/12.5%, and 10/10% assessment criteria. Performance was calculated as the percentage of the total measurements that would have been displayed in an unblinded study. Adverse events were monitored.
Results:
The accuracy of the IVBG system met the International Organization for Standardization ISO 15197 15/20% criterion (99.07% in volunteers, 99.43% in the ICU, and both vs. YSI) and the stricter 10/15% criterion (96.17% in volunteers, 96.77% in the ICU, and both vs. YSI) over the 72-h period and across a broad range of blood glucose concentrations. Performance was 89.97% in the ICU study. The adverse device effects included induration of the peripheral vein, mild bruising, and mild hematoma. In the volunteers, there were patency problems with six catheters.
Conclusions:
The IVBG system is safe, accurate, and reliable. This minimally invasive system was not affected by potentially interfering medications. Real-time measurements, alarms, and trends provided by the IVBG system might support glycemic control protocols and prevent glycemic events in critically ill patients.
Background
D
When intermittent measurements are performed to achieve glycemic control, the workload is increased, and events between measurements may be missed. A BG measuring device that combines the advantages of blood gas analysis (accuracy and reliability) with the advantages of POC devices (rapid bedside result with a minimal workload) would be a step toward adequate glycemic control in clinical practice.
Two nonrandomized, nontreatment, masked pilot studies were conducted to evaluate a continuous intravenous (IV) BG monitoring (IVBG) system (GlucoClear™ Gen2 Alpha System, model EV910MCL; Edwards Lifesciences, Irvine, CA). The aim of these studies was to evaluate the accuracy, reliability, safety, and resistance to interferences of the IVBG system.
Materials and Methods
The In-Clinic study enrolled otherwise healthy volunteers with diabetes (n=10) in the Onze Lieve Vrouw Research Unit, a research clinic for Phase 1 studies, in December 2011. The intensive care unit (ICU) study enrolled postoperative intensive care patients (n=10) in January–February 2012. Both studies were performed at the Onze Lieve Vrouw Hospital (Aalst, Belgium) with the Onze Lieve Vrouw ethics committee's approval. Each subject gave written informed consent prior to study enrollment.
The IVBG system
The first generation of the IVBG system has been described in detail elsewhere. 10 The IVBG system includes a bedside monitor with an integral flow control device, proprietary glucose oxidase sensor, indwelling 20-gauge peripheral IV catheter, patient cable, pressure cable, tubing set, and disposable pressure transducer (Fig. 1). The IVBG system monitors the patient's BG level every 5 min for up to 72 h by aspirating 31 μL of blood over the sensor and pushing it back with a reference solution that has a known dextrose concentration. The glucose concentration of the reference solution is measured before connecting the IVBG system to the patient. This value is then entered into the IVBG system and is used for ex vivo calibration of the system. The reference solution was not heparinized.
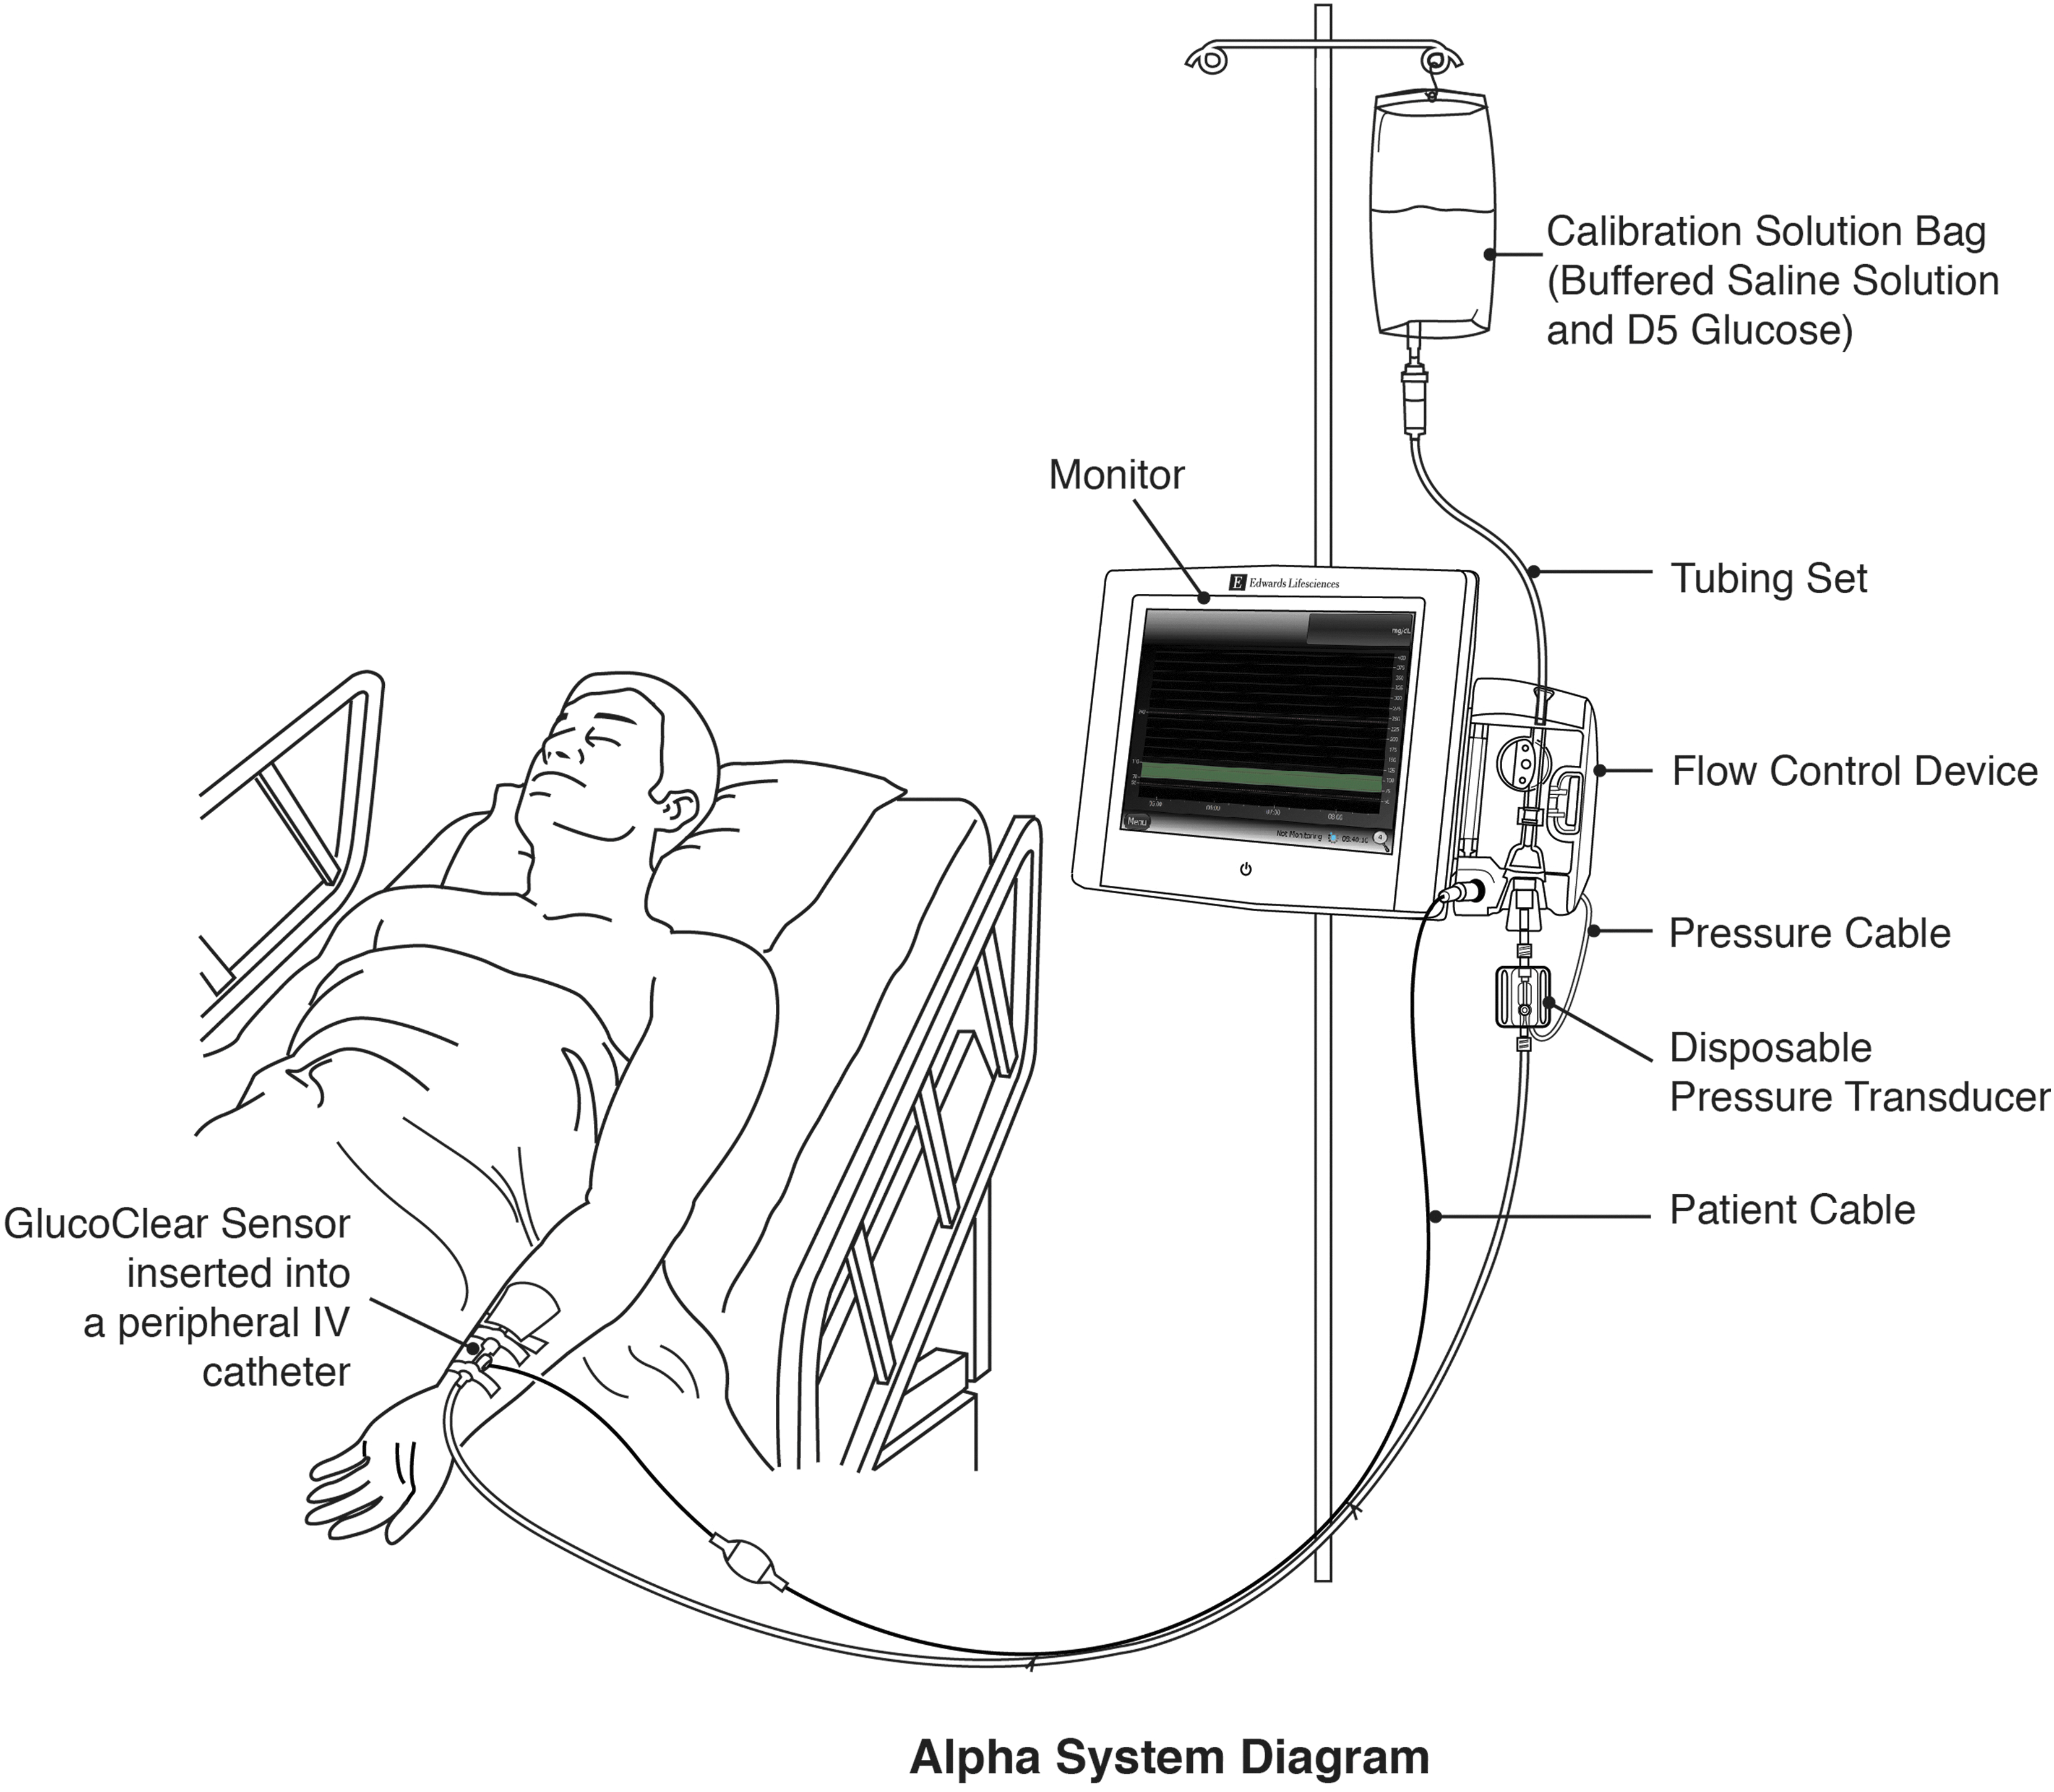
The GlucoClear intravenous (IV) blood glucose system and sensor. The IV blood glucose system includes a monitor with a flow control device, peripheral IV sensor, tubing set, pressure cable, disposable pressure transducer, and patient cable. The calibration solution bag and peripheral IV catheter are necessary accessories for the IV blood glucose system. D5 glucose, 5% dextrose in water.
Each 5-min cycle consists of a measurement phase and a reference phase. During each reference phase, the system is automatically calibrated with the reference solution.
The IVBG system used in these studies differs from the first generation 10 based on improvements to usability and the addition of a pressure sensor and sampling line. The sensor technology is functionally equivalent to the first generation.
In both studies, the glucose oxidase sensor was inserted into a 20-gauge catheter in a peripheral vein in each subject's forearm. This catheter was exclusively dedicated to continuous monitoring. The IVBG system monitored the subject's BG level every 5 min for up to 72 h, after which the sensor was removed. As per protocol, a follow-up telephone call or visit was planned 7 (±3) days after sensor removal. A follow-up telephone call or visit occurred 7 (±3) days after sensor removal.
In-Clinic study
Participants were adult (≥18 years of age) males or females with type 1 or type 2 diabetes who were insulin dependent and on multiple daily injections or continuous subcutaneous insulin therapy. Their carbohydrate intake and insulin dosing were adjusted to obtain samples across the entire reportable range of the IVBG system (40–400 mg/dL), using YSI values as the control values. Subjects adhered to their usual insulin therapy requirements except during carbohydrate and insulin dosing to allow for collection of BG values across the reportable range of the IVBG system. The BG measurements from the IVBG system were masked (i.e., real-time BG values, trend graphs, and BG alerts). Decisions on daily insulin treatment were based on the subject's POC devices.
Exclusion criteria were as follows: restricted peripheral venous access; a history of heparin-induced thrombocytopenia or a contraindication for heparin, bleeding disorder, or the administration of prescription anticoagulants; a history of congestive heart failure, hyperkalemia, chronic renal failure, or severe renal insufficiency; severe metabolic acidosis or respiratory alkalosis; severe liver disease; or an anoxic state that affects lactate metabolism and pregnancy. Because of safety concerns, we have chosen volunteers who were as healthy as possible, apart from their diabetes status, to participate in this pilot study.
ICU study
Patients in the ICU study were scheduled to undergo elective surgery with an anticipated ICU stay of at least 24 h. During their stay, the subjects' BG levels were tightly controlled using an IV insulin regimen according to the hospital's standard of care with a BG target of 80–110 mg/dL. Therefore, there was no assurance that adequate data would be collected across all measurable BG ranges (40–400 mg/dL). Medications administered as the standard of care were recorded during the 72-h monitoring session and for 24 h before sensor insertion. Measurements from the IVBG system were masked (i.e., real-time BG values, trend graphs, and BG alerts), and subjects were not treated based on the IVBG system results.
The exclusion criteria from the In-Clinic study also applied to the ICU study, as well as organ transplant procedures, brain injury, or scheduled brain surgery.
Reference samples (both studies)
Reference samples of blood were drawn every 15 min from a sampling catheter in a peripheral vein in the contralateral arm relative to the IVBG system catheter, and they were measured on the Yellow Springs Instrument (Yellow Springs, OH) YSI 2300 Stat Plus™ and Radiometer (Copenhagen, Denmark) model ABL800. The reference samples were taken at a maximum frequency of four times per hour with no more than 25 samples in a 24-h period. Each comparative sample was split between the YSI and Radiometer devices.
End points
The end points were similar in both studies.
System performance
Four analyses of the system performance (comparison with accuracy criteria, absolute and absolute relative differences, ordinary least squares, and sensor stability over time) were calculated. YSI measurements were obtained every 15 min, but the IVBG system BG was measured every 5 min. To create a matched pair, YSI measurements were linearly interpolated to estimate the YSI measurement every 5 min and were then matched to the corresponding IVBG system BG measurement. The same linear interpolation was performed to match the Radiometer with IVBG measurements.
Analyses were performed to estimate the system performance. The accuracy of the IVBG system versus YSI was compared with the percentage of BG values from the IVBG system that met 15/20%, 10/15%, 12/12.5%, and 10/10% assessment criteria as follows: • 15/20%: proportion of the IVBG system BG values meeting within ±15 mg/dL of the YSI BG values ≤75 mg/dL and within ±20% for the YSI BG values >75 mg/dL • 10/15%: proportion of the IVBG system BG values meeting within ±10 mg/dL for the YSI BG values ≤66 mg/dL and within ±15% for the YSI BG values >66 mg/dL • 12/12.5%: proportion of the IVBG system BG values meeting within ±12 mg/dL for the YSI BG values ≤100 mg/dL and within ±12.5% for the YSI BG values >100 mg/dL • 10/10%: proportion of the IVBG system BG values meeting within ±10 mg/dL for the YSI BG values ≤100 mg/dL and within ±10% for the YSI BG values >100 mg/dL
The Clarke Error Grid (CEG) was also utilized. 11
Reliability of the IVBG system
Although not a defined end point of the study, reliability of the IVBG system was assessed in a post hoc analysis. Reliability was defined as the ratio of the IVBG system BG measurements that were considered “displayable” to the user (although the clinical and research staff were masked to the GlucoClear system BG values) compared with the total number of measurement attempts, excluding the user time required to replace a problematic sensor. The determination of reading as displayable or nondisplayable was based on the IVBG algorithm's assessment of the quality of the blood sample measured by the IVBG system.
Safety (both studies)
Safety was characterized by the occurrence of all adverse events (AEs) and adverse device effects (ADEs), including evaluation of the peripheral IV catheter site, upon removal of the sensor, and during follow-up to screen for any insertion site irritation and/or ADEs. Blood for the safety laboratory tests was drawn at baseline, every 24 h and after sensor removal, and the following were measured: hematocrit, hemoglobin, red blood cells, white blood cells with differential, platelets, activated partial thromboplastin time, prothrombin time, serum creatinine and urea, serum electrolytes (Na, K, Cl, and HCO3), aspartate aminotransferase, alanine aminotransferase, lactate dehydrogenase, γ-glutamyl transferase, alkaline phosphatase, bilirubin, amylase, C-reactive protein, and arterial blood gas analysis.
Statistical analysis
Summary statistics were presented as counts and percentages and included the mean, SD, median, and range. The following data were not included in the analyses: data from diluted samples, YSI samples that were >10/10% different from the Radiometer values, and arterial samples (ICU study only). The IVBG algorithm was created based on these data and used to retrospectively analyze the IVBG system data.
Results
Subject population
During the In-Clinic study, 10 otherwise healthy male volunteers with type 1 diabetes (mean age, 38.7 years; mean body mass index, 24.9 kg/m2; 100% white) were enrolled and had a sensor inserted.
During the ICU study, 10 surgical ICU patients (planned surgical procedures, nine cardiac and one pancreatic; mean age, 68.8 years; mean body mass index, 26.6 kg/m2; 50% male; 100% white; 30% with type 2 diabetes) were enrolled and had a sensor inserted postoperatively in the ICU. In the ICU study, one patient received IV dobutamine, two patients received IV noradrenaline, and two patients received IV dobutamine and noradrenaline. Dobutamine doses ranged from 2 to 4 μg/kg/min, and noradrenaline doses ranged from 0.1 to 0.2 μg/kg/min. Dobutamine treatment ranged from 33 to 45 h, whereas noradrenaline treatment ranged from 2 to 17 h.
All subjects were included in the accuracy calculations, except one ICU patient who had no comparative BG measurements. All In-Clinic and ICU subjects were evaluated for safety. No subjects in either study were withdrawn or discontinued from the clinical investigation, and all were evaluated at the 7±3 day follow-up.
System performance
Comparisons with the accuracy criteria
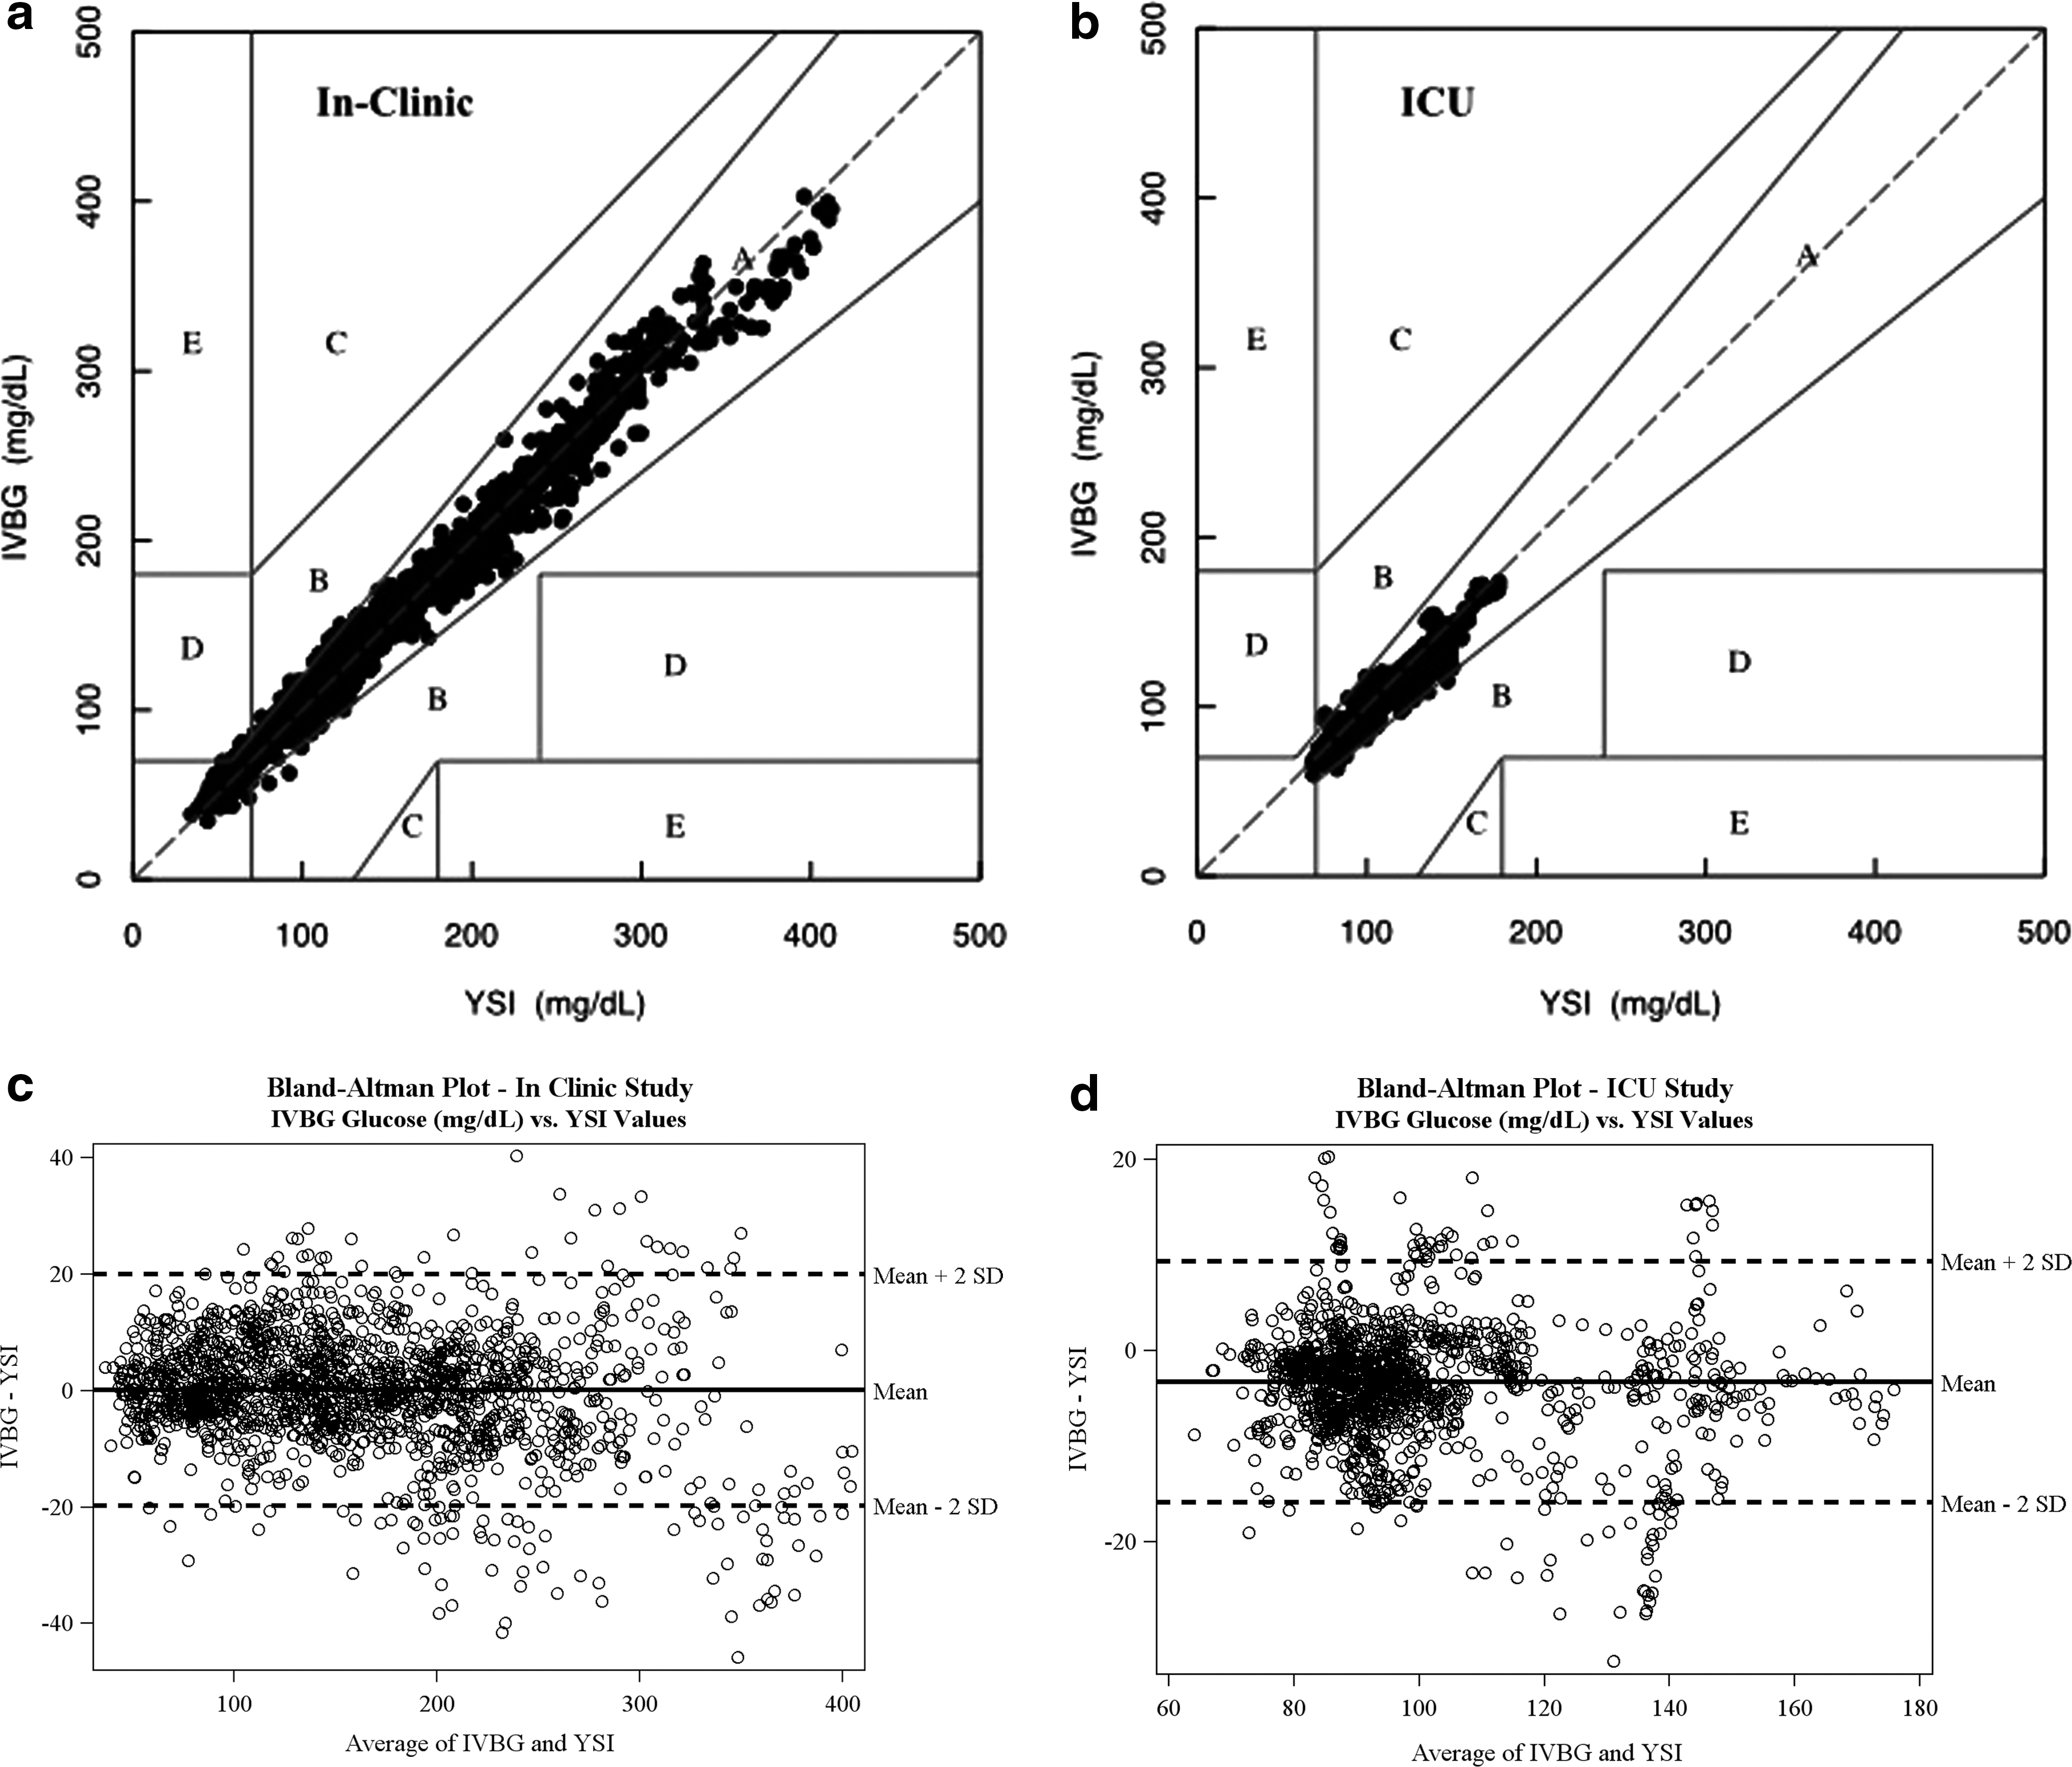
During the In-Clinic study, 1,725 matched pairs between IVBG and YSI were obtained. The same number was obtained between the IVBG and Radiometer devices. The BG concentration of the YSI and Radiometer values in the matched pairs ranged from 40 to 400 mg/dL. Accuracy data are shown in Table 1. The CEG analysis of the IVBG versus YSI data shows that 99.0% of the matched pairs are in Zone A, 0.7% are in Zone B, and 0.3% are in Zone D. All data points in Zone D are at the border of Zones A and B (Fig. 2a).
ICU, intensive care unit.
During the ICU study, 1,393 matched pairs between IVBG and the YSI as well as between the IVBG and Radiometer devices were obtained. The BG concentration of the YSI values in the matched pairs ranged from 68 to 178 mg/dL and from 72 to 186 mg/dL in the Radiometer. Accuracy data are shown in Table 1. The CEG analysis of IVBG versus YSI data showed that 99.4% of the matched pairs are in Zone A and that 0.6% are in Zone B (Fig. 2b).
Accuracy was stable over time in both studies. For In-Clinic study subjects, the percentages of matched pairs meeting the 10/15% criterion were 95.7%, 96.1%, and 97.2% on Days 1, 2, and 3, respectively (IVBG vs. YSI). For subjects in the ICU study, these percentages were 97.3%, 95.2%, and 100%, respectively (IVBG versus YSI). Accuracy data on Day 3 of the ICU study consisted of only two subjects, and, in total, 57 matched pairs were analyzed.
Absolute differences and absolute relative difference
During the In-Clinic study, the IVBG system had a mean absolute difference of 7.19 mg/dL and a mean absolute relative difference (MARD) of 5.04% compared with the YSI. During the ICU study, the IVBG system had a mean absolute difference of 5.17 mg/dL and MARD of 5.05% compared with the YSI.
Ordinary least squares
The ordinary least squares linear regression (IVBG vs. YSI) had a slope of 0.965 in the In-Clinic study and a slope of 0.922 in the ICU study.
Bland–Altman plots
The lines of equality were close to zero for both studies (Fig. 2c and d, respectively). In the In-Clinic study the limit of agreement (2 SD, 95% confidence interval) was 19.87 mg/dL, whereas in the ICU study it was 12.62 mg/dL.
Subject data
During the In-Clinic study, 20.8% of the BG values recorded by the IVBG system were within a range of 80–120 mg/dL. The percentages of values between 120 and 200 mg/dL and above 200 mg/dL were 35.4% and 28.7%, respectively. The percentages of values between 40 and 80 mg/dL and below 40 mg/dL were 13.4% and 1.6%, respectively. A large range of values was collected (data from one subject are shown in Fig. 3a).

Plot of the YSI, Radiometer, and intravenous blood glucose (IVBG) values:
During the ICU study, 79.8% of the BG values recorded by the IVBG system were within a range of 80–120 mg/dL. The percentages of values between 120 and 200 mg/dL and above 200 mg/dL were 11.1% and 0.1%, respectively. The percentages of values between 40 and 80 mg/dL and below 40 mg/dL were 8.9% and 0%, respectively (data from one subject are shown in Fig. 3b).
Sensor dwelling time
All 10 In-Clinic subjects had sensors inserted for more than 60 h. The mean sensor indwelling time was 71.38 h. In the ICU study, the sensors were inserted after the subject was admitted and removed when the subject was discharged. Two subjects returned to the operating room for surgery during the study, at which time the sensor was removed. A new sensor was inserted when the subjects returned to the ICU. The sensor indwelling time was more than 60 and 48 h in one and three ICU subjects, respectively.
Reliability of the IVBG system
During the In-Clinic study, the heparin coating of the sensor was not sufficient to prevent patency issues over 72 h. In the first group of five subjects, four sensors were replaced because of suspected patency issues. To achieve more consistent heparin output from the IVBG system with the second group of five subjects, the heparin-coated IV tubing was replaced every 24 h. In this second group, one sensor was replaced because of suspected patency issues.
During the ICU study, a mean of 89.97% of the IVBG system BG values was considered “displayable” to the user. The mean monitoring session time was 43.72 h and ranged from 16 to 72 h. For nine of the 10 subjects, the sensors were removed because the subject completed the 72 h of monitoring or when discharged to the general ward. One subject had a sensor removed because of partial removal of the IV catheter while the subject was moving. The first group of five subjects had the heparin-coated IV tubing replaced every 24 h during the study. The second group of five subjects had the heparin-coated IV tubing replaced only if the sensor was replaced. No sensors were removed because of patency issues.
Exposure to concomitant medications
In total, nine medications (insulin, pantoprazole, aspirin, enalapril, hydrochlorothiazide, levocitrizine, lisinopril, pravastatin, and simvastatin) were self-administered by subjects during the In-Clinic study. All In-Clinic subjects self-administered insulin. In total, 42 medications were administered to subjects during the ICU study as the standard of care. The most common medications given to ICU subjects included acetaminophen, insulin, piritramide, propofol, cefazolin, nadroparine, remifentanil, ranitidine, protamine sulfate, and heparin.
System safety
During the In-Clinic study, no serious ADEs (SADEs) or serious AEs were observed. Study-related AEs included erythema, irritation, itch, induration, vagal reaction, hematoma, and redness. These AEs were thought to be related to the frequent blood draws and manipulations of the sampling catheter. Two ADEs were observed and consisted of induration of the antecubital vein and light redness. All AEs were resolved before the 7-day follow-up. No device deficiencies that could have led to an SADE were reported. Laboratory measurements were taken, but none indicated an AE.
During the ICU study, no SADEs were observed. Five serious AEs were reported, and none of these was related to the device. Three ADEs were observed and consisted of mild bruising near the IV catheter insertion and mild hematoma at the insertion site of the sensor catheter. All but three AEs, none of which was study related, were resolved before the 7-day follow-up. No device deficiencies that could have led to an SADE were reported. Laboratory measurements were taken, but none indicated the presence of an AE.
Discussion
The commonly used methods for measuring BG in clinical practice are POC on blood from a finger stick with single-use glucose strips, drawing a sample of blood directly from an intravascular access line and measuring this sample with a POC device or a blood gas analyzer, and sending the blood sample to the clinical laboratory for measurement. Therefore, intensive insulin infusion protocols typically require extensive nursing efforts and frequent bedside glucose monitoring. As such, these treatment regimens have been largely limited to the ICU or step-down/telemetry levels of care and consume an important proportion of hospital resources.
The IVBG system evaluated in this study can provide accurate, reliable, and safe continuous glucose monitoring without extensive efforts from clinicians and nursing staff. The accuracy of the IVBG system meets the ISO 15197:2003 12 15/20% criterion and the stricter 10/15% criterion in both studies. These two studies demonstrate that the accuracy of the IVBG system in the intended ICU setting is comparable to the accuracy of the IVBG system in a more controlled setting with volunteers across the full range of BG for up to 72 h. A limitation of the ICU study is that the BG measurements for the IVBG system were within a limited concentration range because of strict glucose control in the ICU subjects. The majority (79.8%) of the IVBG system BG measurements were within a range of 80–120 mg/dL in the ICU subjects. However, the In-Clinic study allowed the concentration of BG to be varied across the entire measuring range and demonstrated accuracy across the full range.
The ICU study accuracy is similar to the accuracy in the In-Clinic study even when exposed to potential flow dynamic issues, different medications, potential electronic device interferences, and other factors that could affect continuous glucose monitoring in an ICU setting. In both studies the results show a good correlation and a line of equality close to zero. The small accuracy difference in the matched pairs meeting the 10/15% criterion over the 3-day study period in both studies suggests that the sensor is inert and free from interference over the entire study period. Additionally, this technology rapidly detects changes in BG, resulting in the lack of lag between the measured value and true BG, which is shown in Figure 3.
Studies with interstitial continuous glucose monitoring systems (CGMSs) in the ICU have reported conflicting results. In some clinical trials CGMS glucose values were considered accurate compared with reference BG measurements, 13 –16 whereas in others it was concluded that the CGMS was not sufficiently reliable and accurate for clinical use in the ICU. 17 –20 In two recent studies intravascular devices for BG monitoring were evaluated. In one study of continuous intra-arterial BG monitoring using fluorescence sensing, 80.8% of paired sensor and reference measurements were within 20% of reference for BG values ≥70 mg/dL. 21 In that study MARD was 13%. In another trial microdialysis in a central vein was used for continuous glucose monitoring. 22 Depending on the calibration used (single vs. 8-h) mean absolute glucose difference was 0.85 or 0.61 mmol/dL (i.e., 15.31 and 10.99 mg/dL), respectively. There was close agreement between the microdialysis and reference plasma glucose values in eight of 10 patients. Correlation was high with r=0.89 for single calibration and r=0.92 for 8-h calibration. The accuracy reported in that study seems slightly below the one reported in our study but is for both studies promising in terms of glucose control in critically ill patients. However, for both techniques larger studies will be needed to confirm efficiency and safety when used for tight glycemic control.
After some patency issues in the In-Clinic study, which were resolved by replacing the heparin-coated IV tubing daily, the reliability in the ICU study was very good, and more than 89% of the measured values would have been displayed on the monitor if the investigators had not been blinded. These data suggest this technology has sufficient reliability to be used for strict glucose control in ICU settings.
Of note is that all ADEs observed during both studies were expected events that were associated with the use of the insertion and securement of any peripheral venous catheter.
Measuring BG levels with this system was minimally invasive, but the technology may have some limitations. Whereas this IVBG system measures BG in venous blood, the “gold standard” has been reported as arterial blood. 23 Although there is a difference in the BG concentration between arterial and venous blood, 23,24 future studies are needed to investigate whether this gradient is important in ICU patients. Currently, the device is designed for use via a peripheral vein. Not every patient may have suitable veins, and peripheral venous access is sometimes limited in patients with a longer ICU stay. Conversely, IVBG monitoring via a peripheral vein can be continued on the ward when patients are transferred from the ICU, but care should be taken with IV fluids that are administered distal to the sensor.
A limitation of this study is that we did not check systematically for known confounders for glucose oxidase-based readings, as summarized by Dungan et al. 25 However, it should be noted that in this article, “POC” devices, referred to as “hand-held devices or portable ward-based analyzers,” were compared with reference laboratory methods. In our study an IV device was compared with YSI and Radiometer measurements on venous blood. Therefore, a lot of concerns raised in that article (such as influence of hypotension, oxygenation, arterial or venous samples vs. capillary samples) are probably less of an issue with the technology used in our study. Additionally, the GlucoClear sensor has a reference electrode, which eliminates the effect of interfering substances (such as acetaminophen) on glucose oxidase technology.
The data collected during these two studies allowed for evaluating and updating the device software and algorithm for technical alarms. New technical alarms and thresholds for technical alarms were developed. The rapid and accurate display of BG values with an unblinded system will warn the user in an early stage when the glucose levels are tending to deviate, allowing for the prevention of severe hypo- and hyperglycemia.
Additionally, the nursing workload for monitoring glucose and adjusting insulin treatment in an ICU setting is calculated at 4.72 min/h, resulting in almost 2 h/day per patient. 26 Continuous glucose monitoring technology can reduce workload and related costs when tight glycemic control is performed in the ICU.
Because this IVBG system accurately, reliably, and continuously measures BG levels, it could facilitate strictly controlling BG with a minimal workload in the ICU. This system can also be used on the ward to monitor glucose levels and allow for the quick evaluation of insulin therapy with minimal physician and nursing efforts.
Conclusions
The IVBG system is accurate, reliable, and safe in a research unit setting and the ICU. It is a minimally invasive system that was free of interferences during the 3-day study period. Combining its near-continuous measurements with alarms and trends may prevent glycemic events in critically ill patients.
Footnotes
Acknowledgments
Koen De Graeve and Veerle Smet, research nurses, assisted in conducting both studies.
Author Disclosure Statement
A.M.G. is an employee of Edwards Lifesciences. L.A.F., P.V.L., F.R.N., and K.H.D.D. declare no competing financial interests exist.
L.A.F. was responsible for co-design of the In-Clinic and ICU studies, acted as the Principal Investigator, and was involved in the manuscript preparation. P.V.L. was responsible for co-design of the In-Clinic and ICU studies, acted as the Co-Investigator, and was involved in the manuscript preparation. F.R.N. was responsible for co-design of the In-Clinic study. A.M.G. was responsible for co-design of the In-Clinic and ICU studies and was involved in the manuscript preparation. K.H.D.D. was responsible for co-design of the ICU study. All authors approved the final manuscript.