
Abstract
Background:
The purpose was to describe patterns of home self-monitoring of blood glucose (SMBG) in Mexican Americans with type 2 diabetes mellitus enrolled in a diabetes self-management education protocol. Research questions were as follows: (1) What were the patterns and rates of home glucose self-monitoring over the 6-month course of the study? (2) What were the differences in monitoring rates between experimental and control groups? (3) What were the relationships between rates of monitoring and glycosylated hemoglobin (A1C), gender, and years with diabetes?
Subjects and Methods:
We used a randomized (by group) repeated-measures pretest/posttest control group design. Glucometer data from an experimental group (diabetes self-management education plus nurse case management) and a comparison group (diabetes self-management education only) were analyzed. Data were collected at baseline and at 3 and 6 months.
Results:
Overall average SMBG rates were low. Experimental and control group monitoring levels were not significantly different. More females than males never monitored glucose values, but more females than males checked at least one time per week. Those participants who checked their glucose levels more than once per week had diabetes for a longer period of time. Rates of monitoring were not strongly associated with A1C levels at 3 and 6 months, but at 6 months A1C levels were statistically significantly different based on whether or not individuals monitored their glucose levels (P=0.03, n=71).
Conclusions:
SMBG rates were low in this study despite SMBG education and access to free glucometers and test strips. The lower rates of SMBG may reflect the effects of unexpected environmental challenges, but exact causes remain unclear. Reasons for low rates of SMBG need to be explored further, especially in underserved communities.
Introduction
C
Little research has focused on the issue of SMBG rates, particularly in minority populations who, when compared with non-Hispanic whites, tend to experience higher: prevalence rates of T2DM, glycemic values, and rates of diabetes complications, including diabetes-related mortality. 9 Our previous research with Mexican Americans residing in an impoverished community on the Texas–Mexico border has shown that both high and low glucose levels and glucose variability were associated with symptoms, some of which were incapacitating, such as severe headaches, heart palpitations, nausea, and dizziness, to name a few. Symptoms triggered subsequent self-management actions by the individual to relieve the symptoms, such as increasing intake of foods containing glucose or stopping exercise, sometimes counterproductive to the overall goal of lowering blood glucose levels. Most individuals did not conduct SMBG to verify symptoms. 10 –13 Informal interviews with these individuals indicated that their misinterpretations of the causal nature of symptoms posed a major obstacle to achieving overall glycemic control.
The purpose of this article is to describe patterns in downloaded home SMBG data in order to explore the issue of glucose self-monitoring in a population of Mexican Americans diagnosed with T2DM. The parent study from which these data were derived was designed to explore a nurse case management intervention, a relatively untested strategy for impoverished rural communities. 10 An experienced nurse case manager (NCM) was added to our previously tested, culturally tailored diabetes self-management education (DSME) intervention to enhance the effects of DSME by increasing attendance, rates of SMBG, and access to other healthcare resources available in the community. The NCM had extensive diabetes case management experience and received extensive training and scripts (content outline) specifically for this study to guide her interactions with study participants. As part of the DSME intervention, study participants were given free glucometers and strips and were instructed to monitor their glucose levels according to a specified schedule for the length of the 6-month study period (Table 1).
No monitoring was done during Week 1.
The individuals who participated in our studies were medically underserved; they resided in one of the poorest rural communities in the United States. 10 –13 Very few had access to diabetes healthcare resources, including medical care and diabetes medications. Fewer than 20% of the individuals were on insulin. 10 We provided study participants with general recommendations only for improving glucose levels rather than prescribing any treatment changes based on specific decision algorithms. However, the NCM did provide more specific dietary recommendations when warranted or when an individual's health status was not improving as a result of the intervention sessions. When medication adjustments were deemed necessary, individuals were referred to their physicians or the local clinic for indigent patients. As we have reported previously for the parent study, diabetes treatment data showed no significant changes in individuals' diabetes treatment regimens during the study. 10 –13
The following research questions guided the analyses of SMBG data for this substudy of SMBG: 1. What were the patterns in participants' rates of home glucose self-monitoring comparing Week 3 (first week of monitoring) and • Week 8 (end of intervention [educational portion] sessions)? • 3 months (after first support group session and outcome data collection period)? • 6 months (after second and final support group session and outcome data collection period)? 2. What were the differences in monitoring rates between the DSME-NCM group and the DSME-only group during these time periods? 3. What were the relationships between rates of monitoring and gender, years diagnosed with diabetes, and A1C?
Subjects and Methods
The research design and methods used in this study, as well as the major findings, have been reported in detail elsewhere. 10 –13 In brief, the setting was Starr County, one of 14 Texas counties delimited in part by the Rio Grande River and bordering Northern Mexico; 98% of Starr County residents are Mexican American, and 35% of these are foreign born. 14 The County has been designated by the State of Texas as a Health Professional Shortage and Medically Underserved Area, with lower ratios of physicians and nurses to the population than the rest of the State. 14
Here, we report analyses of downloaded glucometer data that were collected as part of a 2-year NCM feasibility study. The study was designed as a randomized (by group) repeated-measures pretest/posttest control group study. All participants received our DSME intervention involving 8 weeks of education and two support group sessions, one at 3 months and one at 6 months. In addition to the DSME intervention, the experimental condition also received access to a NCM to address individual barriers to making lifestyle changes and attending the intervention sessions, as well as to encourage individuals to monitor blood glucose levels and assist them in securing access to healthcare resources, such as free or low-cost glucometers, available in the community for people from poor socioeconomic backgrounds. We collected data at baseline, 3 months, and 6 months. Because of the limited and irregular testing done by most study participants, we report primarily descriptive statistics, including means and frequencies, along with χ2 and t test statistics.
In total, 83 individuals with T2DM were recruited to participate in the study. Participants were required to be between 35 and 70 years of age, diagnosed with verifiable T2DM (two FBG test results of ≥140 mg/dL or having taken insulin or hypoglycemic agents for ≥1 year), and willing to participate. Individuals were excluded if they had participated in any of our previous intervention studies, were pregnant, or had medical conditions for which changes in diet and physical activity were contraindicated.
In total, 83 participants were assigned to eight groups based on where they lived in the community, with each group consisting of eight to 10 participants. Four groups were randomized to receive DSME plus access to an NCM (experimental condition, n=48), and four groups received DSME only (control condition, n=35). An additional 83 supporters attended intervention sessions; most supporters were spouses or first-degree relatives (e.g., adult daughters).
Study participants were given free glucometers and strips, instructed on their use, and asked to check blood glucose levels according to a specified schedule designed in consultation with diabetes specialists and representatives of the glucometer manufacturer (Table 1). Because most individuals would not be able to afford the costs of strips after conclusion of the study, the glucometers were provided primarily for educational purposes. The decisions regarding the monitoring schedule were based on issues of costs associated with monitoring supplies and the desire for individuals to learn their individual glucose patterns and responses to changes in diet and physical activity, for example, what foods would cause their blood sugars to spike. 1 At the 6-month data collection point, glucometer data were downloaded, using software provided by the glucometer manufacturer, into IBM (Armonk, NY) SPSS (Statistical Package for the Social Sciences) software version 21.0. 15
Our past experiences with SMBG in this community indicated that study participants shared their monitors with family members and friends, which would confound the monitoring results. To address this issue, DSME instructors asked participants to avoid sharing their meters, even with family members. They were advised to inform others that free glucose testing was available at the local Starr County Diabetes Research Field Office, the center of operations for the study. When glucometer data were downloaded, data collectors asked the participants if others had used their glucometers, and, if so, the project staff noted the values identified as belonging to other users. The time and date for two entries were identified for two individuals as glucose values not belonging to the participants, and these two data values were excluded from the analyses reported here. All study participants were included in the analyses, based on the intention to treat principle, regardless of whether they followed the monitoring schedule or not.
Results
Characteristics of study participants
Table 2 shows the characteristics of the participants included in these SMBG analyses. On average, participants were 49 years of age, had had diabetes for 7 years, and were predominantly female. Consistent with our previous studies, most individuals were treated with oral hypoglycemic agents for their diabetes, Spanish speaking, lacking basic diabetes knowledge, obese, and in poor glycemic control. 10
Note that 43 people checked more than one time during the study (total for 6 months); 40 people checked only one time or less.
Number of times monitoring per week at measurement time point.
A1C, glycosylated hemoglobin.
Rates of home glucose self-monitoring
Following the monitoring schedule, we asked participants to check their blood glucose values a total of 135 times during the 6 months of the project (Table 1). Rates of SMBG ranged from zero to a maximum of 15 times, measured at Week 8 or just following completion of the intervention. Maximum number of SMBG measurements performed by study participants decreased from baseline (14 times) to 6 months (8 times). For the total sample, the pattern of monitoring showed a decrease in monitoring over time, decreasing from 2.3 mean times at Week 3 to 1.3 mean times at 6 months. For the total sample, the cumulative number of glucose monitoring events per person during the 6-month project period ranged from none to 32 monitoring events (25% of the total recommended monitoring times) (Table 2). Log sheets completed by research project staff indicated that 12 participants did not attend the class when the glucometers were distributed, data from six participants were lost because of computer malfunction, six participants lost their glucometers, and four participants refused to monitor.
Group differences in glucose self-monitoring rates
Figure 1 depicts a graph of average glucose self-monitoring rates at the four measurement periods: Weeks 3 and 8 and months 3 and 6, separated by experimental (DSME-NCM) versus control (DSME-only) group. The number of glucometer uses did not differ significantly between the experimental and control groups (P=0.77, n=83).
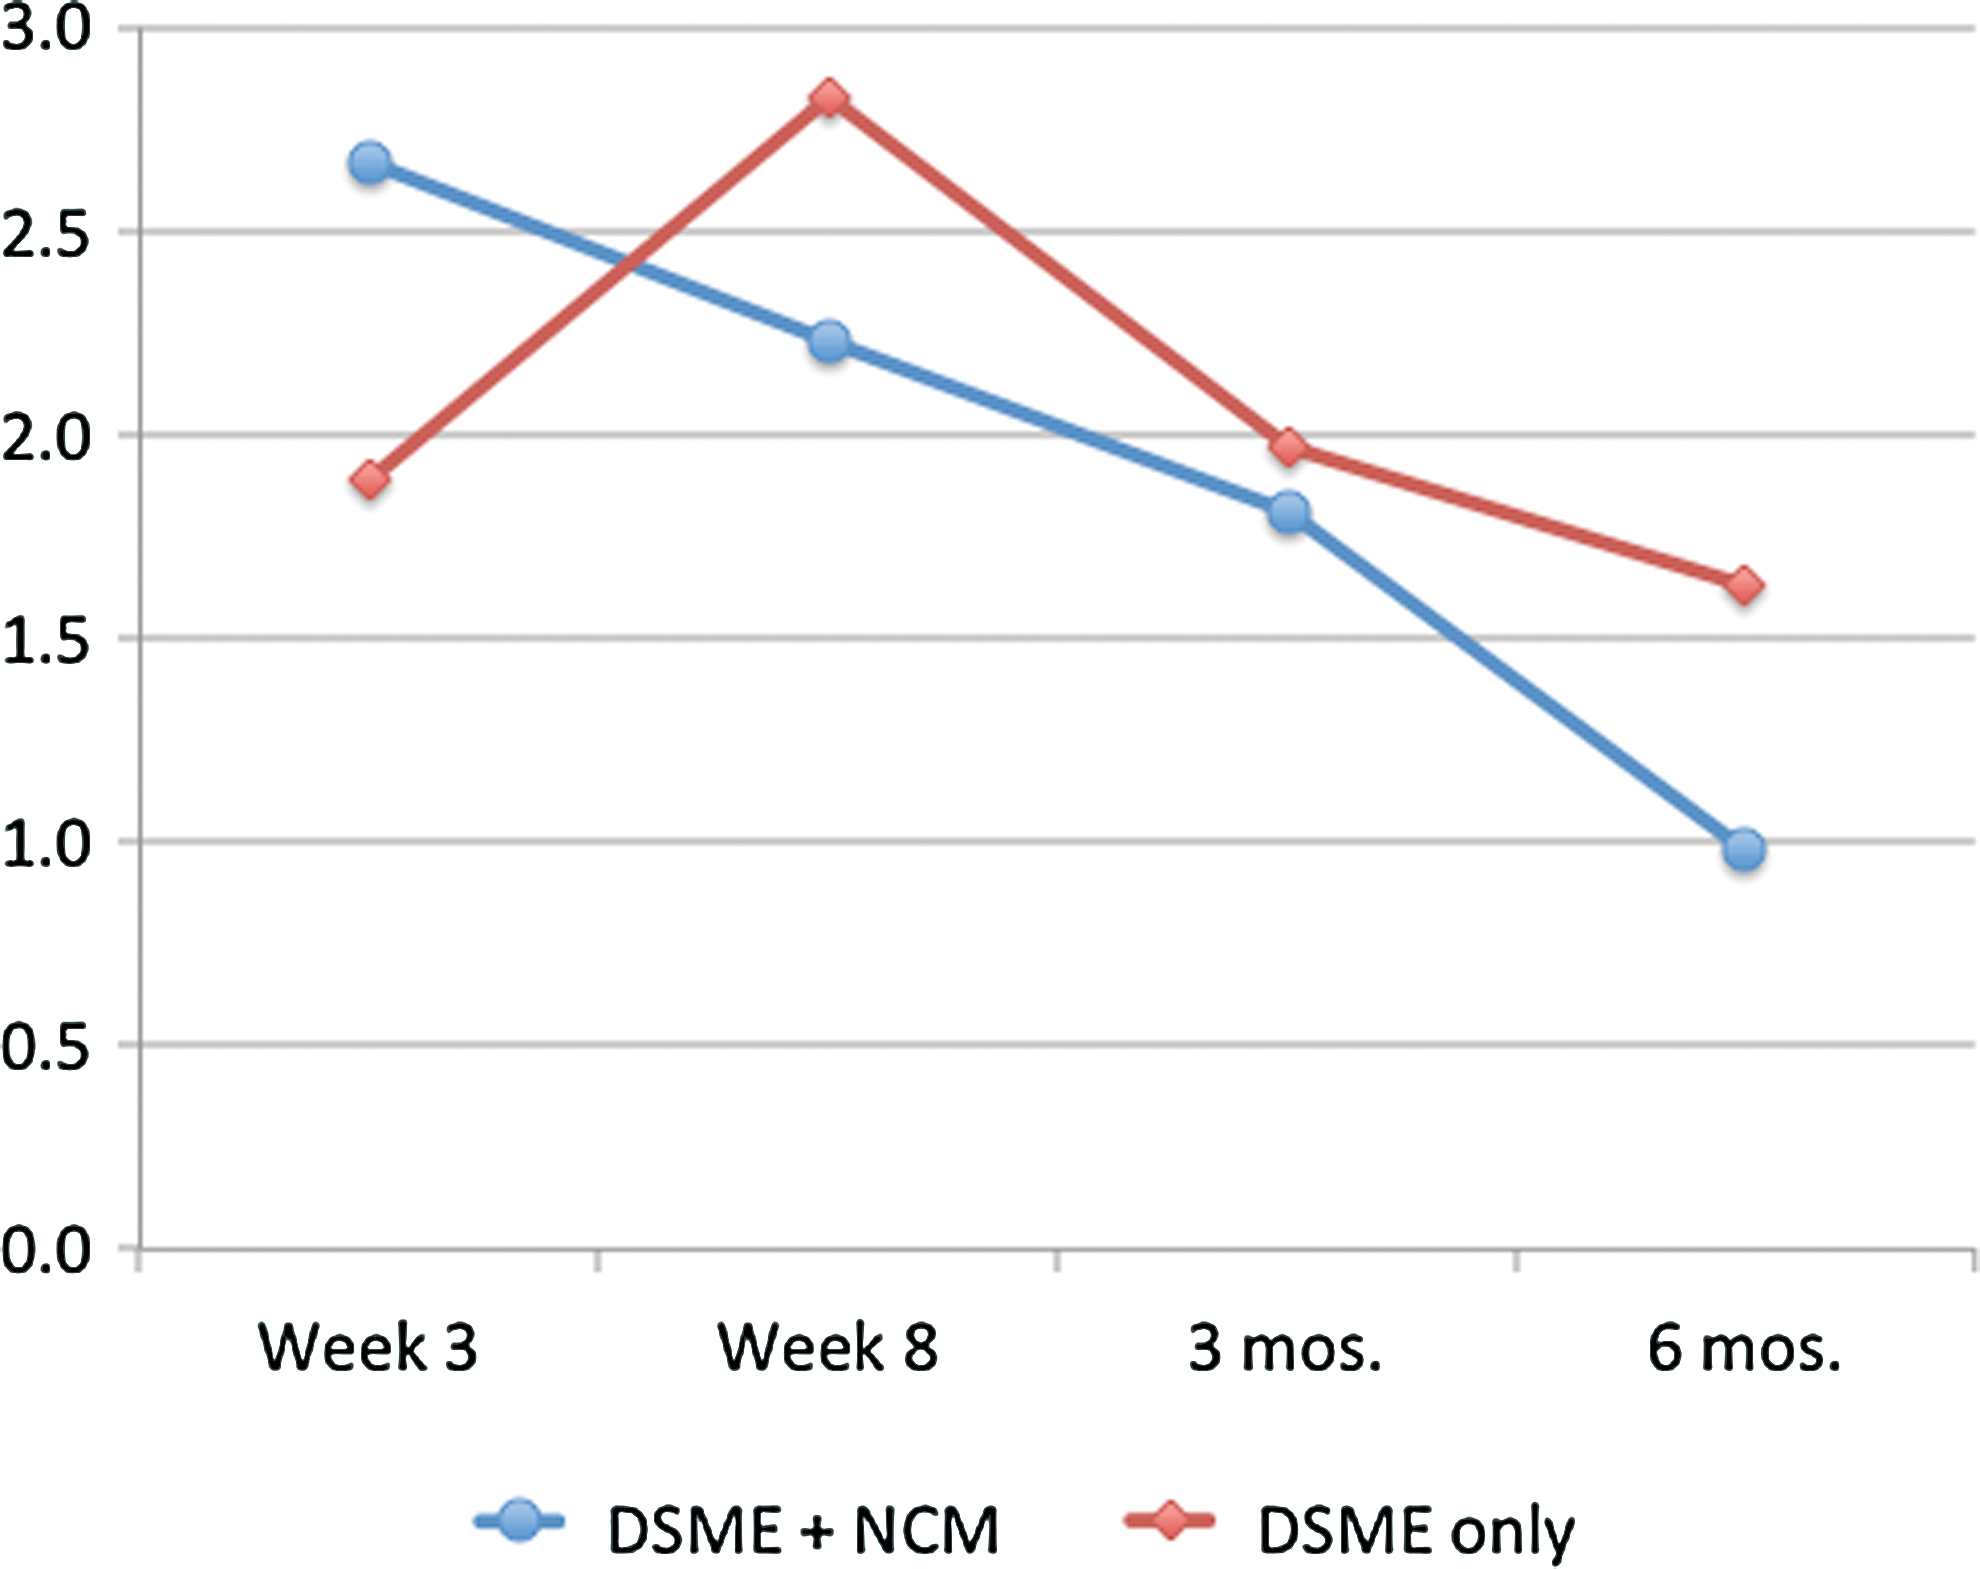
Mean monitoring rates by study group (n=83). DSME, diabetes self-management education; NCM, nurse case manager. Color images available online at
Relationships between monitoring rates and gender, years of diabetes diagnosis, and A1C
Table 3 shows the relationships between key study variables (gender, years of diabetes diagnosis, A1C) according to the frequency of SMBG. Participants were divided into three groups according to the number of times they self-monitored their blood glucose levels: never checked (n=40, which was almost half of the sample), checked more than one time during the study (n=43), and checked at least one time per week (n=20). Note that the total sample was 83; individuals in column 3 (checked once or more than one time every week) overlapped with the individuals in column 2 (checked at least once during the project) and represent those study participants who monitored most frequently (n=20). The P levels shown in Table 3 represent comparisons between those who monitored at least once (column 1) and those who didn't monitor at all (column 2); P levels were set at ≤0.05 but should be interpreted with caution because of the small sample size and the generally low number of monitoring events.
Note that the 20 individuals whose data are given in this column are part of the n=43 reported in the previous column.
Because there is overlap in participants across the three columns, analyses compared those who monitored at least once (column 1) and those who didn't monitor at all (column 2); P levels for significance were set at ≤0.05.
Significant at the ≤0.05 level.
A1C, glycosylated hemoglobin.
In terms of gender, more females than males never checked their blood glucose levels, and more females than males checked blood glucose levels more than one time per week. However, gender differences were not statistically significant (P=0.35, n=83). In terms of the relationship between monitoring and years with a diabetes diagnosis, the longer individuals had diabetes, the more likely they were to check their blood glucose levels, but this relationship was not statistically significant (P=0.52, n=82). In terms of the relationship between A1C levels and monitoring rates, A1C levels did not differ significantly based on whether individuals conducted SMBG at baseline (P=0.21, n=80) and at 3 months (P=0.23, n=76). However, at 6 months A1C levels were statistically significantly different based on whether or not individuals monitored their glucose levels (P=0.03, n=71).
Monitoring rates in previous Starr County studies
Previous Starr County intervention studies included focus group interviews where participants reported that SMBG and learning about healthy dietary principles as applied to Mexican American foods were the key aspects of the culturally tailored interventions we designed for this community. 12,13,16 Our previous data from Starr County showed that regular monitoring of blood glucose levels resulted in greater improvements in glycemic control. Because of downloading and data importing challenges of previous glucometer models, we do not have complete, parallel monitoring data from our previous studies, so direct comparisons across studies are not possible. However, we do know that in previous Starr County studies SMBG was shown to be effective in improving diabetes glycemic control.
Rates of SMBG in previous studies were significantly correlated with 12-month A1C (r=−0.35, P<0.001) and FBG (r=−0.28, P=0.002), indicating that higher SMBG rates were significantly associated with improved metabolic control (i.e., lower A1C and FBG). To explore this relationship further, again in previous studies, we compared the participants who were the top 20% (n=27) in reducing A1C with the lowest 20% (n=28) of participants in reducing A1C. The top 20% reduced A1C by 5.3 percentage points, whereas the lowest 20% had an increase of 3.2 percentage points (P<0.001). The top 20% monitored glucose values, on average, 119.7 times (48% of recommended) during the first 12 months, whereas the lowest 20% monitored 109.6 times (44% of recommended). When we compared the top 10% (n=20) of participants who were most successful at lowering A1C levels with the lowest 10% of participants, we found a significant difference in the number of times monitored (P=0.01): 131.9 and 67.2, respectively. Although these previous unpublished data indicated that SMBG had a significant relationship with A1C, in the substudy reported here we were interested in exploring the patterns of individuals' SMBG when given more specific monitoring recommendations and monitoring supplies.
Discussion
The American Diabetes Association's Standards of Medical Care in Diabetes included an acknowledgement of the value of SMBG in DSME; however, the standards contain no specific guidelines related to the frequency of self-monitoring in T2DM. 1 Furthermore, there is disagreement among healthcare professionals about the importance of SMBG in the management of T2DM. 17 Evidence suggests that, along with comprehensive DSME, SMBG can be an effective tool to enhance patient diabetes-related knowledge and effectively change behavior in persons learning how their levels respond to certain foods, physical activity, medications, stress, and other health behaviors and situations. 8
Lack of personal resources, costs of monitoring supplies (particularly strips), the required intensity of SMBG involving numerous daily finger sticks, and limited access to SMBG education are typically cited as the reasons why people do not monitor their own glucose levels. 18 A previous survey conducted with individuals with T2DM (n=732) for the purpose of examining glucometer use found the most common reasons given for not using the glucometer included “I can't remember to do it,” “it's a hassle to carry it around,” and “testing doesn't help me control my diabetes.” 19 Limited DSME and lack of training in how to interpret and apply the information gained from monitored glucose levels have been shown to be correlated with low meter use, with 97% of those who reported training on reactive treatment (that is, what actions to take based on monitoring results) said they used their meters regularly. 19
In the present study reported here, the recommendation for monitoring was six times per week beginning with Week 3, the first week after glucose self-monitoring techniques were demonstrated during an intervention session. We did not include plans to question individual participants regarding the reasons for their lack, or low rates, of SMBG. These investigators assumed that because the intervention included SMBG education and access to free meters and test strips throughout the course of the study, most study participants would follow the recommended limited monitoring schedule. However, the individuals in the study reported here experienced considerable stress related to severe flood events in their community during the course of the study caused by the effects of back-to-back tropical depressions; in some cases study participants were displaced from their homes for extended periods of time, which likely diverted their attention from their diabetes and monitoring blood glucose levels. 10 Patterns in the A1C data showed a lower mean A1C in general in individuals who monitored the most, perhaps indicating that glucose self-monitoring was a proxy for commitment to diabetes self-management. The lower rates of SMBG in this study likely reflect the effects of considerable unexpected personal and environmental challenges, but the exact causes of these low rates of SMBG remain unclear. It seems logical to posit that life events, either large or small, are likely to derail patients' diabetes self-management strategies.
Our original interest in downloading these SMBG data was to examine day-to-day variability in glucose levels, particularly in this sample of Mexican Americans. In previous Starr County studies, we have demonstrated very high baseline A1C levels and also had individuals complain about significant symptoms of hypoglycemia while their glucose levels, although lower, were still high. Thus, because this physiologic phenomenon is a significant barrier to attaining glycemic control, it would be interesting to examine daily glucose variability and develop a strategy that would effectively manage glycemia reductions perhaps more slowly in order to avoid severe hypoglycemic symptoms. But, the small sample size coupled with low SMBG rates made it impossible to assess glucose variability in this study. This is disappointing because (1) there is a dearth of studies that have involved analyses of glucose variability, particularly in such populations as Mexican Americans residing in impoverished rural communities, (2) glucose variability has been associated with risk of microvascular complications and increased carotid intima media thickness, (3) increased glucose variability is a strong predictor of hypoglycemia and poor glucose control, and (4) wide variability and poor control can be masked by relying on A1C values to assess management status. 20 –23
SMBG is not a “stand-alone” diabetes therapeutic intervention. It may be difficult for persons with T2DM to see its value when it is one of several behavioral strategies recommended for daily diabetes self-management. In order to demonstrate the potential impact SMBG can have on diabetes management, SMBG education must include explanations of how monitoring data can improve health outcomes and facilitate behavior changes that can lead to glycemic control if the monitoring data are interpreted accurately and acted upon effectively. 24 Training in SMBG, one method recommended to achieve glucose goals, requires individuals to record glucose values along with food, activity, symptoms, and medications in such a way that they, and their healthcare providers as well, can see the relationships among glucose levels and certain health behaviors (e.g., carbohydrate intake, physical activity, etc.). 23 Similarly, healthcare providers are advised to help their patients with diabetes devise a structured monitoring program that is more individually tailored to lifestyles. 8 Standardizing glucose reporting with tools such as glucose pattern management may be one step in integrating SMBG data, lifestyles, and glucose goals in T2DM.
Continued research is needed to define how to incorporate SMBG in underserved populations with limited resources and access to continuing oversight by healthcare providers. Reasons for low rates of SMBG, a potentially valuable component of diabetes self-management, and the potential effectiveness and utility of the case management model in rural areas need to be explored further. As this study demonstrated, even when there is access to such self-management education and SMBG supplies, monitoring rates may still fall below recommended levels. Serious day-to-day challenges of living in impoverished communities pose significant challenges to effective diabetes self-management.
Footnotes
Acknowledgments
This study was supported by grant R34DK073286 from the National Institute of Diabetes and Digestive and Kidney Diseases, National Institutes of Health.
Author Disclosure Statement
No competing financial interests exist.