
Abstract
Background:
In long-standing type 1 diabetes (T1D), loss of endogenous insulin secretion and glucose dysregulation can lead to severe hypoglycemia and associated complications. Here, we report the serial consistency and the correlation between different scores that characterize glucose dysregulation using self-monitoring of blood glucose (SMBG), in a cohort of T1D individuals being evaluated for transplant eligibility in Clinical Islet Transplantation Consortium trials.
Subjects and Methods:
In total, 152 C-peptide–negative T1D subjects with at least one severe hypoglycemia episode in the prior year documented SMBG at enrollment and every 6 months until deemed ineligible or transplanted. SMBG was used to calculate the HYPO score, Lability Index (LI), and mean amplitude of glycemic excursion (MAGE). Additionally, a blinded continuous glucose monitoring system (CGMS) was worn for 72 h at enrollment and every 12 months.
Results:
In this cohort, LI was the most consistent (intraclass correlation coefficient=0.70) over time, followed by the HYPO score (0.51), with MAGE being the least consistent (0.36). Although MAGE and LI were highly correlated with each other, neither correlated with CGMS SD or glucose coefficient of variation (CV). Subjects spent a median of 97 min/day at <54 mg/dL using CGMS. The HYPO score correlated with CGMS time below 54 mg/dL and glucose CV.
Conclusions:
The HYPO score and LI are more consistent than MAGE in patients with established T1D experiencing severe hypoglycemic events and may be especially useful both for identifying subjects experiencing the greatest difficulty in maintaining glycemic control and for longitudinal assessment of novel interventions.
Introduction
L
Glycemic lability, severe hypoglycemia, and reduced hypoglycemia awareness are interrelated manifestations of T1D-associated glucose dysregulation. 7 –9 Because of the morbidity and mortality associated with hypoglycemia and glucose dysregulation, various attempts have been made to develop practical and useful tools to quantify these phenomena, including the HYPO score, 10 the Lability Index (LI), 10 the mean amplitude of glycemic excursion (MAGE), 11 and continuous glucose monitoring system (CGMS) measures, 12 among others. However, relevant comparisons among these metrics have not yet been made, nor is it clear if such measures provide consistent results within the same patient if repeated over time.
Islet transplantation has emerged as a promising approach to β-cell replacement in highly selected subjects with long-standing T1D.
13
Functioning islet grafts result in protection from severe hypoglycemia and stabilization of blood glucose levels
10
that may be attributed to both restoration of endogenous insulin secretion and hormonal and symptom responses to hypoglycemia.
14,15
The safety and efficacy of islet transplantation in long-standing T1D are being evaluated in a series of clinical trials under the auspices of the Clinical Islet Transplantation (CIT) Consortium, sponsored by the National Institutes of Health (
In the CIT Consortium trials, clinical history, self-monitoring of blood glucose (SMBG), and CGMS data were prospectively collected, and Clarke, HYPO, LI, and MAGE scores were calculated. (An overview of HYPO, LI, and MAGE scores is given in Supplementary Table S1).
Key criteria for transplantation under the CIT trials included at least one severe hypoglycemia episode in the past year and reduced awareness of hypoglycemia (Clarke score ≥4), as well as markedly problematic hypoglycemia or glycemic lability as determined by twice yearly calculation of HYPO score and LI from subjects' SMBG; additional assessments included MAGE measurements and yearly blinded CGMS. Although the HYPO score and LI were developed specifically for use in islet transplantation and have been validated against clinical assessment and compared with the general T1D population, 10 the serial consistency of these indices has not been evaluated to date. Using results for various measures of hypoglycemia and glucose lability obtained during eligibility evaluation and the pretransplant period for the CIT trials, this study specifically (1) examined the serial consistency of HYPO, LI, and MAGE scores obtained in this cohort, as assessed by the intraclass correlation coefficient (ICC), and (2) characterized the correlation between these three SMBG-based scores and measures of hypoglycemia and glycemic variability derived from CGMS recordings.
Subjects and Methods
Subjects
Subjects in this study were enrolled in six CIT islet-alone trials conducted at eight Consortium centers in North America. The trials enrolled C-peptide–negative T1D subjects between 18 and 65 years of age who had experienced at least one episode of severe hypoglycemia
16
in the year prior to enrollment despite participation in intensive diabetes management. Intensive diabetes management was defined as SMBG at least three times daily with use of three or more daily injections of insulin or continuous subcutaneous insulin infusion therapy under the direction of an endocrinologist, diabetologist, or diabetes specialist with at least three clinical evaluations during the year prior to enrollment. The inclusion and exclusion criteria and study end points are listed on the Web site
The key glycemic inclusion criteria for CIT trials were as follows: HYPO score of >1,047 or LI of >433, representing the 90th percentile from a general T1D cohort, thus identifying subjects with severe problems with hypoglycemia or glycemic lability, respectively. 10 In addition, subjects with a composite of both HYPO score of >423 and LI of >329, representing the 75th percentiles, 10 were eligible if they also manifested reduced awareness of hypoglycemia that was indicated by a Clarke score of ≥4. 5 The Clarke surveys were administered at study visits by trained study coordinators.
Three hundred forty-one subjects provided informed consent to participate in the North American islet-alone CIT trials. Because this study's objectives are to characterize the HYPO, LI, and MAGE scores in subjects being evaluated for islet transplantation, all available calculations were used, even if a subject was eventually deemed ineligible for transplantation. Subjects were asked to complete SMBG every 6 months until they were deemed ineligible or received a transplant. Subjects were instructed to complete SMBG at least premeal and bedtime (four times daily), with additional 2-h postmeal checks (seven times daily) during at least 7 consecutive days of the 28-day recording period. Some of the subjects were deemed ineligible prior to submitting SMBG, such that 152 subjects who provided at least one suitable SMBG (at least 28 days of blood glucose readings within a 35-day period) are included in the analyses. Their baseline characteristics are presented in Table 1. There were no significant differences in baseline characteristics between the 152 subjects analyzed and the consented subjects who were not included in the analyses.
Baseline characteristics are shown of all subjects who provided consent and of those included for analysis based on complete HYPO score/Lability Index (LI) data, complete mean amplitude of glycemic excursion (MAGE) data, and complete continuous glucose monitoring system (CGMS) data.
BMI, body mass index; HbA1c, glycosylated hemoglobin; T1D, type 1 diabetes.
Determination of HYPO, LI, and MAGE scores
The methods for calculation of HYPO and LI scores and for calculation of the MAGE have been described previously. 10,11 The calculation of the HYPO and LI scores requires that there are at least 28 days of capillary blood glucose tests within a 35-day period with at least four tests per day. For calculation of the MAGE, the SMBG must contain 2 consecutive days with at least seven capillary blood glucose tests on each day. It was not always possible to calculate all three scores from a single SMBG. In some cases, the data requirements were satisfied for calculation of both HYPO and LI scores but not MAGE, or vice versa.
Assessment of HYPO, LI, and MAGE consistency
To examine the serial consistency of HYPO, LI, and MAGE scores, data from all 152 subjects providing at least one suitable SMBG were analyzed; in total, 288 MAGE calculations were available for analyses of repeated assessments (Supplementary Fig. S1). Only 143 of these 152 subjects satisfied data requirements to calculate the HYPO and LI scores; in total, 259 HYPO and LI calculations were available for analyses of repeated assessments (Supplementary Fig. S1).
Comparison of continuous glucose monitoring with HYPO, LI, and MAGE scores
In addition to collecting SMBG, subjects underwent blinded CGMS (iPro®; Medtronic, Northridge, CA) for 72 h every 12 months until they received a transplant or were deemed ineligible. The CGMS can provide detailed information about glycemia over several days with little additional work for the patient, but is limited by the shorter assessment period. For the analyses comparing the performance of HYPO, LI, and MAGE with CGMS data, only data from subjects for whom all three scores could be calculated from a single blood glucose record and who had an eligible CGMS recording of at least 48 h in duration performed prior to transplant were included. A single dataset at the visit just prior to transplant was included for each subject. Seventy-five subjects had suitable CGMS data and an SMBG containing sufficient data to calculate HYPO, LI, and MAGE (Supplementary Fig. S1). CGMS data were missing for 62 subjects who otherwise had eligible SMBG due to subsequent protocol ineligibility (n=38), transplantation (n=6), CGMS malfunction (n=7), or other reason (n=12). Of the 75 subjects with suitable CGMS data, 51 (68%) used continuous subcutaneous insulin infusion therapy, including seven (9%) with real-time continuous glucose monitoring. No subjects switched treatment modality prior to transplant. The CGMS summary data generated by Medtronics proprietary software were entered into the trial database. The investigators were unable to access the raw sensor data.
Statistical methods
The serial consistencies of HYPO, LI and MAGE were evaluated using the ICC, which is computed as the ratio of the between-subject variance to the sum of the between-subject variance and the within-subject variance. This value ranges between 0.0 and 1.0 and is an estimate of the correlation between repeated observations on the same subject. The relationships among HYPO, LI, MAGE, and CGMS summary data were explored using Spearman's correlation coefficient. Specifically, HYPO, LI, and MAGE scores were compared against the proportion of time spent <54 mg/dL by CGMS as a measure of clinically significant hypoglycemia exposure, 17 as well as against the CGMS SD and the CGMS coefficient of variation (CV) as measures of glucose variability. 12 Statistical significance was considered at P<0.05 (two-tailed).
Results
HYPO, LI, and MAGE scores
Up to nine SMBG records, collected at 6-month intervals, were included per subject, with the median number being two. The mean number of daily blood glucose values recorded remained seven through five consecutive assessments for LI (Supplementary Table S2). The serial consistency of HYPO, LI, and MAGE data for each subject included in the analyses is illustrated in Figure 1. LI was the most consistent measure (ICC=0.70 [95% confidence interval, 0.59, 0.78]), followed by the HYPO score (ICC=0.51 [95% confidence interval, 0.36, 0.63]), whereas MAGE was the least consistent measure (ICC=0.36 [95% confidence interval, 0.21, 0.50]) (Supplementary Table S3).

Score consistency: serial consistency of pretransplant (or until deemed ineligible) scores for
The median (interquartile range) scores calculated from the blood glucose records were as follows: HYPO score, 1,419 (717–2,707); LI, 550 (397–712); and MAGE, 158 (123–201). The percentages of scores above inclusion criteria threshold were as follows: 63% of HYPO scores were >1,047; 72% of LI scores were >433; 76% had both HYPO and LI scores above the 75th percentile of overall T1D clinic patients; and 96% of Clarke scores were ≥4 (Fig. 2). Of the 143 subjects with complete HYPO score and LI data, key glycemic inclusion criteria for CIT trials were met by 94 subjects for the HYPO criterion (>1,047), 101 subjects for the LI criterion (>433), and 108 subjects for the composite criteria (HYPO score of >423 and LI of >329).
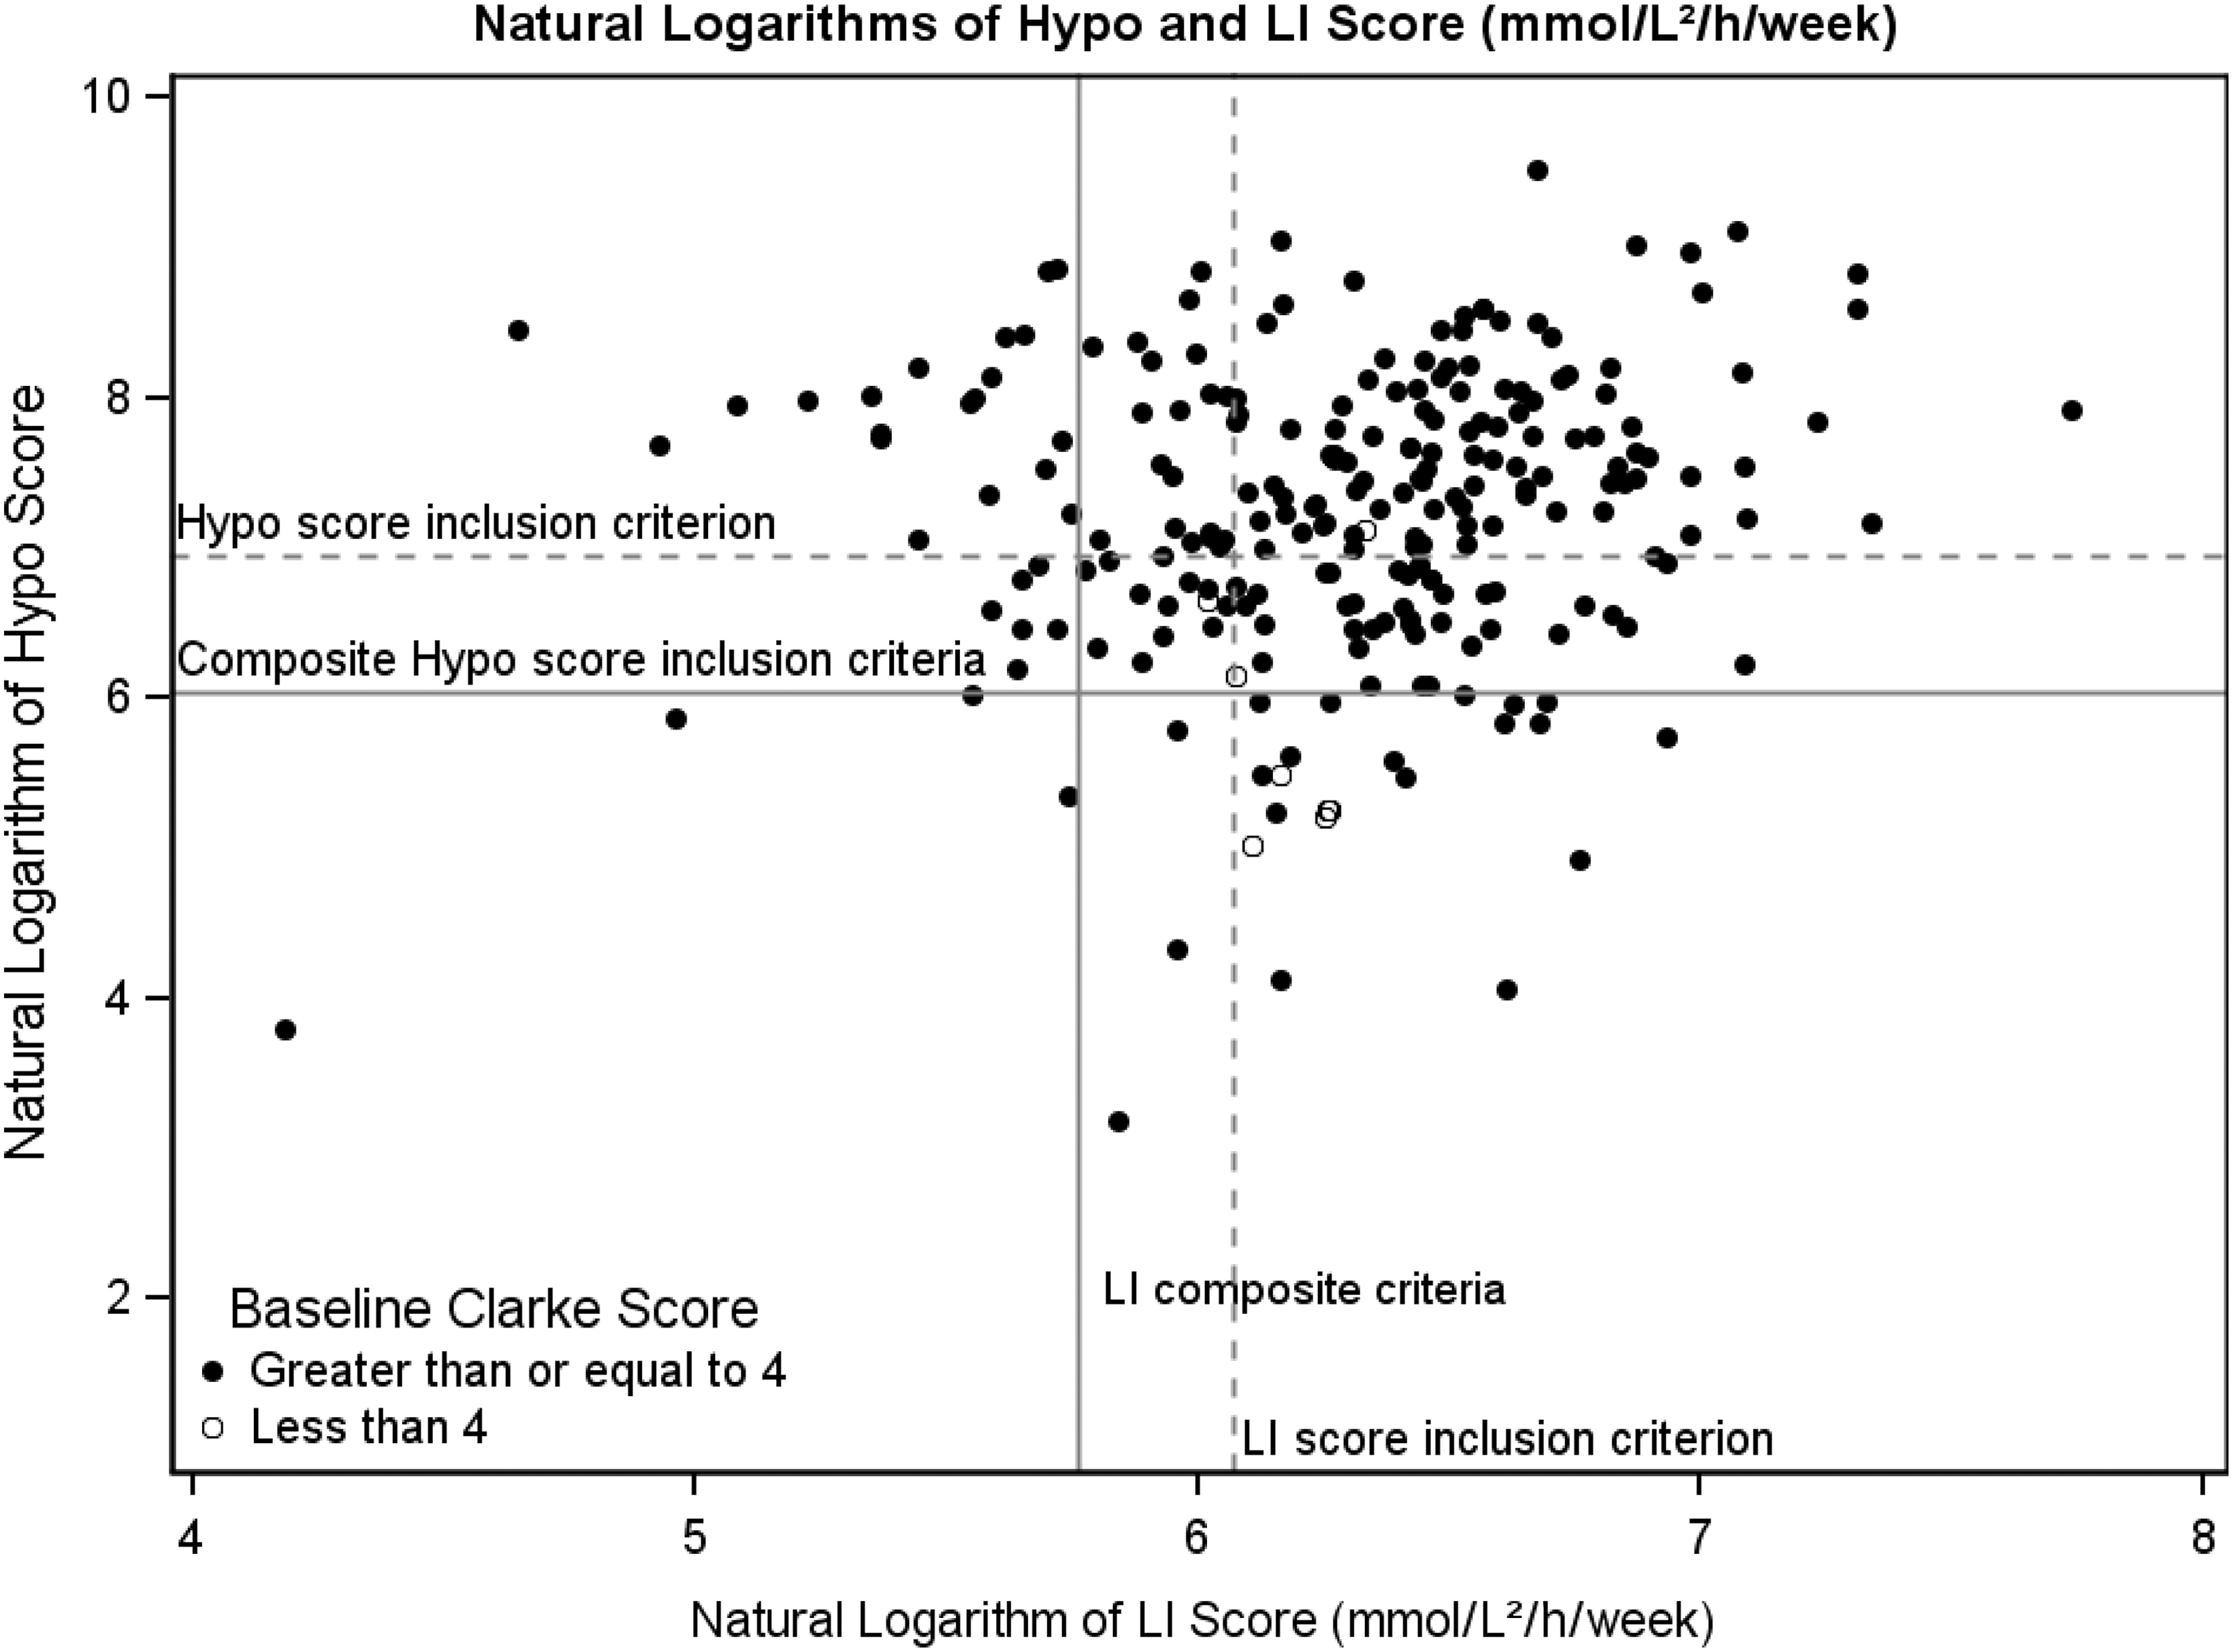
Scatter plot of log HYPO score and Lability Index (LI) calculated from the blood glucose record. The dotted line indicates the 90th percentile of the general type 1 diabetes population, and the solid line is the 75th percentile 10 ; these are the thresholds used for eligibility determination in the Clinical Islet Transplantation trials.
Comparison of SMBG-derived scores with CGMS
The CGMS summary data and HYPO, LI, and MAGE scores from the 75 subjects having CGMS data are presented in Supplementary Table S4. The mean absolute difference for the CGMS data was 13±6%. The mean scores for HYPO, LI, and MAGE in this subset are not different from those of the whole sample described earlier. The mean time spent with blood glucose levels below 54 mg/dL was 1 h 37 min per day (with a range between 0 and 9 h 42 min per day). The mean time spent above 180 mg/dL was 12 h 13 min per day (with a range between 0 and 24 h per day).
The relationships between the SMBG derived scores and the CGMS summary data are shown in Table 2. The HYPO score was significantly correlated with both CGMS percentage of time spent <54 mg/dL (r s=0.57, P<0.0001) and with CGMS CV (r s=0.36, P=0.001), but not with CGMS SD (r s=−0.06, P=0.6). The relationships between HYPO score and CGMS percentage of time spent <54 mg/dL and with CGMS CV are shown in Supplementary Figure S2. Although correlated with each other (r s=0.56, P<0.0001), neither LI nor MAGE was correlated with CGMS SD (r s=0.16 and 0.17, respectively; P=not significant for both) or with CGMS CV (r s=−0.10 and −0.14, respectively; P=not significant for both).
Spearman correlation coefficients (r s) are shown for HYPO score, Lability Index (LI), mean amplitude of glycemic excursion (MAGE), and continuous glucose monitoring system (CGMS) summary data.
CV, coefficient of variation.
Discussion
The distribution of HYPO and LI scores, derived from 4-week SMBG, clearly demonstrate that the subjects enrolled in the CIT Consortium islet transplant trials represent a highly selected subset of individuals with T1D who had frequent, severe hypoglycemia and glycemic lability. In these subjects, the serial HYPO and LI scores were less variable upon repeat assessment than serial MAGE scores.
Although LI and MAGE provide quantitative measures of glucose variability and are closely correlated, LI was more consistent (i.e., less variable over time). The variability of repeated measures of MAGE, months apart, in this population where extreme glycemic variability is the norm is likely due to the short observation period. There is a greater chance that the 2-day period is atypical, compared with the 28-day evaluation period used to calculate LI. Although the SMBG requirements for LI (four tests per day for 28 days) may be more demanding than the seven tests per day on 2 consecutive days required for MAGE, the numbers of SMBG records (numbers are provided in Supplementary Fig. S1) that satisfied the criteria for the calculation of MAGE and LI were similar. In this population of patients with long-standing T1D, the use of LI to assess glycemic lability is both preferable and feasible. It is important to recognize that LI is affected by the frequency of SBGM such that increased frequency of monitoring will result in a higher LI. In our study, which required a minimum of four tests per day, the frequency of SMBG was consistent over time, with subjects testing, on average, seven times daily. Thus, the consistency of LI reported here likely depended on the consistency of frequent SMBG practiced in this population of patients with long-standing T1D.
The HYPO score comprises two components: first, a score calculated from the SMBG for each episode of hypoglycemia (glucose level of <54 mg/dL) is tallied over the 28-day observation period, where symptomatic episodes requiring third-party assistance receive a higher score; and second, a component based on historical recall of hypoglycemic events requiring assistance during the preceding 12 months. For subjects with the highest HYPO scores, the high score is generally driven by the historical component. Because HYPO scores were calculated every 6 months in this study, there was some overlap of the historical component between sequential measurements. Subjects having initial high HYPO scores due to historical events occurring more than 12 months earlier may have lower HYPO scores at subsequent assessments because those historical events no longer contribute to the current score. Thus, changes in the historical recall component in those with the highest scores may explain the greater variability of HYPO compared with LI.
The calculation of HYPO and LI is labor-intensive, both for the subject collecting the data and for those who have been trained to calculate the scores. Subjects not only are required to perform four blood glucose tests daily for 28 days, but must also record a description of the symptoms, circumstances, and treatment for each episode of hypoglycemia. Potentially, CGMS could provide a means to assess glycemic variability with minimal input from the individual being assessed and automated calculation of summary statistics. In this study, subjects were asked to wear the CGMS device for 3 days, but subjects with only 48 h of recordings, because of sensor dropout or early sensor removal, were included. Consequently, the period evaluated by CGMS was relatively short and, like MAGE, may be subject to sampling error because of the high levels of glucose variability in this population.
Nevertheless, the HYPO score was correlated with both the proportion of time spent below 54 mg/dL and with the CGMS CV, but not with CGMS SD. This suggests that the risk of hypoglycemia associated with glucose variability is influenced by mean glucose levels (both of which are reflected by CGMS CV, whereas only variance is reflected by CGMS SD). CGMS has been a powerful tool to identify unrecognized, subclinical hypoglycemia. Subclinical hypoglycemia impairs glucose counterregulatory mechanisms, driving hypoglycemia-associated autonomic failure and impaired hypoglycemic awareness, which are associated with increased risk of severe hypoglycemic events. 1,18 In a subgroup of 19 subjects meeting the CIT trial glycemic inclusion criteria who underwent paired hypoglycemic and euglycemic clamps to determine glycemic thresholds for glucose counterregulation (measured as endogenous glucose production) and autonomic symptom generation (M.R.R., unpublished data), 15 subjects had absent glucose counterregulation, and 14 had absent symptom awareness, using the previously defined glycemic threshold for each response as <54 mg/dL. 6 Thus, the HYPO score and LI, as defined as inclusion criteria for the CIT trials, do indeed identify individuals with compromised physiologic defenses against the development of hypoglycemia.
It was surprising that there was no correlation between CGMS SD or CGMS CV and either LI or MAGE, even though LI and MAGE correlated with each other. Although CGMS SD provides some representation of glycemic variability, it does not capture the same information as LI or MAGE. SD simply describes the arithmetic variance in values around the mean, irrespective of their sequence, whereas the variability captured by LI and MAGE reflects clinically relevant swings in blood glucose level from high to low in terms of either magnitude (MAGE) or both magnitude and frequency (LI). Thus a sequence of SMBG values (75, 120, 160, 200, 250, 280 mg/dL) with a high SD may not demonstrate glycemic lability when compared with a series of labile glucose values (40, 120, 40, 160, 55, 120 mg/dL) that has a smaller SD. Glucose SD is most useful when restricted to a defined time period (e.g., fasting plasma glucose levels) to describe interday variations, but may not be the best metric to quantify variability over a period of days or weeks.
Summary data produced by software from commercially available CGMS devices are predominantly designed for clinical use. Although CGMS summary data provide complementary information, they do not appear to be sufficiently detailed to be used as a replacement for HYPO score and LI calculated from SMBG to fully assess hypoglycemia and glycemic lability, respectively. Although time spent in the hypoglycemic range and CGMS CV both correlated with HYPO score, CGMS does not directly assess hypoglycemia unawareness and may not fully assess risk for episodes of severe hypoglycemia. 19 Glycemic lability might be more fully assessed if CGMS devices were used over a longer period of time, which may now be feasible because current CGMS sensors can be worn for up to 7 days.
We used the software-generated CGMS SD and CGMS CV available at the start of the CIT trials as measures of glycemic variability for this analysis as there is no consensus for how best to use CGMS to quantify glucose variability. 20 If we had had access to raw sensor data, it would have been possible to calculate other CGMS summary measures, which include a time component (e.g., continuous overlapping net glycemic action) 21 or glucose rate of change SD 22 ) and might ultimately relate better to glycemic lability as captured by the LI.
In conclusion, this is the first report to compare the performance of various tools to quantify hypoglycemia severity and glycemic lability in patients with long-standing T1D. Although labor-intensive, the HYPO score and LI appear to be reliable assessments for identifying subjects experiencing severe problems with hypoglycemia and extreme glycemic lability. MAGE is a less reproducible measure of glycemic variability than LI and does not appear to provide additional information. Currently, summary data from short periods of CGMS provide relatively rapid assessments but do not appear to provide sufficiently robust data to replace SMBG scores in fully characterizing severe hypoglycemia and glucose lability. The HYPO score and LI thus appear to be useful tools that may be valuable as surrogate end points in trials of treatments and technologies designed to reduce hypoglycemia and/or glycemic lability, including islet transplantation.
Footnotes
Acknowledgments
This work was performed as a project of the CIT Consortium, a collaborative clinical research program headquartered at the National Institute of Diabetes and Digestive and Kidney Diseases and the National Institute of Allergy and Infectious Diseases and supported by U.S. Public Health Services research grants U01 DK070430 (to the University of Pennsylvania), U01 DK070431 (to the University of Iowa), U01 DK070460 (to the University of Miami), U01DK085531 (to the University of California San Francisco), U01 AI065191 (to the University of Alberta), U01 AI065193 (to the University of Minnesota), U01AI089316 (to Northwestern University), U01 AI089317 (to Emory University), and U01 5U01DK070431-10 (to the University of Illinois at Chicago), as well as by Clinical & Translational Science Awards UL1 TR000003 (to the University of Pennsylvania), UL1 TR000004 (to the University of California San Francisco), UL1 TR000050 (to the University of Illinois at Chicago), UL1 TR000114 (to the University of Minnesota), UL1 TR000150 (to Northwestern University), UL1 TR000454 (to Emory University), and UL1 TR000460 (to the University of Miami) and also by grant RO1 DK091331 (to M.R.R.). We would like to thank the referring endocrinologists and diabetologists and the industry sponsor, LifeScan Inc./Johnson & Johnson Co., for contributing their products to the CIT trials.
Author Disclosure Statement
P.A.S. has received consultancy fees from Medtronic, Canada. M.D.B., R.A., J.W.Y., W.R.C., J.C.Q., T.R.S., T.L.E., M.A.R., and M.R.R. declare no competing financial interests exist.
References
Supplementary Material
Please find the following supplemental material available below.
For Open Access articles published under a Creative Commons License, all supplemental material carries the same license as the article it is associated with.
For non-Open Access articles published, all supplemental material carries a non-exclusive license, and permission requests for re-use of supplemental material or any part of supplemental material shall be sent directly to the copyright owner as specified in the copyright notice associated with the article.