




Abstract
Background:
Little is known about the influence of exogenous insulin and actual glucose levels on the release of endogenous insulin in insulin-treated type 2 diabetes mellitus (T2DM) patients. This study investigated the interaction among serum endogenous insulin (s-EI), serum exogenous insulin aspart (s-IAsp), and blood glucose levels in an experimental short-term crossover design.
Study Design and Methods:
Eight T2DM patients (63.52 years old; range, 49–69 years; mean body mass index, 28.8±3.8 kg/m2) were randomized to treatment with individual fixed doses of insulin aspart (0.5–1.5 IU/h) as a continuous subcutaneous insulin infusion (CSII) during a 10-h period on two occasions with different duration of hyperglycemia: (1) transient hyperglycemia for 2 h (visit TH) and (2) continuous hyperglycemia for 12 h (visit CH).
Results:
During steady state the variances of plasma glucose (p-glucose), s-IAsp, and s-EI were equal within visit TH and within visit CH, but variances were significantly higher during visit CH compared with visit TH. The s-IAsp reached lower levels at visit CH compared with visit TH (test for slope=1, P=0.005). The s-EI depended on p-glucose in a nonlinear fashion during the first 100 min of both visits when s-IAsp was undetectable (adjusted R 2=0.9). A complex but statistically significant interaction among s-IAsp, s-EI, p-glucose, and patients was observed during measurable s-IAsp levels (adjusted R 2=0.70).
Conclusions:
Endogenous and exogenous insulin showed higher variation during continuous hyperglycemia. Significantly lower levels of exogenous insulin were observed following CSII during continuous hyperglycemia compared with transient hyperglycemia. Endogenous insulin levels could in a complex way be explained by an individual interaction among p-glucose and serum exogenous insulin, if present.
Introduction
C
Whether the decrease in s-EI concentration was only due to the falling plasma glucose (p-glucose) levels or also directly influenced by the rising serum exogenous insulin levels could not be answered.
Thus the aim of this study was to explore the interaction among s-EI concentrations, levels of serum exogenous IAsp (s-IAsp), and glucose levels in a short-term experiment. Patients with T2DM treated with fixed doses of IAsp were exposed to transient hyperglycemia of different duration on two occasions.
Subjects and Methods
Patients
Eleven Caucasian patients (four females and seven males) diagnosed with T2DM and treated with metformin as monotherapy were screened and included in the trial. Data were available from eight patients who completed both visits; three patients dropped out because of protocol violation. Baseline data of the eight trial patients are shown in Table 1.
Data are mean±SD values or median (range), as indicated.
HbA1c, glycated hemoglobin; HDL, high-density lipoprotein; LDL, low-density lipoprotein.
Inclusion criteria were diagnosis of T2DM according to the 1999 World Health Organization classification 14 for at least 6 months, body mass index ranging from 25 to 42.0 kg/m2, insulin-naive patients, age between ≥35 and ≤75 years, and plasma glycated hemoglobin level of <9% (<75 mmol/mol).
Exclusion criteria were known or suspected allergy to the trial product or components of the trial product, severe cardiac insufficiency, unstable angina pectoris, acute myocardial infarction within the last 12 months, severe and uncontrolled hypertension, impaired kidney or liver function, and treatment with any medication that could significantly affect p-glucose levels.
Study design
This trial was an open-label, randomized, two-period crossover study, conducted at the Department of Endocrinology and Internal Diseases, Aarhus University Hospital, Aarhus, Denmark, in accordance with the principles of the Declaration of Helsinki. The trial protocol was approved by the Central Denmark Region Committees on Health Research Ethics and the Danish Health Authority. The trial was performed according to the principles of the Good Clinical Practice. All study participants were provided with written and oral information about trial activities and signed an informed consent before entering the study.
The patients participated in a screening visit and two treatment visits (visit TH [transient hyperglycemia for 2 h] and CH [continuous hyperglycemia for 12 h]). The order of treatment visits was randomized at the screening visit, where all participants also underwent a physical examination.
Participants were treated with metformin before and during the study. There was a 7–21-day interval between each treatment visit.
The patients arrived at the hospital at 17:30 h on the trial day. A standard dinner of approximately 600 kcal was served at 18:00 h, and the patients were fasting for the rest of the study period except for free access to water. The patients received an intravenous infusion of 20% glucose for 2 h (20:00–22:00 h) in order to achieve transient hyperglycemia (p-glucose levels of 10–15 mmol/L) at visit TH. The glucose infusion was continued for an additional 10 h period (22:00–08:00 h) at visit CH in order to maintain continuous hyperglycemia (10–15 mmol/L). The patients were in the supine position during both experiments, except for bathroom visits. The patients were asked not to perform strenuous physical exercise during the trial visits in order to minimize changes in insulin sensitivity during the study period. Approximately 315.8 mL (range, 221.7–425.3 mL) of 20% glucose was given intravenously at visit TH and 1,317.7 mL (range, 830.7–2,229.8 mL) at visit CH.
A continuous subcutaneous infusion of IAsp (CSII) at an individual fixed dose rate of 0.5–1.5 IU/h, which was equal at both visits for each individual patient, was given for 10 h between 22:00 h and 08:00 h at both visits. All patients received an IAsp dose equal to approximately 0.5 IU/h during both visits (the total mean IAsp dose was 5.2±0.49 IU at visit TH and 5.2±0.53 IU at visit CH) (P=0.35). An insulin pump (Paradigm™ Veo 554; Medtronic, Northridge, CA) was used for continuous subcutaneous infusion of IAsp. IAsp (100 IE/mL; NovoRapid®; Novo Nordisk, Bagsvaerd, Denmark) was used as the trial drug.
Blood sample collection and measurements
A catheter was inserted in an antecubital vein for blood sampling. Blood samples for p-glucose measurements were collected every 15 min between 20:00 and 22:00 h. Blood samples for p-glucose, s-EI, and s-IAsp were drawn every 20 min between 22:00 and 08:00 h. Samples were allowed to clot for at least 30 min at room temperature, except for p-glucose, and were centrifuged at 4°C for 10 min at 3,600 g. Serum was separated and immediately frozen at −20°C until analysis.
Assays
The p-glucose levels were measured by the glucose oxidase method on a point-of-care Contour™ device (Bayer AG, Leverkeusen, Germany). The measuring range was 0.6–33.0 mmol/L, with an imprecision of 4%, total error of measurements of approximately 10%, and accuracy of ±20%, according to the requirements of ISO 15197. 15
The s-EI levels were analyzed in our Medical Research Laboratory by two monoclonal antibody-based insulin enzyme-linked immunsorbent assay kits (Dako A/S, Copenhagen, Denmark). The detection limit of the assay is 3 pmol/L. The intra-assay precision (percentage coefficient of variation) of serum insulin mean concentrations was as follows: 7.5% for levels of 39 pmol/L and 269 pmol/L and 5.1% for 1,240 pmol/L. The interassay precision was 9.3% for 40 pmol/L, 8.9% for 287 pmol/L, and 4.2% for 1,230 pmol/L. High concentrations of lipid or bilirubin do not interfere with the assay. There was no interference from rheumatoid factor, heterophilic anti-mouse antibodies, or purified hemoglobin up to 50 μg/mL. There was no “high dose hook effect” or cross-reactivity with human C-peptide or intact human proinsulin (biosynthetic).
Level of s-IAsp was analyzed at Novo Nordisk (Måløv, Denmark) by the luminescent oxygen channeling immunoassay (LOCI™). The limit of detection is 5 pmol/L. The intra-assay precision was 1.58–7.1%, the interassay precision was 3.71–11.7%, and the accuracy was 4.02–13.9% for IAsp mean concentrations in human serum tested at 11.5–5131 pmol/L levels. 16 There was no cross-reactivity from human insulin, insulin detemir, and insulin glargine. There was no interference from hemoglobin up to 300 μmol/L, bilirubin up to 1,000 μmol/L, and lipids up to 10,000 mg/L.
Statistical analysis
This study did not allow us to make a statistical power calculation, and thus sample size was set arbitrarily. The patients served as their own controls owing to the crossover design of the study.
The variances for p-glucose, serum exogenous insulin, and s-EI were graphed in variance plots using a pooled variance and Bonferroni limits as guidelines for equality of variances. Levene's test for equal variances was used to confirm the findings.
To verify that s-IAsp values were the same during visit TH and visit CH, time-paired means of s-IAsp level from each visit were used in a regression analysis using a benchmark line y=x (i.e., with intercept 0 and slope 1). The benchmark was that the mean amount of s-IAsp over time was the same at both visits. This analysis is supplied with a Wilcoxon rank-sum test.
Two different regression analyses were needed to model the relation between s-EI and p-glucose concentration, depending on whether serum exogenous insulin levels were detectable (time from 200 to 400 min) or not (time from 0 to 100 min.).
The regression analysis was split into three time periods with different characteristics: the first 100 min, with immeasurable s-IAsp levels in serum; the dynamic period, between 200 and 400 min; and the stabilizing period, from 400 min and onward. Autocorrelation of the residuals was handled as previously described. 17 In the first regression analysis, with no presence of s-IAsp, it turned out that autocorrelation could be ignored (by Durbin Watson test, P=0.05), but variance-stabilizing log transformation (Box Cox) 17 was needed. Also, an individual quadratic term was necessary to model the relation between endogenous insulin and p-glucose. For regression models when IAsp was present, from 200 min to 400 min (including the dynamic period with rising s-IAsp levels [Fig. 1]) and from 400 min and onward (the steady–state period for s-IAsp), both variance-stabilizing transformation (Box Cox) of the endogenous insulin and handling of the autocorrelation were required. Hence the models turned out to be rather complex. An individual interaction term of blood glucose and exogenous insulin could not be tested away in either regression (dynamic or steady-state period).
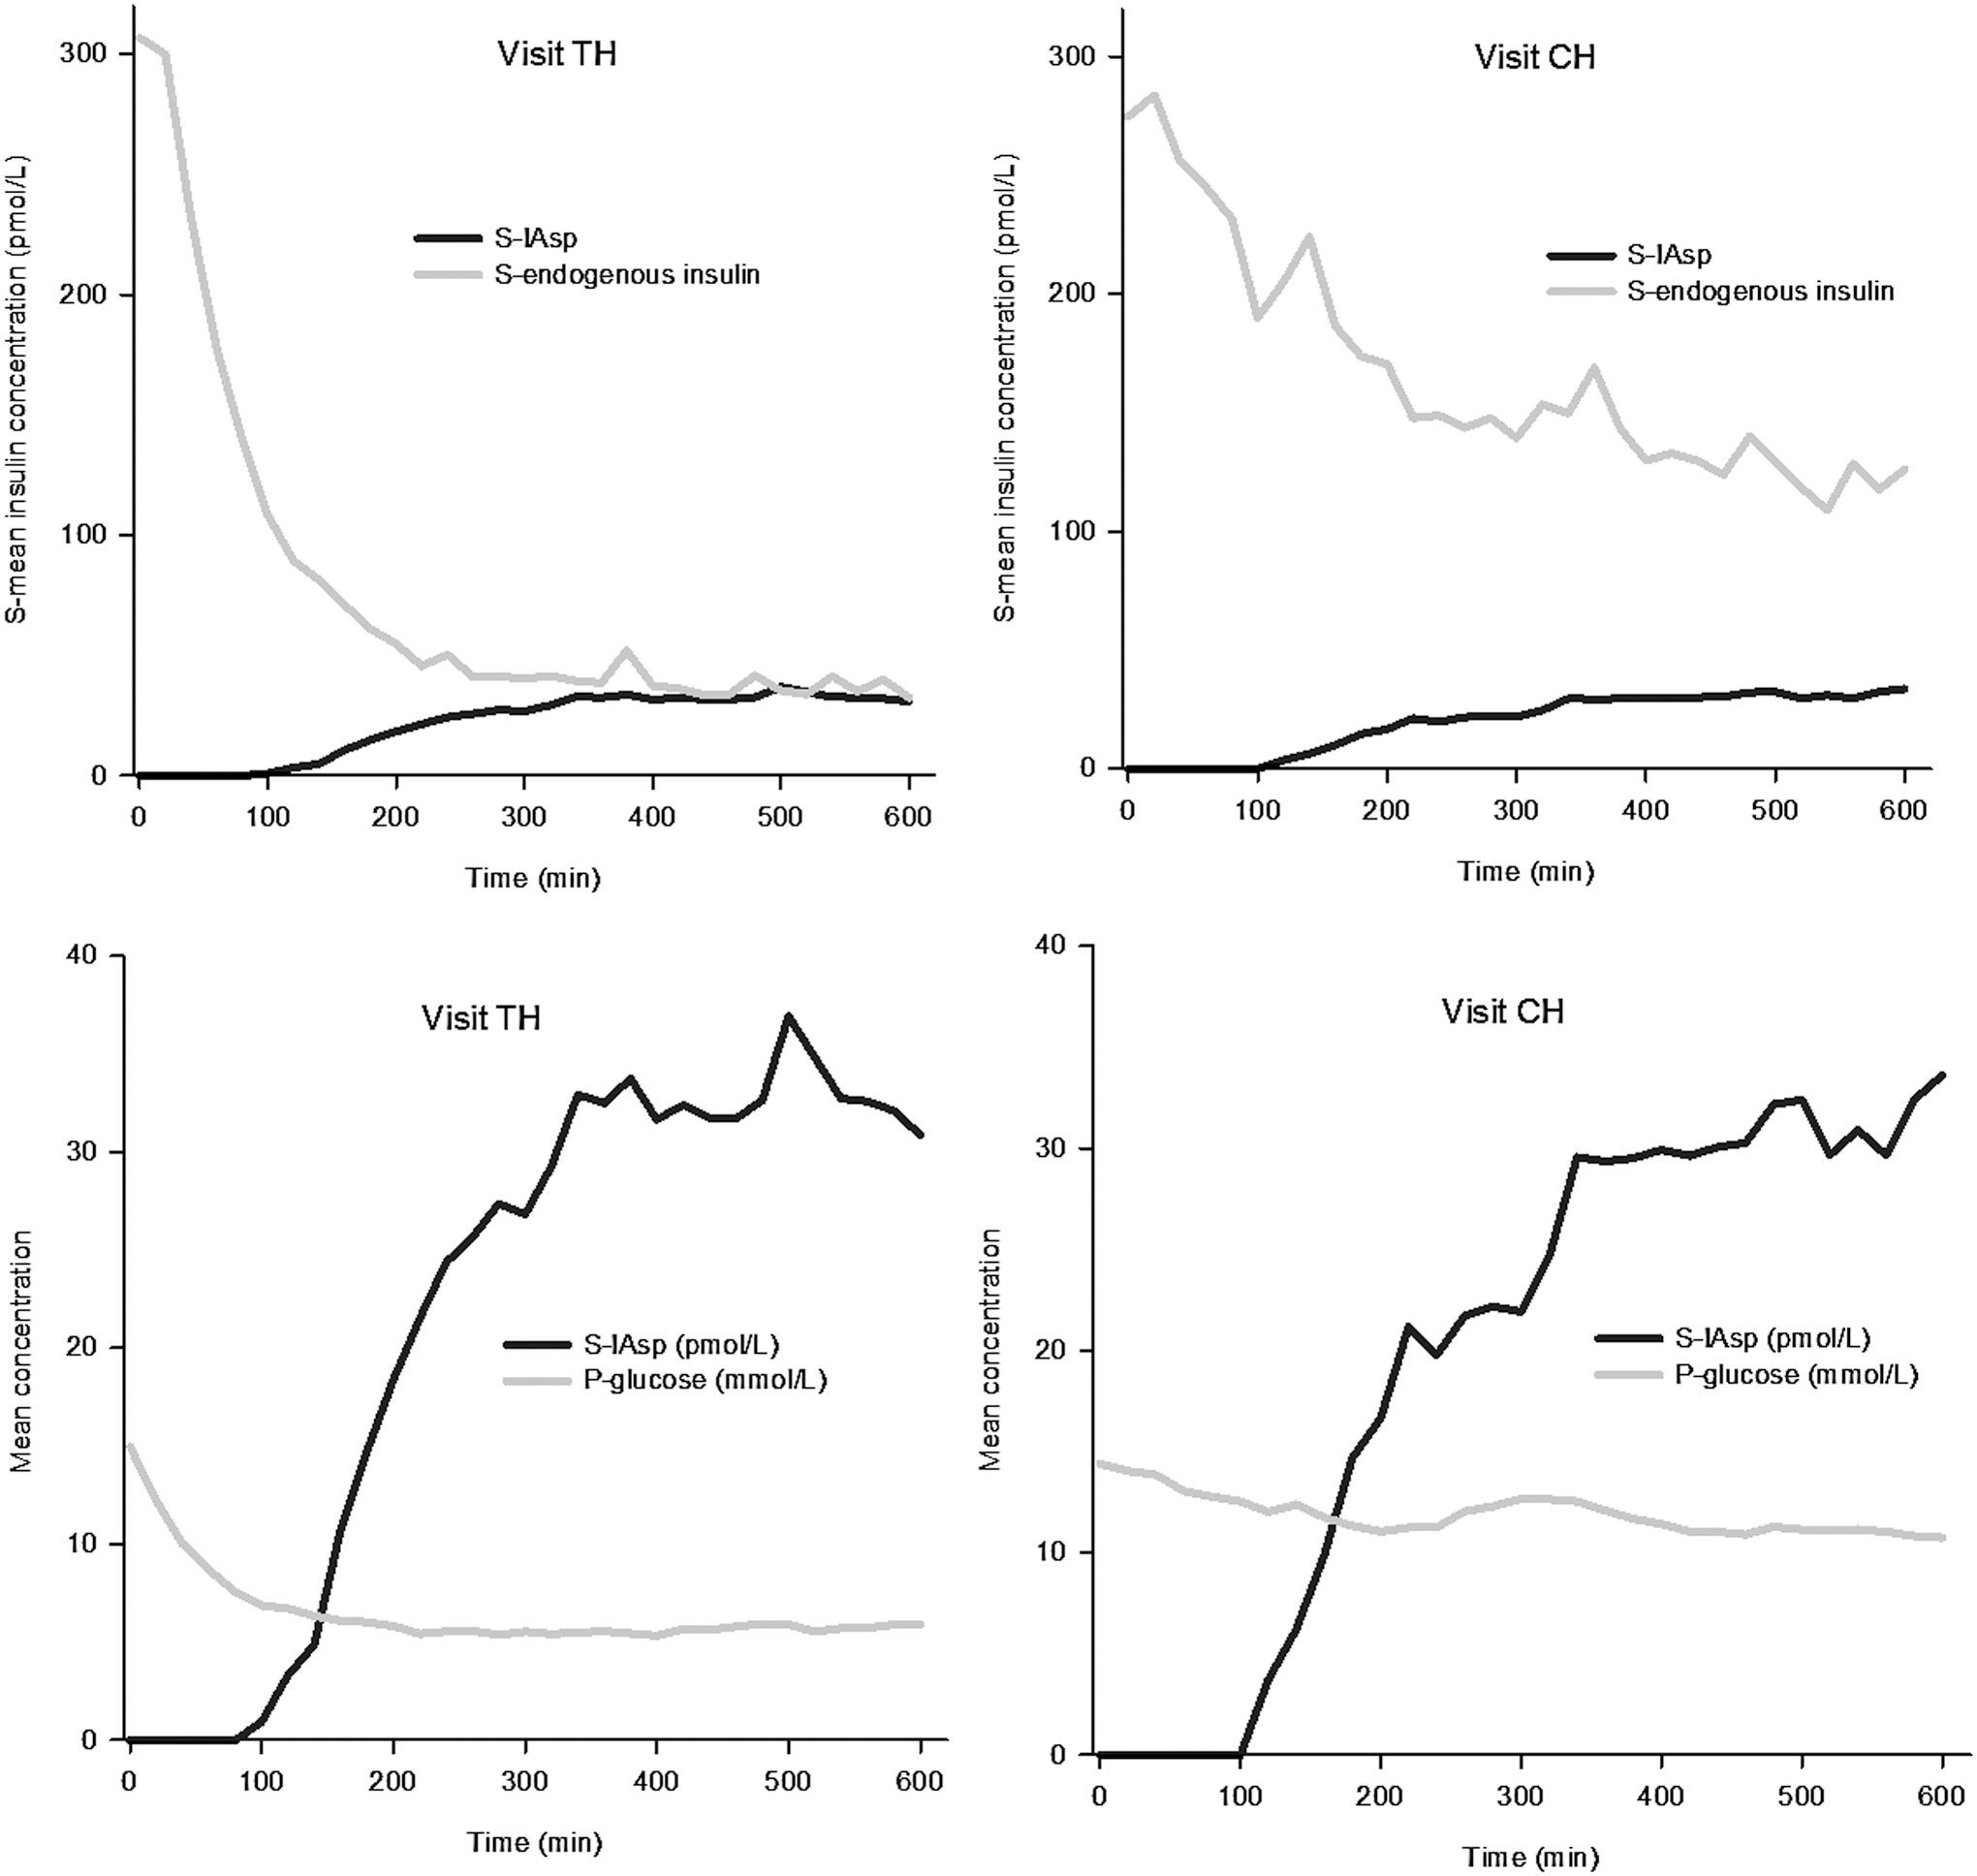
Relationship between serum (S-) exogenous insulin (insulin aspart [IAsp]) and endogenous insulin and between S-exogenous insulin and plasma glucose (P-glucose) during transient hyperglycemia (TH) and continuous hyperglycemia (CH). The black solid line depicts the S-IAsp concentration, and the gray solid line depicts
A two-sided value of P<0.05 was considered as significant. The statistical program R version 3.0.2 (R Development Core Team;
Results
Figure 1 shows mean p-glucose, serum exogenous insulin, and s-EI concentrations during transient (visit TH; Fig. 1, left panel) and continuous (visit CH; Fig. 1, right panel) hyperglycemia.
Variance plots (data not shown) displayed higher variances of p-glucose, serum exogenous insulin, and s-EI during visit CH compared with visit TH (Fig. 1). From time 200 min to 600 min, a pattern of equal variances emerges within TH and CH visits across p-glucose, serum exogenous insulin, and s-EI (by Levene's test for equal variance, P=0.06–1.00). The variances differed between TH and CH visits for p-glucose, serum exogenous insulin, and s-EI from time 200 min to 600 min (by Levene's test for equal variance, P=0.00, 0.01, and 0.00, respectively). This is in agreement with the variance plots.
Scatter plots (Fig. 2) demonstrate a relationship between s-IAsp and p-glucose and between s-IAsp and s-EI during the TH and CH visits. However, this relationship cannot be described as a direct or an indirect interaction.
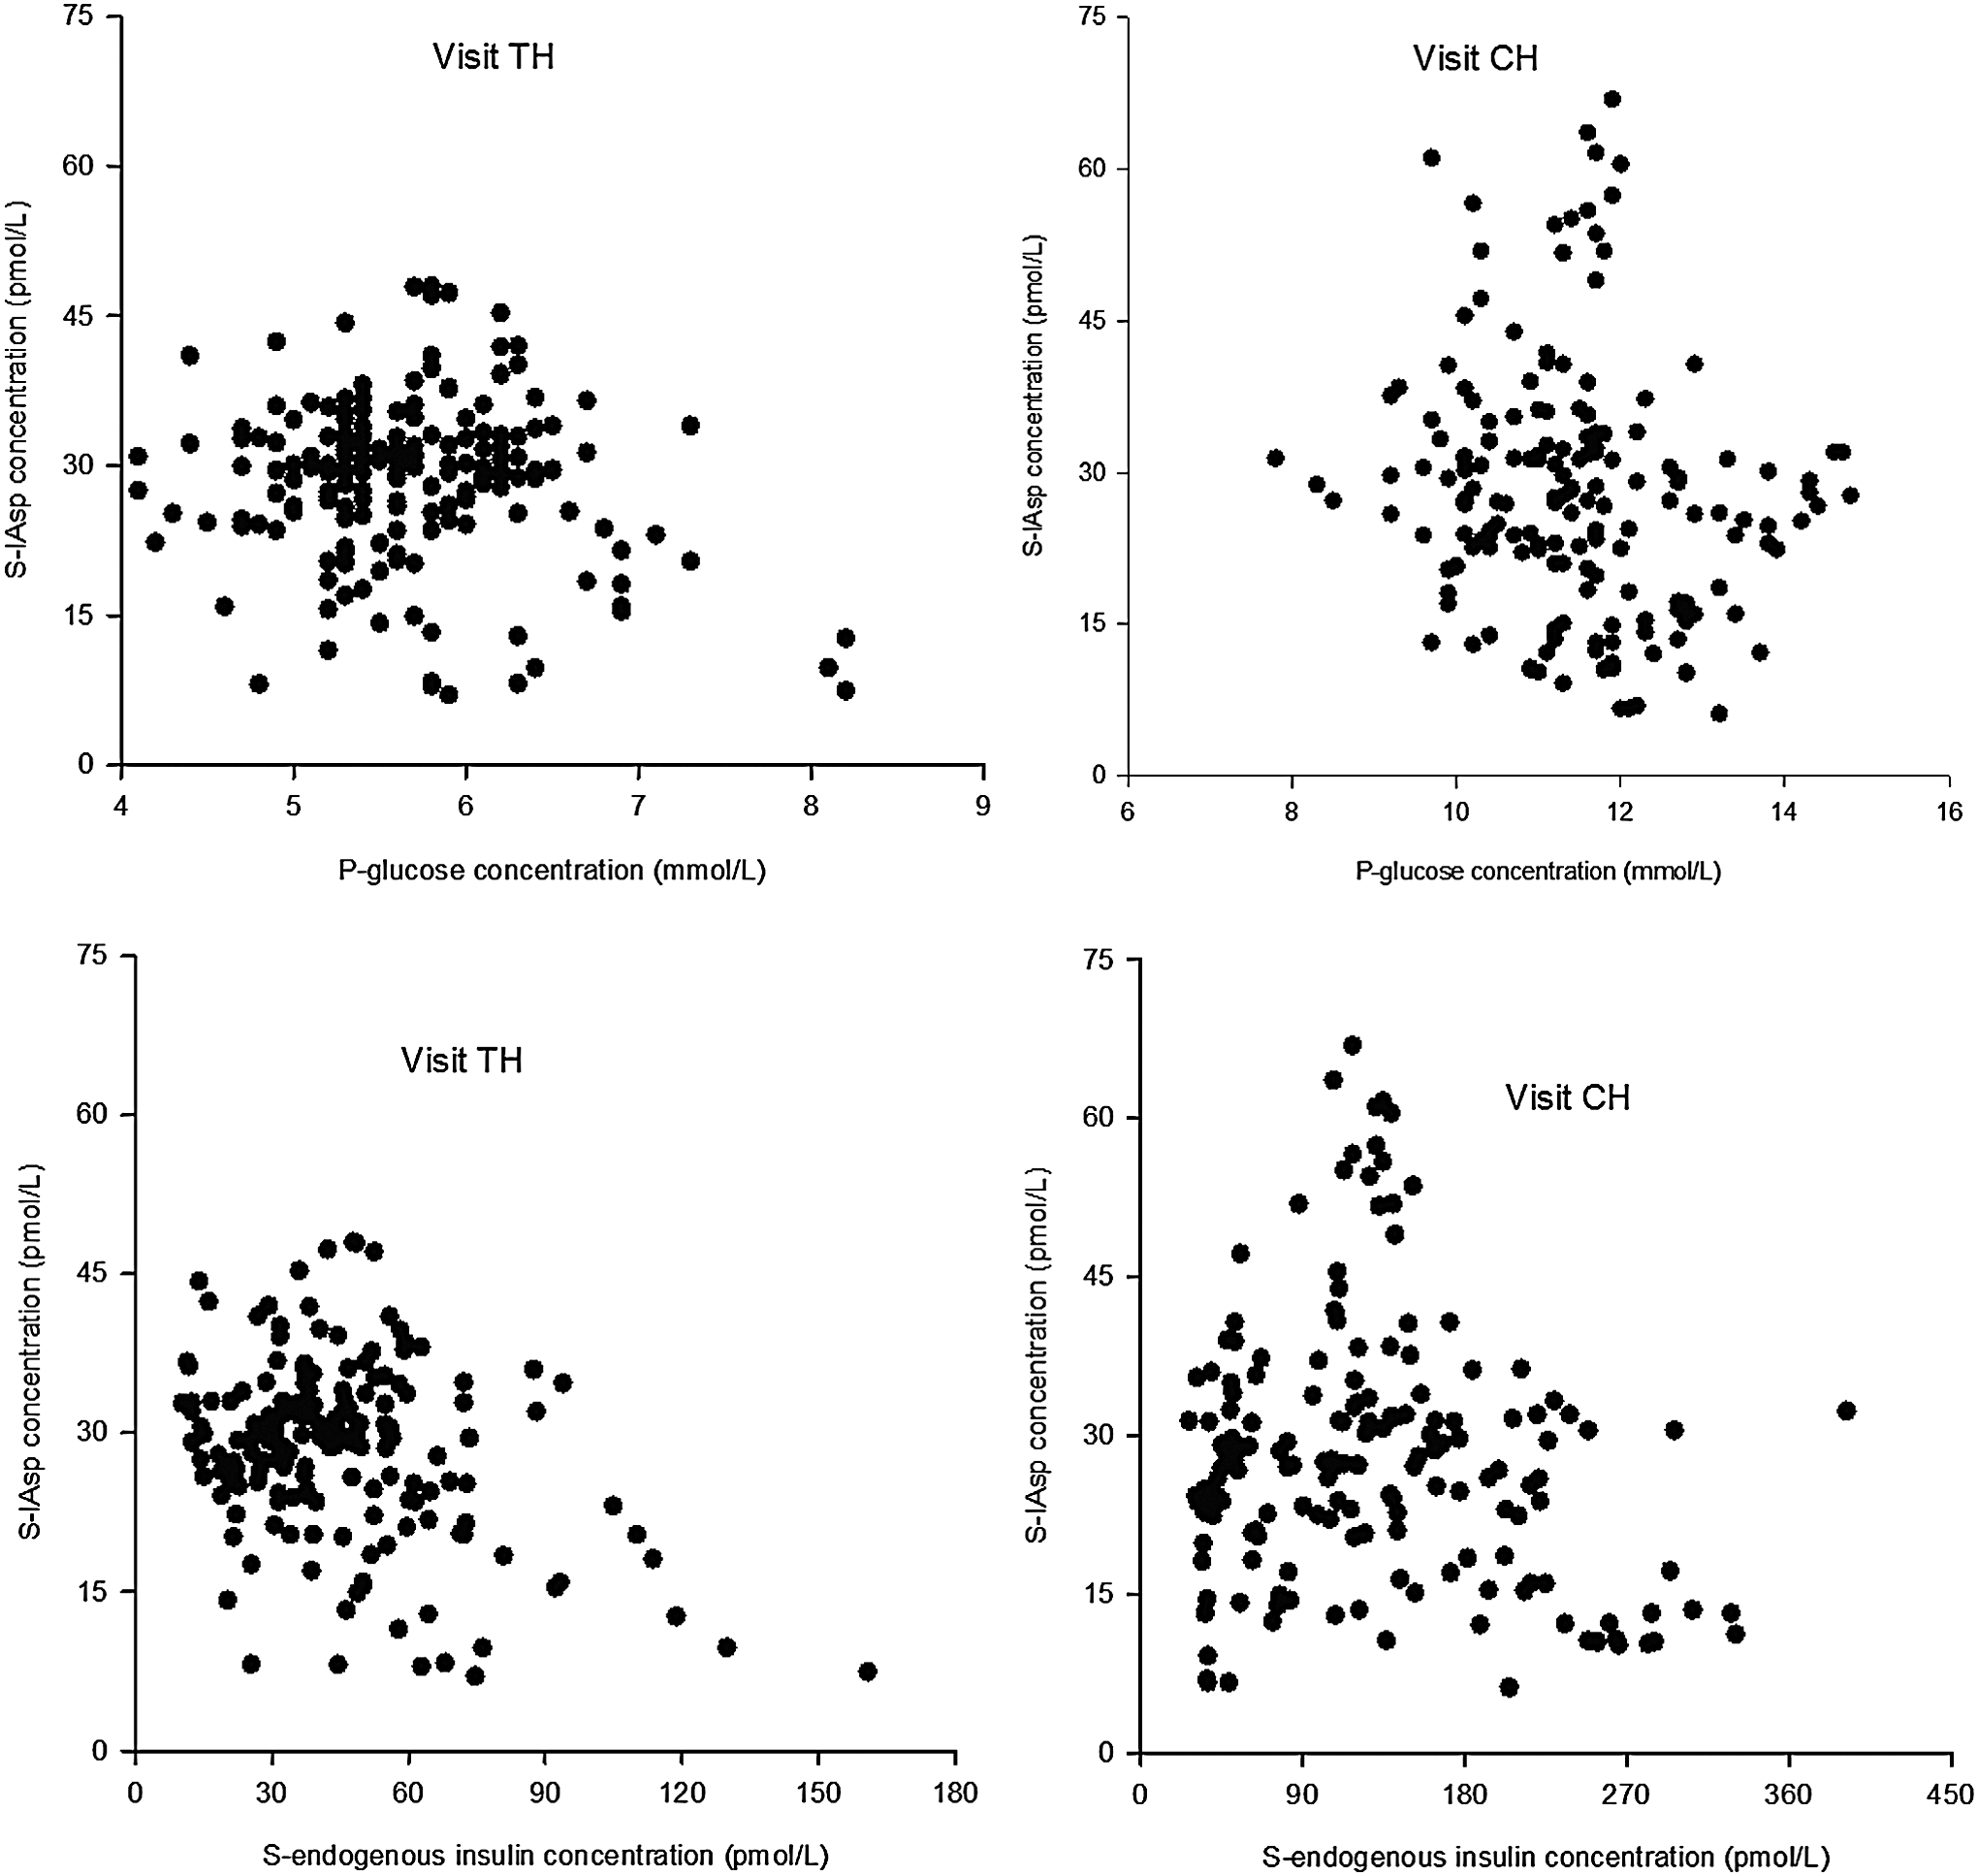
Interactions between serum (S-) exogenous insulin (insulin aspart [IAsp]) and plasma glucose (P-glucose) and between S-endogenous insulin and S-exogenous insulin during transient hyperglycemia (TH) and continuous hyperglycemia (CH).
Comparable p-glucose values were achieved during the 2-h period prior to start CSII with IAsp (–120 min) with a median p-glucose of 15.3 mmol/L (range, 14.5–16.0 mmol/L) at visit TH and 14.7 mmol/L (range, 14.0–15.0 mmol/L) at visit CH (P=0.313). The mean infused glucose volume was comparable as well (315. 5 mL for visit TH and 324.8 mL for visit CH, P=0.78). For better presentation of changes in s-EI, s-IAsp, and p-glucose over time, study results were split up into three different time periods, and data from regression analysis regarding interactions among p-glucose, s-EI, and s-IAsp are shown in Figure 3.
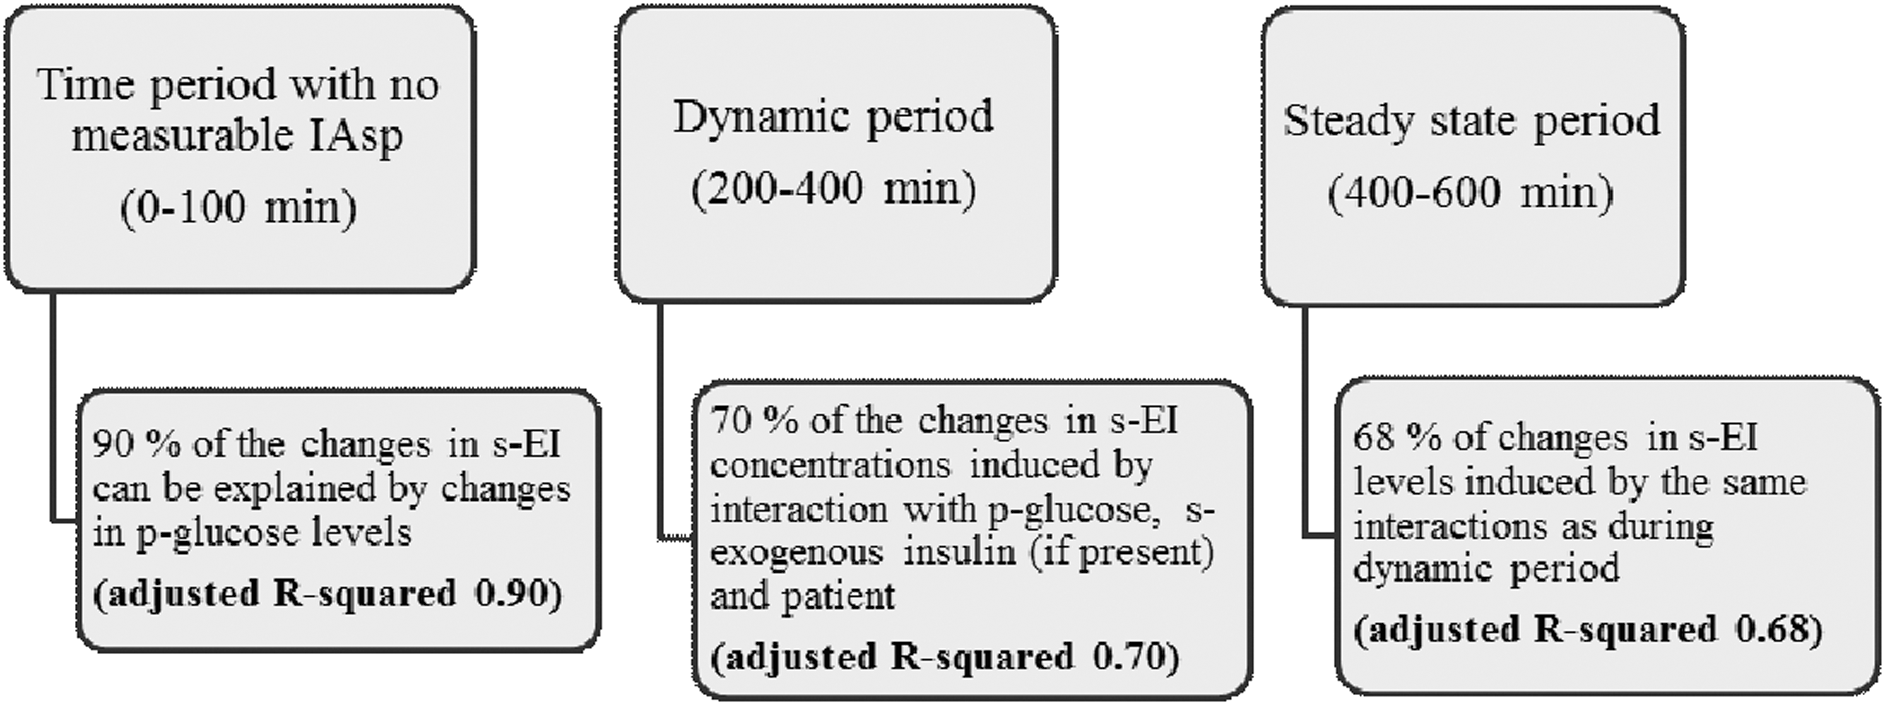
Interactions among serum exogenous (s-exogenous) insulin (insulin aspart [IAsp]), serum endogenous insulin (s-EI), and plasma glucose (p-glucose) during both transient hyperglycemia and continuous hyperglycemia visits.
Regression analysis revealed different s-IAsp concentrations at the TH and CH visits. Figure 4 shows the mean s-IAsp concentration at each time point during visit TH paired with the mean s-IAsp concentration at the equivalent time point during visit CH. The regression line of the points (solid line) lies significantly lower than the identity line. The intercept is 0 for the regression line (95% confidence interval, −1.39, 1.52), but the slope is lower than 1 (95% confidence interval, 0.87, 0.98) (P=0.005). In agreement with this, the mean concentration of s-IAsp was lower at visit CH (Fig. 1) compared with visit TH: median (range), 22.4 (0.0, 81.7) pmol/L and 26.7 (0.0, 48.0) pmol/L, respectively (by Wilcoxon test, P=0.04).

Time-paired serum insulin aspart (S-IAsp) mean concentrations during visits TH (transient hyperglycemia) and CH (continuous hyperglycemia). The black dashed line depicts the ideal line with no difference in S-IAsp concentrations between the transient hyperglycemia and CH visits. The black solid line depicts the real regression.
Equal doses of IAsp were infused in each patient at visit TH and visit CH.
Safety
Hypoglycemic episodes were defined as p-glucose concentrations of <4.0 mmol/L. One hypoglycemic reaction occurred in one patient. This patient was subsequently excluded from the analysis.
Discussion
As the purpose to maintain p-glucose levels elevated to a similar range in all study participants partly failed, an explorative statistical analysis of the variability in and between circulating concentrations of glucose, exogenous insulin, and endogenous insulin was performed.
We faced a problem of maintaining stable levels of p-glucose during continuous hyperglycemia. The higher variation of s-EI and serum exogenous insulin during hyperglycemia compared with near-normal p-glucose following transient hyperglycemia may be related to the difficulties of providing stable glucose levels during hyperglycemia.
Despite this fact, this small exploratory study revealed that s-EI and serum exogenous insulin displayed higher variation and resulted in lower levels of serum exogenous insulin during hyperglycemia compared with near-normal p-glucose levels. Furthermore, approximately 70% of the variation of s-EI levels could be explained in a complex way by an interaction among p-glucose, serum exogenous insulin, and the individuals.
An insulin analog (IAsp), which is known not to interfere with the human insulin assay, was used. This allowed us to discriminate between changes in s-EI and s-IAsp in patients with T2DM with preserved endogenous insulin secretion.
We had no prior idea of how a possible association among endogenous insulin, exogenous insulin, and p-glucose could be explained in mathematical terms and thus performed an exploratory analysis.
The strengths of our study were the randomized, short-term experimental crossover design and a simple set-up during standard conditions (resting for approximately 1.5 h before the experiments, supine position during the experiments, equal amounts of infused glucose, comparable levels of p-glucose levels before CSII, and separate analyses for s-EI and serum exogenous insulin concentration measurements). This design is, however, very different from patients' everyday life, which makes it difficult to extrapolate the meaning of our finding to the clinical situation. Patients on monotherapy with metformin were included in the study to ensure that all subjects had endogenous insulin secretion. Despite this, two study patients had very low endogenous insulin secretion compared with the other individuals. This wide variation in endogenous insulin levels may explain why the individual interaction term could not be tested away in the variance analyses. Whether patients with the lowest endogenous insulin secretion may respond more to exogenous insulin cannot be determined by the data obtained in this small study.
An interesting finding of our study was the late steady state of serum exogenous insulin, reached at 400 min. Lower s-IAsp levels during continuous hyperglycemia (visit CH) compared with transient hyperglycemia (visit TH) were observed. It may reflect increased local subcutaneous degradation of IAsp at the injection site, changed body volume of distribution, change in serum elimination half-lives, or a combination of these and maybe other factors not accounted for. In the present study, many s-IAsp measurements (53 out of 204 values at visit TH and 66 values out of 240 at visit CH) were below the detection limit (<5 pmol/L) during the first 2 h of subcutaneous IAsp infusion. We do not know if the induced hyperglycemic condition could also affect the dissociation of hexameric IAsp form into dimers and monomers and hereby slow the absorption.
Hyperglycemia impacts vascular tone owing to inhibition of nitric oxide production. 18 Changes in vascular tone could have an impact on insulin metabolism. A study has shown 50% lower plasma endogenous insulin levels and doubled insulin clearance during hyperglycemic clamp (p-glucose of 7 mmol/L). 19 We can only speculate whether delayed appearance of IAsp in serum in the present study was related to vasoconstriction and hereby decreased blood flow, which could slow IAsp dissociation or increase elimination from the blood flow.
Previous studies in T2DM patients showed graphs demonstrating a “crossover” phenomenon of endogenous and exogenous insulin (i.e., s-EI concentration decreased, when serum exogenous insulin concentration increased). 13,20 We could not reproduce this phenomenon (Fig. 1). Higher mean plasma glycated hemoglobin level, differences in blood glucose levels during the study, longer duration of diabetes, and higher exogenous insulin (IAsp) doses 13,20 in the previous study compared with our present study may in part explain the different findings.
A larger insulin depot owing to higher insulin doses in our previous study 20 would allow the release of higher amounts of exogenous insulin into the blood circulation, and vice versa. This is mirrored by a higher plasma IAsp peak concentration of approximately 100 pmol/L in the previous study 21 versus 30–40 pmol/L in our present study.
Some challenges, such as higher variation of s-EI, low and immeasurable s-IAsp concentrations, and unstable p-glucose levels during visit CH should be acknowledged as limitations of the study.
Neither lower serum exogenous insulin levels during continuous hyperglycemia compared with near-normal glycemic levels nor influence of serum exogenous insulin levels on s-EI levels has previously been described in individuals with T2DM. These interesting findings have to be explored further in larger studies to evaluate the clinical impact.
In conclusion, endogenous and exogenous insulin showed higher variation during continuous hyperglycemia compared with near-normal glycemic levels. Significantly lower levels of exogenous insulin were observed following CSII during continuous hyperglycemia compared with transient hyperglycemia. Levels of endogenous insulin could in a complex way be explained by an individual interaction with p-glucose and serum exogenous insulin.
Footnotes
Acknowledgments
We kindly thank Inge Yde Frederiksen from Bayer for providing glucose strips for p-glucose measurements. Laboratory technician Kirsten Nyborg Rasmussen from the Medical Research Laboratory at the Department of Endocrinology and Internal Medicine, Aarhus University Hospital is acknowledged for endogenous insulin analyses. Senior scientist Susanne Boysen and laboratory technician Marianne Heelsberg Giese from the Novo Nordisk Research Laboratory (Måløv, Copenhagen) are acknowledged for s-IAsp analyses.
Author Disclosure Statement
T. Lauritzen has received unrestricted grants for the ADDITION study (screening and intensive treatment of type 2 diabetes in primary care) from public foundations and companies in the medical industry: Novo Nordisk AS, Novo Nordisk Scandinavia AB, ASTRA Denmark, Pfizer Denmark, GlaxoSmithKline Pharma Denmark, SERVIER Denmark A/S, and HemoCue Denmark A/S. T. Lauritzen holds shares in Novo Nordisk. J.S.C. has received lecture and consultant fees and is the recipient of unrestricted research grants from Novo Nordisk. J.J., T.P., N.H.B., and T. Laursen declare no competing financial interests exist.