
Abstract
Background:
The goal of the present study was to explore the correlations of 1,5-anhydroglucitol (l,5-AG), glycated hemoglobin (HbA1c), and glycated albumin (GA) with insulin sensitivity and secretion.
Subjects and Methods:
In total, 302 patients with newly diagnosed type 2 diabetes mellitus (166 men, 136 women) were enrolled in this study. The homeostasis model assessment for insulin resistance (HOMA-IR) and homeostasis model assessment for β-cell function (HOMA-β) were calculated to determine the basal insulin sensitivity and secretion. The insulinogenic index (IGI) was used to evaluate early-phase insulin secretion. 1,5-AG and GA were assayed via the enzymatic method, and HbA1c was detected by high-pressure liquid chromatography.
Results:
Among all 302 subjects, the serum 1,5-AG level was 13.1±7.2 μg/mL, and the HbA1c and GA levels [median (interquartile range)] were 6.7% (6.2–7.3%) and 17.7% (16.0–19.5%), respectively. Increased 1,5-AG quartiles were accompanied by trends toward a decreased HOMA-IR and an increased HOMA-β and IGI (for all trends, P<0.001). 1,5-AG was negatively associated with HOMA-IR (r=−0.200, P<0.001) and positively associated with HOMA-β and IGI (r=0.210 and 0.413, respectively; both P<0.001). 1,5-AG was independently related to HOMA-IR and HOMA-β and exhibited an independent positive association with IGI (standardized β=0.242, P<0.001). Additionally, both HbA1c and GA were independently correlated with HOMA-IR and HOMA-β.
Conclusions:
1,5-AG is not only correlated with basal insulin sensitivity and secretion, but also closely associated with early-phase insulin secretion in Chinese patients with newly diagnosed type 2 diabetes mellitus.
Introduction
S
Studies about the associations of 1,5-AG, HbA1c, and GA with both insulin sensitivity and secretion have reported inconsistent results. Some researchers have proposed that 1,5-AG and GA are superior to HbA1c as indicators of postprandial glycemic excursion. 7 –9 Therefore, it is reasonable to hypothesize that 1,5-AG and GA are more related to insulin secretion, whereas HbA1c is mainly involved in insulin resistance. 10 –12 Few studies to date have compared 1,5-AG, HbA1c, and GA in terms of their correlations with pancreatic β-cell function. In particular, the relationship between 1,5-AG and pancreatic β-cell function has not been reported among the Chinese population up to now. Therefore, the purpose of the present study was to explore the associations of 1,5-AG, HbA1c, and GA with both insulin sensitivity and secretion among Chinese patients with newly diagnosed type 2 diabetes mellitus (T2DM) and no history of previous hypoglycemic treatment.
Subjects and Methods
Subjects
The study population comprised 302 Chinese patients with newly diagnosed T2DM, including 166 men and 136 women (age range, 27–79 years; mean, 55.40±11.21 years), who visited the clinic of the Department of Endocrinology and Metabolism of Shanghai Jiao Tong University Affiliated Sixth People's Hospital from January 2012 to January 2014. Each study participant underwent an oral glucose tolerance test (OGTT). Well-trained investigators conducted a questionnaire survey using uniformly designed forms. The study population was restricted to those without a history of diabetes, diet control, current use of hypoglycemic agents, thyroid dysfunction, kidney disease, liver cirrhosis, tumors, mental disorders, pregnancy, or glucocorticoid therapy. T2DM was defined according to the 1999 World Health Organization criteria. 13
This study was approved by the Ethics Committee of Shanghai Jiao Tong University Affiliated Sixth People's Hospital, Shanghai, China. Informed consents were provided by all participants prior to enrollment.
Anthropometry and biochemical measurements
Each patient's blood pressure, height, and weight were measured. The body mass index (BMI) was calculated as weight/height2 (kg/m2).
After the patients had fasted for 10 h overnight, blood samples were collected to measure the fasting plasma glucose (FPG), 1,5-AG, HbA1c, GA, and fasting insulin (FINS) levels as well as the lipid profiles. An OGTT was administered to each subject to assay the 0.5-h postprandial plasma glucose (0.5hPG), 2-h postprandial plasma glucose (2hPG), 0.5-h postprandial insulin (0.5hINS), and 2-h postprandial insulin (2hINS). The plasma glucose level was immediately obtained by the glucose oxidase method (Kehua Biological Engineering Co., Ltd., Shanghai) using the Glamour 2000 biochemical autoanalyzer. HbA1c was detected by high-pressure liquid chromatography (Variant™ II hemoglobin analyzer; Bio-Rad, Hercules, CA) with inter- and intra-assay coefficients of variation (CVs) of <3.40% and <2.60%, respectively. GA was assessed using a liquid enzymatic method (Lucica GA-L; Asahi Kasei Pharma Corp., Tokyo, Japan) on a Glamour 2000 biochemical autoanalyzer with inter- and intra-assay CVs of <5.10% and <3.00%, respectively. 1,5-AG was measured by an enzymatic method (GlycoMark; GlycoMark Inc., New York, NY) on a 7600-120 autoanalyzer (Hitachi, Tokyo) with inter- and intra-assay CVs of <2.19% and <1.54%, respectively. The total cholesterol (TC), triglyceride (TG), high-density lipoprotein cholesterol (HDL-c), and low-density lipoprotein cholesterol (LDL-c) levels were determined by enzymatic methods on the Hitachi 7600-120 autoanalyzer. Electrochemiluminescence immunoassay was used to quantify the serum insulin level on a Cobas e 411 analyzer (Roche Diagnostics GmbH, Mannheim, Germany) with inter- and intra-assay CVs of 2.50% and 1.70%, respectively.
Indices of insulin sensitivity and secretion
The homeostasis model assessment for insulin resistance (HOMA-IR) was calculated as follows: HOMA-IR=FINS (in mU/L)×FPG (in mmol/L)/22.5. 14 The homeostasis model assessment for β-cell function (HOMA-β) was calculated as follows: HOMA-β=20×FINS [in mU/L]/(FPG [in mmol/L] – 3.5). 14 The insulinogenic index (IGI) was used to evaluate the early-phase insulin secretion as follows: IGI=(0.5hINS [in mU/L] – FINS)/(0.5hPG [in mmol/L] – FPG). 15
Statistical analysis
All statistical analyses were performed using Statistical Package for the Social Sciences, version 16.0 software (SPSS Inc., Chicago, IL). With the normality test, all variables were divided into normally distributed data, which were presented as mean±SD, and skewed data, which were presented as median with interquartile range. One-way analysis of variance was used to perform the trend analyses. Correlation analysis was performed to explore the associations of different glycemic indicators with both insulin sensitivity and secretion. Multiple stepwise regression analysis was conducted to identify the independent factors influencing 1,5-AG, HbA1c, and GA. A two-tailed P value of <0.05 was considered to be statistically significant.
Results
Clinical characteristics of the study participants
In total, 302 subjects were enrolled in the present study. The serum 1,5-AG level was 13.1±7.2 μg/mL, and the median (interquartile range) HbA1c and GA levels were 6.7% (6.2–7.3%) and 17.7% (16.0–19.5%), respectively.
After stratification by quartiles of the 1,5-AG level (Table 1), an increased 1,5-AG level was associated with rising trends in age, systolic blood pressure, HDL-c, 0.5hINS, and 2hINS (for all trends, P<0.05). Conversely, the BMI, glycemic levels (FPG, 0.5hPG, and 2hPG), HbA1c, and GA exhibited downward trends (for all trends, P<0.05).
Data were expressed as mean±SD for normal distribution variables or as the median (interquartile range) for skewed distribution variables.
0.5hINS, 0.5-h postprandial insulin; 0.5hPG, 0.5-h postprandial plasma glucose; 2hINS, 2-h postprandial insulin; 2hPG, 2-h postprandial glucose; 1,5-AG, 1,5-anhydroglucitol; BMI, body mass index; FINS, fasting insulin; FPG, fasting plasma glucose; GA, glycated albumin; HbA1c, glycated hemoglobin; HDL-c, high-density lipoprotein cholesterol; LDL-c, low-density lipoprotein cholesterol; TC, total cholesterol; TG, triglyceride.
Associations of 1,5-AG, HbA1c, and GA with insulin sensitivity and secretion
Figure 1 showed that a higher 1,5-AG level was accompanied by a decreasing trend in the HOMA-IR (Fig. 1A) and increasing trends in the HOMA-β (Fig. 1B) and IGI (Fig. 1C) across the quartiles of the 1,5-AG level (for all trends, P<0.001). When the subjects were stratified according to quartiles of the HbA1c, the trends analyses showed a upward trend for the HOMA-IR and downward trends for both the HOMA-β and IGI with increasing HbA1c quartiles (for all trends, P<0.001). However, we assigned subjects to quartiles of GA only to find decreasing trends in the insulin secretory indices (HOMA-β and IGI) (both P<0.001).
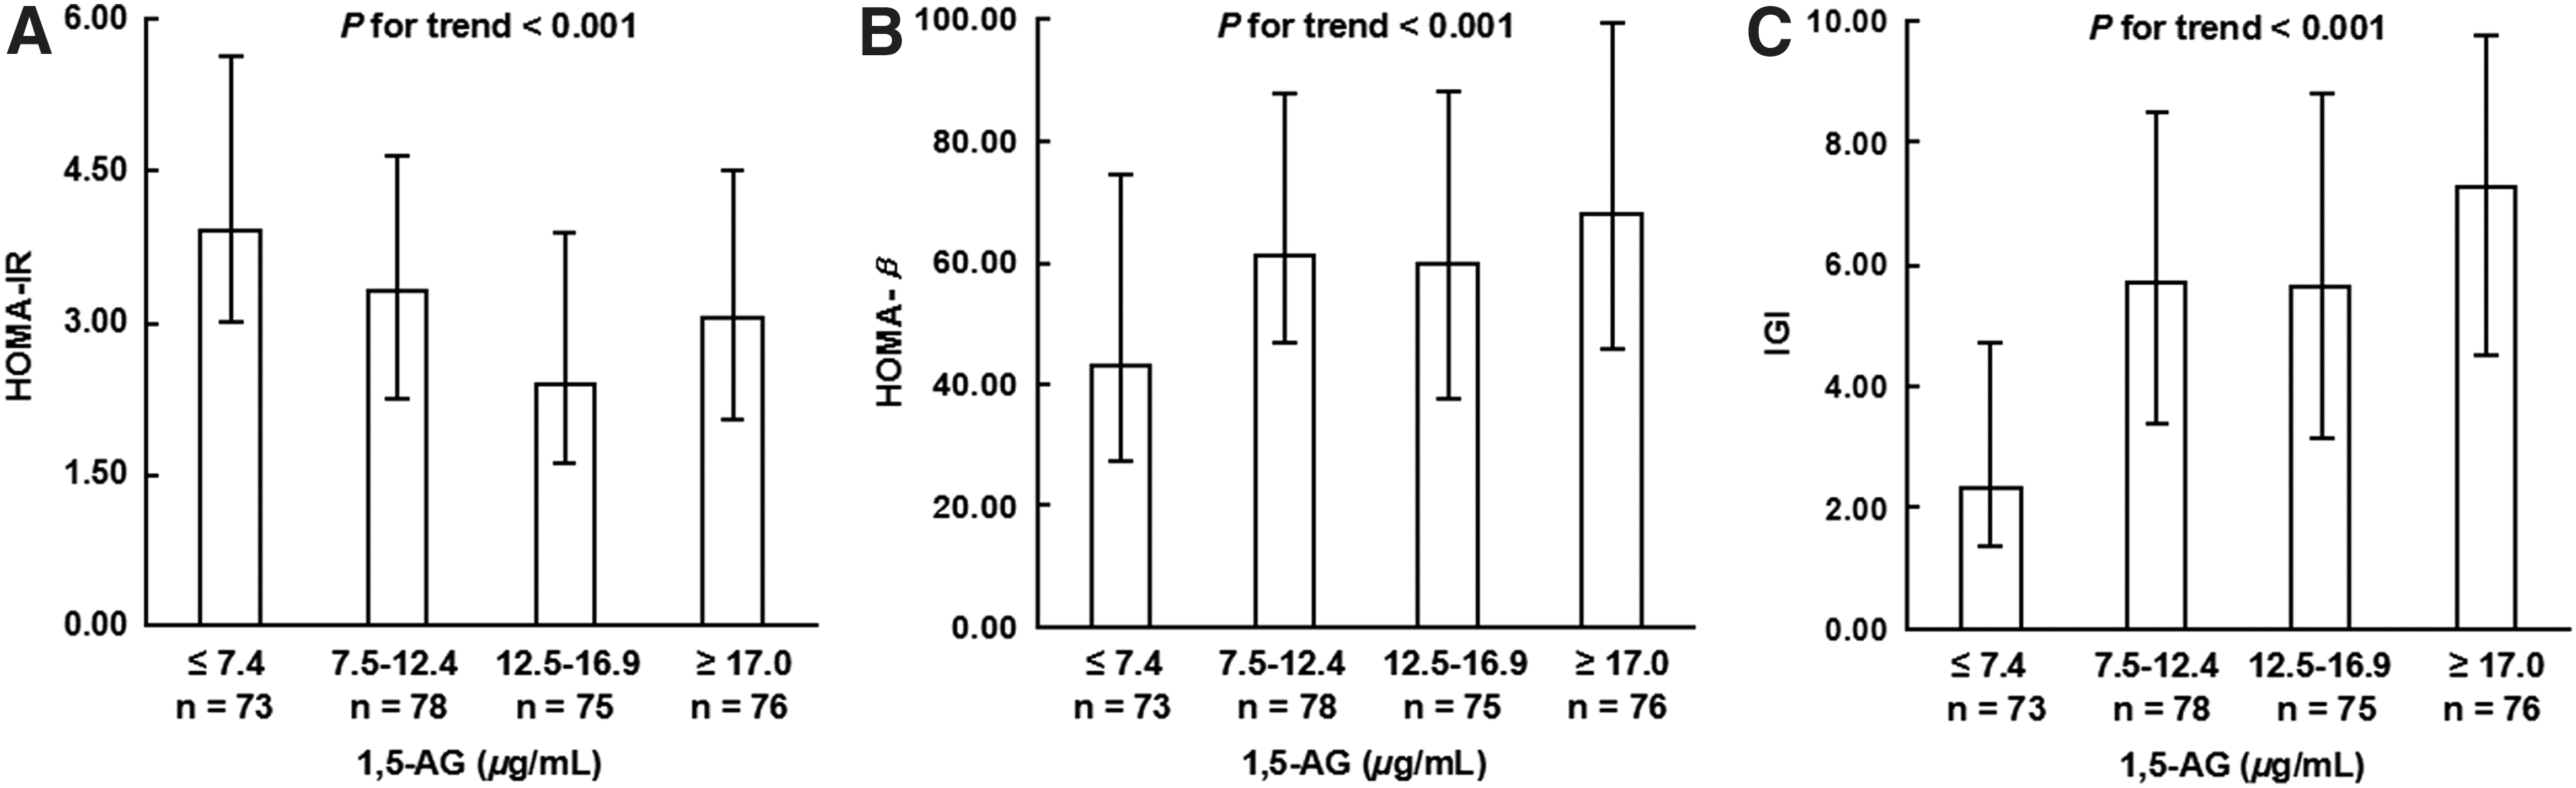
Associations of 1,5-anhydroglucitol (1,5-AG) quartiles with
Correlation analysis to determine the associations of 1,5-AG, HbA1c, and GA with insulin sensitivity and secretion
Spearman correlation analysis (Fig. 2) revealed that 1,5-AG was negatively associated with HOMA-IR (r=−0.200, P<0.001) and positively associated with HOMA-β and IGI (r=0.210 and 0.413, respectively; both P<0.001). These associations were still present after adjustment for gender, age, and BMI. Additionally, after adjustment for gender, age, and BMI, both HbA1c and GA showed inverse correlations with HOMA-β and IGI (all P<0.001). Finally, HbA1c also exhibited a positive correlation with HOMA-IR (P=0.010).
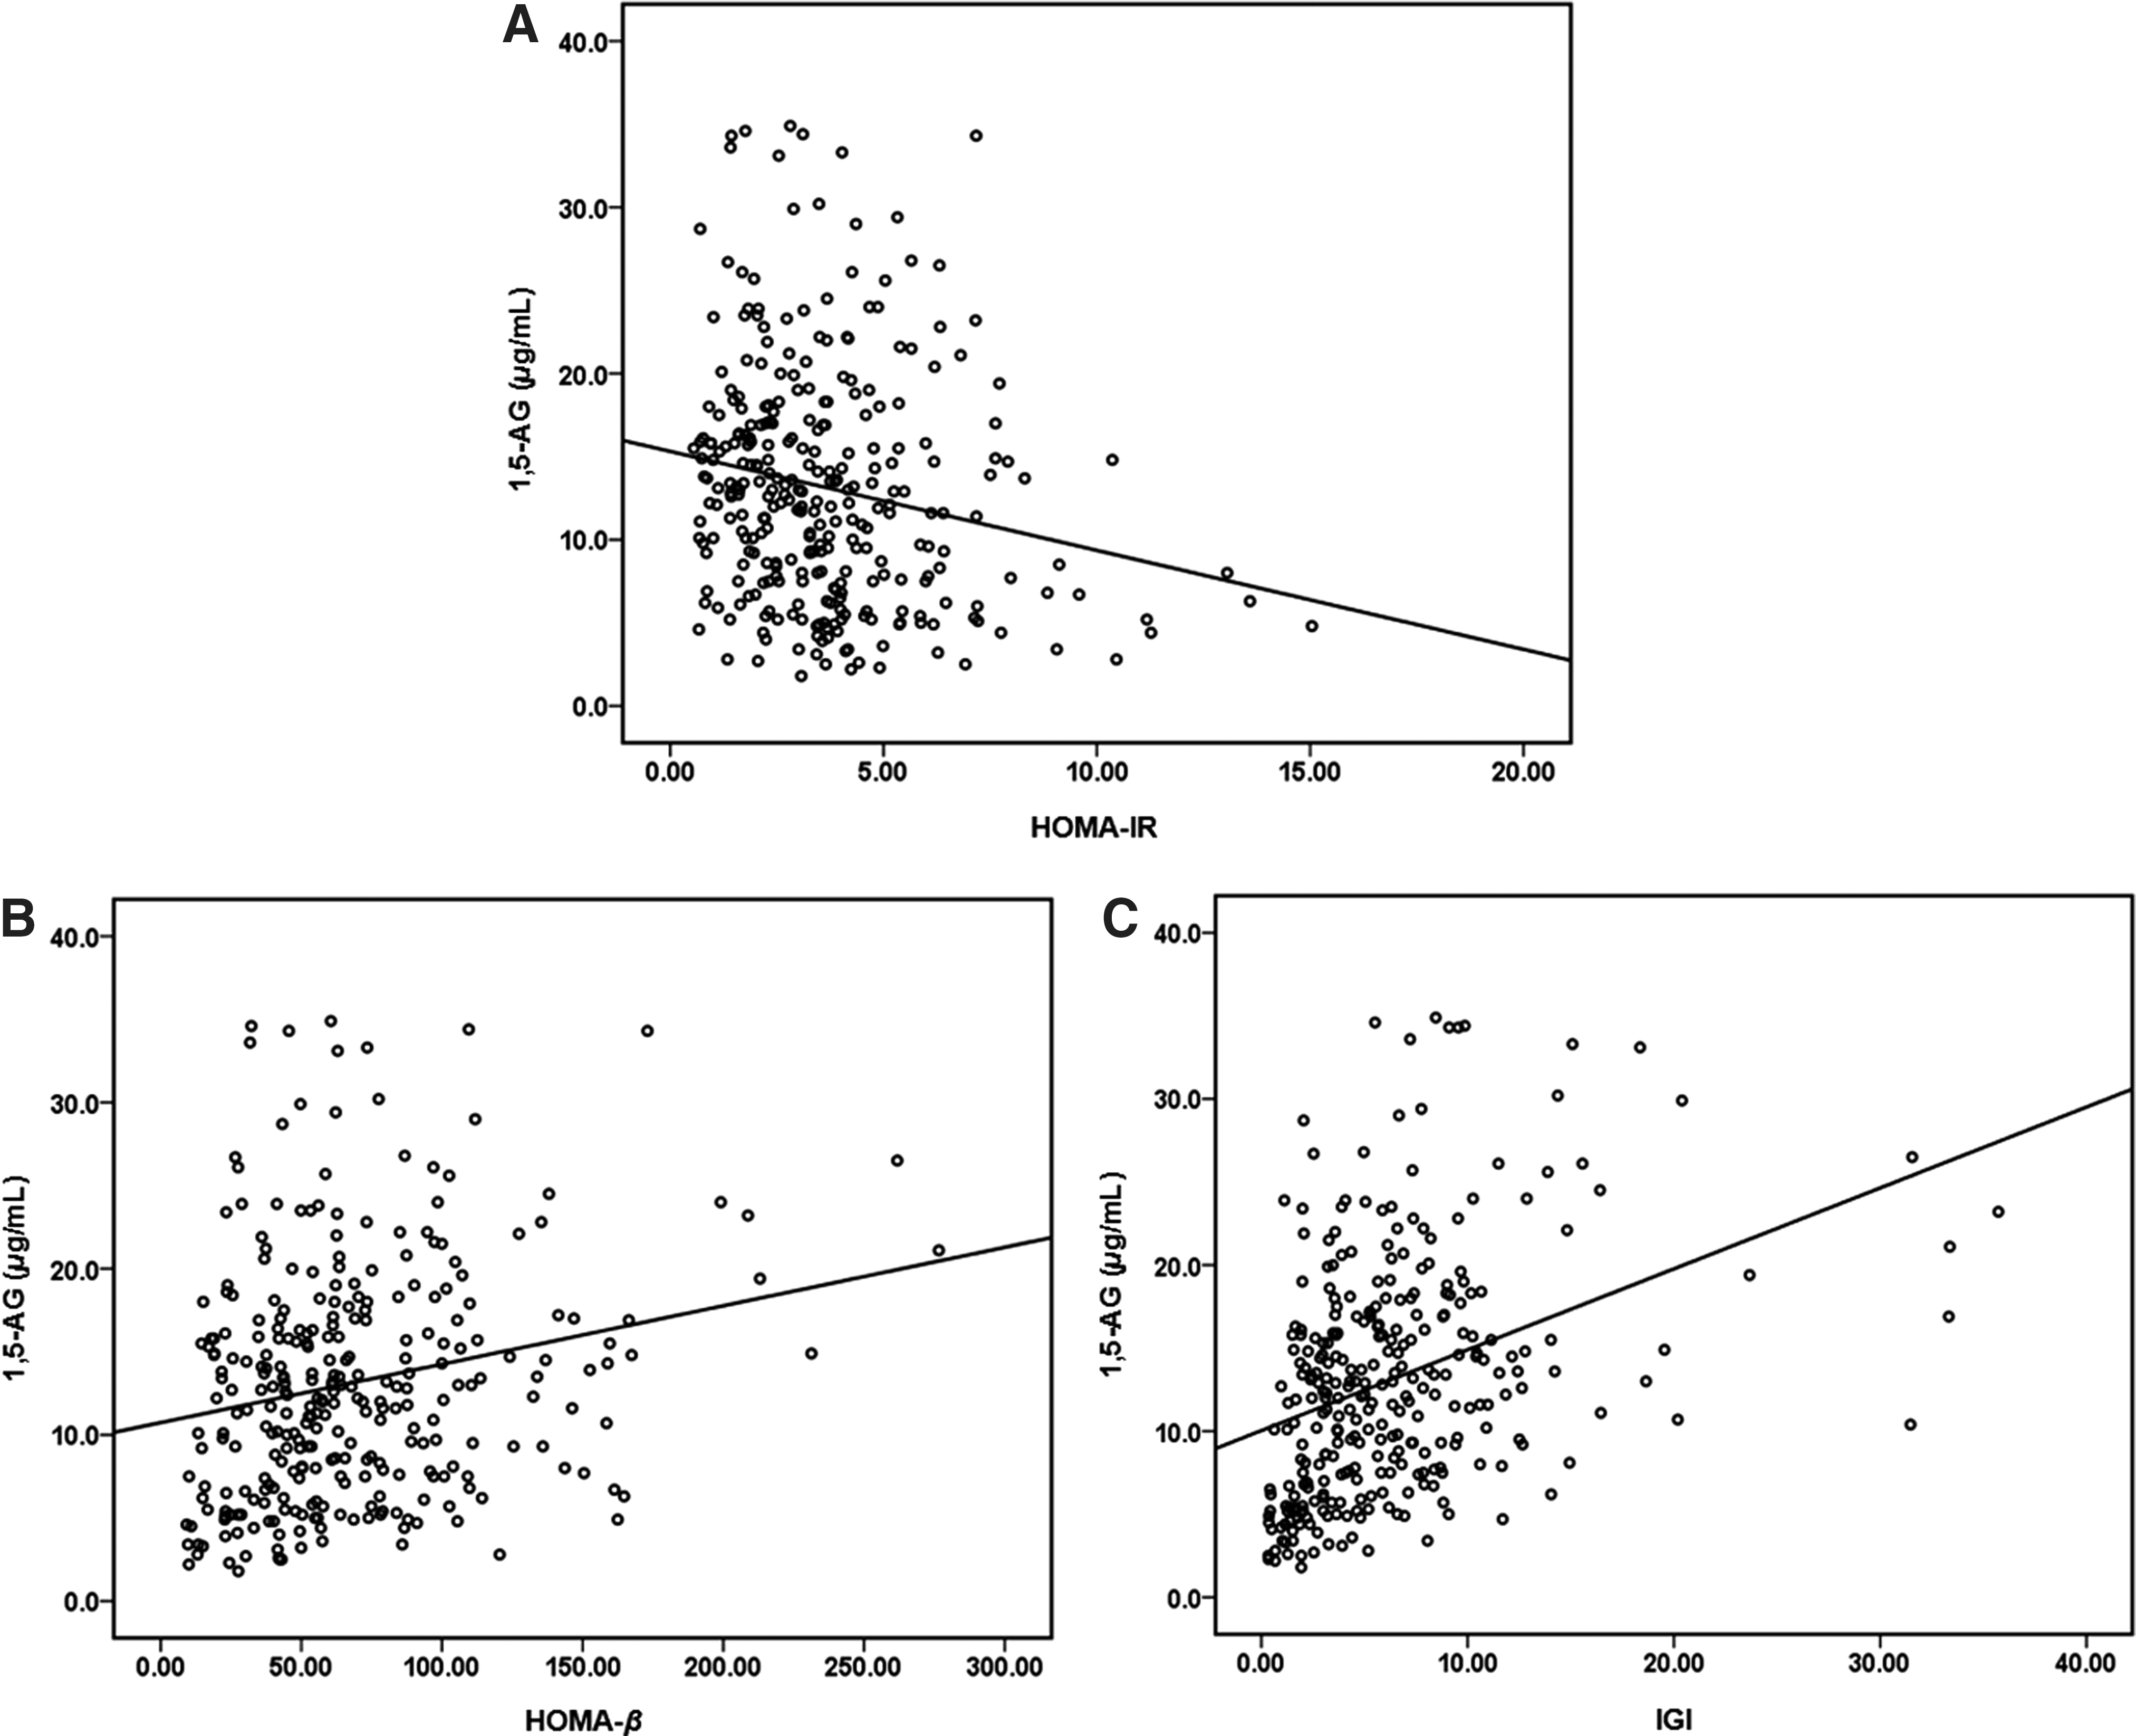
Correlations between 1,5-anhydroglucitol (1,5-AG) and
Multiple stepwise regression analysis of 1,5-AG, HbA1c, and GA
Multiple stepwise regression analysis using 1,5-AG as a dependent variable (Table 2) showed that 1,5-AG was independently related to IGI, HOMA-IR, HOMA-β, and age (standardized β=0.242, −0.349, 0.232, and 0.256, respectively; all P<0.01) after adjustment for gender, age, BMI, systolic blood pressure, diastolic blood pressure, lipid profiles (TC, TG, HDL-c, and LDL-c), HOMA-IR, HOMA-β, and IGI. Moreover, when HbA1c and GA were defined as dependent variables in the multiple regression analysis separately, only the independent correlations of HOMA-IR (standardized β=0.525 and 0.407, respectively) and HOMA-β (standardized β=−0.673 and −0.595, respectively) with HbA1c and GA remained (all P<0.001).
Independent variables included gender, age, body mass index, systolic blood pressure, diastolic blood pressure, lipid profiles (total cholesterol, triglyceride, high-density lipoprotein cholesterol, and low-density lipoprotein cholesterol), homeostasis model assessment for insulin resistance (HOMA-IR), homeostasis model assessment for β-cell function (HOMA-β), and insulinogenic index (IGI).
Discussion
Insulin secretion deficiency and insulin resistance are involved in both the onset and progression of diabetes mellitus. 16,17 The IGI reflects early-phase insulin secretion, which comprises the first phase and part of the second phase of insulin release. The IGI is also a sensitive indicator of impaired β-cell function. Therefore, HOMA-IR, HOMA-β, and IGI were selected as indices to evaluate insulin sensitivity and secretion in patients with newly diagnosed T2DM in the present study.
Our study for the first time dissected the associations of 1,5-AG with insulin sensitivity and secretion in Chinese patients with newly diagnosed T2DM. Our results showed that 1,5-AG exhibited an independent association with not only HOMA-IR and HOMA-β, but also IGI. These findings suggested that beyond its relationship with basal insulin secretion and sensitivity, 1,5-AG was also closely related to early-phase insulin secretion. Moreover, in line with the results of previous studies, the present study demonstrated independent correlations of HbA1c and GA with HOMA-IR and HOMA-β.
1,5-AG, the C1 deoxy form of glucofuranose, reflects the average glycemic level over the previous 1–2 weeks. Because of its higher sensitivity, 1,5-AG takes priority over HbA1c as a marker of postprandial hyperglycemia when the glucose level exceeds the renal glucose threshold. 18 A Japanese study proposed 1,5-AG as a predictor of the 2hPG after the 75-g OGTT. 19 This consideration was supported by the result of a Chinese study, which found that 1,5-AG was a better indicator of postprandial hyperglycemia. 20 The present study also revealed a stronger correlation of 1,5-AG with 2hPG than that with FPG (r=−0.425 and −0.399, respectively; both P<0.001).
So far fewer studies have been performed on the associations of 1,5-AG with insulin sensitivity and secretion. One study involving 306 Korean subjects with an HbA1c of <7% showed that subjects with a lower 1,5-AG level had significantly decreased insulin sensitivity and secretion. Moreover, higher IGI was accompanied by an increasing serum 1,5-AG level in patients with prediabetes or diabetes. 10 The present study showed that 1,5-AG was closely associated with early-phase insulin secretion in addition to HOMA-IR and HOMA-β, which explained why 1,5-AG was a better glycemic marker of postprandial glycemic excursion to some extent.
The mechanisms underlying the association of 1,5-AG with pancreatic β-cell function remained unclear. A cell study confirmed that 1,5-AG stimulated insulin secretion in insulinoma cell lines (RINr and MIN6 cells); these results showed that 1,5-AG played some part in regulation of glucose-mediated insulin secretion. 21 Another study found that 1,5-AG inhibited lipopolysaccharide-stimulated inflammatory cytokine, 22 which further improved pancreatic β-cell function.
As the gold standard for glycemic control, HbA1c was reportedly more closely related to HOMA-IR in previous studies. Nevertheless, two studies recently found that HbA1c was associated with both insulin sensitivity and secretion. Kanat et al. 23 conducted a study involving 522 Mexican American subjects and found that an HbA1c of 6% was associated with a 44% and 62% decrease in insulin sensitivity and β-cell function, respectively. Another study involving 335 patients with gestational diabetes mellitus revealed that HOMA-IR was the strongest factor affecting the HbA1c level, which, additionally, was also associated with insulin secretory function. 24 Furthermore, subjects with an insulin peak that was delayed to 180 min were more likely to have a higher HbA1c compared with those with an insulin peak at 60 or 120 min. 24 In agreement with the results of the studies noted above, the findings of the present study also supported links between HbA1c and both insulin sensitivity and secretion among patients with newly diagnosed T2DM.
GA is purportedly more sensitive than HbA1c in reflecting glycemic excursion. The research abroad made a comparison between patients with type 1 diabetes mellitus and T2DM, both of whom had similar HbA1c levels, and found that patients with type 1 diabetes mellitus exhibited a significantly higher GA level. 8 The prominent glucose fluctuation resulting from insulin secretion deficiency in patients with type 1 diabetes mellitus might have contributed to this difference. A Korean study involving 758 patients with T2DM found that although associated with both HOMA-β and IGI, GA had no relationship with HOMA-IR. 25 Meanwhile, a study from Japan found that HOMA-β, but not HOMA-IR, was independently correlated with GA. 11 In the present study, the correlation between GA and HOMA-β was more pronounced than the correlation between GA and HOMA-IR. With focus on the mechanism, Song et al. 26 uncovered the result that GA gave rise to pancreatic β-cell death by suppressing autophagy induction and flux, leading to nuclear factor-κB(p65)-inducible nitric oxide synthase–caspase-3 cascade activation, as well as by increasing susceptibility to both endoplasmic reticulum stress and oxidative stress. In addition, there existed evidence in a cell study that pretreating L6 skeletal muscle cells with GA resulted in insulin resistance. 27 Finally, an animal study confirmed the occurrence of GA-induced inhibition of glucose-induced insulin secretion from Wistar rat pancreatic β-cells. 28
There are some limitations of this study. Although the post-OGTT glucose and insulin levels were used to determine the insulin sensitivity and secretion, the results require further verification using the glycemic clamp test as the gold standard. Additionally, because this study was limited by the small sample size and cross-sectional design, further larger population-based studies are necessary to fully investigate the relationship between 1,5-AG and early-phase insulin secretion.
In conclusion, this study demonstrated a significant association of lower insulin sensitivity and impaired insulin secretory function with a decreasing 1,5-AG level, as well as increasing GA and HbA1c levels in Chinese patients with newly diagnosed T2DM. Additionally, 1,5-AG was closely associated with early-phase insulin secretion. Our results suggest restoration and rebuilding of the early phase of insulin secretion, which play a critical role in blood glucose control and reduction in oxidative stress, could further benefit the prevention and treatment of diabetes.
Footnotes
Acknowledgments
This work was funded by the 973 Program of China (grant 2013CB530606), the Project of National Natural Science Foundation of China (grants 81100563 and 81100590), the Shanghai Medical Program for Outstanding Young Talent (grant XYQ2011013), the Key Project of Science and Technology of Shanghai (grant 13XD1403000), and a grant from the Shanghai Health and Family Planning Commission (grant 2013ZYJB1001).
Author Disclosure Statement
No competing financial interests exist.
J.Z. and W.J. designed the study. Y.H., X.H., Y.L., and Z.D. collected data. X.M. analyzed data and wrote the draft. Y.B. provided technical support. J.Z., Y.B., and W.J. revised the article and contributed to the discussion. All authors read and approved the final manuscript.