
Abstract
Background:
This study analyzed the overall nocturnal performance during home use of a long-term subcutaneous implantable continuous glucose monitoring (CGM) sensor.
Subjects and Methods:
In this study, 12 subjects with type 1 diabetes mellitus (T1DM) (mean±SD age, 37±8 years; mean±SD disease duration, 11±6 years) were implanted with an investigational continuous glucose sensor in the upper arm for up to 90 days. All subjects received full access to real-time glucose display and user programmable hypo- and hyperglycemic alarms. Subjects calibrated the sensors with a self-monitoring of blood glucose (SMBG) meter and continued to rely on their regular SMBG measurements for their diabetes management. Accuracy of the sensors during the home-use study was calculated using SMBG as the reference. The nocturnal sensor attenuation (NSA) concept was tested. Sensitivity and specificity of the nocturnal hypoglycemic alarm were calculated.
Results:
Mean±SD glucose sensor life span was 87±7 days. The mean±SE absolute relative difference over the range of 40–400 mg/dL for the sensors in this home-use study was 12.3±0.7% using SMBG as the reference. The hypoglycemia alarms were set to be triggered when the glucose level went below 70 mg/dL. Percentage of nights with hypoglycemic alarms triggered for at least 10 min was 13.6%. Recovery into euglycemia within 30 min from the timestamp of the immediate confirmatory SMBG testing was obtained in 74% of all episodes (n=20). The implanted continuous glucose sensor showed a hypoglycemia detection sensitivity and specificity of 77% and 96%, respectively. The NSA-associated high negative rate of change of at least −4 mg/dL/min was not encountered during night use of the system.
Conclusions:
This home-use study of a fully implantable, long-term continuous glucose sensor shows excellent performance in nocturnal hypoglycemia detection in T1DM patients. The apparent lack of NSA affecting the implanted sensor and the high specificity of the hypoglycemic alarm expedite the recovery from nighttime hypoglycemia.
Introduction
C
However, there are limitations to transcutaneous real-time CGM systems. Due to individuals lying on top of their sensor, nocturnal sensor attenuation (NSA) is a common problem for transcutaneous CGM system, limiting their accuracy and sensitivity in reporting hypoglycemic episodes during the night. 7 The pattern of NSA is that the signals tend to attenuate for about 15–30 min, as a result of temporarily increased local pressure, while the patient is asleep. There is a significant initial decrease in signal level, with a consequent negative rate of change in measured glucose level that is clearly beyond the physiological limits, followed by a sudden return to near “pre-attenuation” values as local pressure subsides. 7 This phenomenon interferes with the CGM system ability to correctly sense a nocturnal hypoglycemic event. Bequette 7 reported that NSA could cause frequent pump shutoffs and that an algorithm needs to be applied to detect invalid readings based on estimated glucose and rate of change.
Although Baysal et al. 8 reported in a recent study that their pressure-induced sensor attenuation (PISA) detection algorithm can detect about 88% of the PISAs, a CGM system that is not susceptible to NSA and PISA will not need an algorithm to detect PISA or cause pump shutoffs due to NSA or PISA. The aim of this study was to evaluate the 90-day home-use performance of a new, implantable, fluorescence-based continuous glucose sensor regarding nocturnal hypoglycemia detection, with a special emphasis on the NSA phenomenon.
Research Design and Methods
The Senseonics CGM system
The components of the investigational subcutaneous CGM system developed by Senseonics (Germantown, MD) are illustrated in Figure 1. It utilizes a fluorescence-based implantable glucose sensor powered by an on-body wearable smart transmitter, which wirelessly communicates with a smartphone application (app) (Fig. 1). The CGM system can prompt for alerts by both on-body vibration alarms via the wearable smart transmitter and audible alarms through the smartphone.

Components of the continuous glucose monitoring system. App, application; LE, low energy; LED, light-emitting diode. (Color graphics available at
The sensor is designed to allow for direct measurement of interstitial fluid glucose after subcutaneous implantation into the upper arm or abdomen. The implantable sensor is a microfluorometer essentially consisting of a fluorescent, boronic acid–based glucose-indicating polymer, coated onto a miniaturized optical detection system. The sensor optical and electrical components (Fig. 1) are encased in a rigid, translucent, and biocompatible encasement 3.3 mm in diameter and 15 mm in length. Glucose concentration is measured by means of fluorescence from the glucose-indicating hydrogel, which is polymerized onto the encasement surface over the optical system. The optical system inside the encasement is composed of a light-emitting diode, two spectrally filtered photodiodes, an integrated circuit with onboard temperature sensor, and an antenna. The light-emitting idode serves as the excitation source for the glucose indicator. The photodiodes measure fluorescence intensity. Glucose reversibly binds to the indicator boronic acid groups. Subsequent disruption of intramolecular photoinduced electron transfer quenching results in an increased fluorescence intensity upon glucose binding. Fluorescence increases as glucose concentrations increase. 9 This fluorescent signal is transduced using a wireless, passive, near-field communication-based interface circuit. 10
The body-worn transmitter is a rechargeable device that powers the sensor through an inductive link of 13.56 MHz. It is worn over the sensor via an adhesive patch or band and activates a measurement sequence every 2 min. The smart transmitter receives data from the sensor and calculates glucose concentration and trends, including current or impending low and high glucose levels. Twice-daily SMBG tests are entered in the smartphone app and are used by the smart transmitter to calibrate the system. Furthermore, the smart transmitter transmits via a Bluetooth® (Bluetooth SIG, Kirkland, WA) low-energy link the calculated information to the smartphone app for display. When an alarm condition (e.g., hypoglycemic alarm) exists, the smart transmitter vibrates via its vibration motor (Fig. 1), and the smartphone rings to alert the patient. The smart transmitter works for 2–4 days when worn continuously. It gets fully recharged via a USB charging cable in about 15 min.
More details of biosensor chemistry, sensor platform, and telemetry are described in the previous publications. 9 –11
The blood glucose meter used for calibration was the ACCU-CHEK® Aviva blood glucose meter (Roche Diagnostics GmbH, Mannheim, Germany). Calibration points were limited to glucose readings ≥40 mg/dL and ≤400 mg/dL during rates of glucose change less than 2.5 mg/dL/min. The daily calibration update requires two user-entered SMBG values separated by a minimum of 8 h.
The CGM system glucose algorithm that incorporates kinetic and temperature dependences has been previously published. 12 The previously reported accuracy against the laboratory reference (YSI analyzer; YSI, Yellow Springs, OH) in an in-clinic study, calculated as mean absolute relative difference (MARD), was 11.7±0.7%. 9 The time lags were calculated with these reported in-clinic data using the method for numerical evaluation of times lags reported by Kovatchev et al. 13 The blood-to-sensor time delays were calculated to be 7±4 min when YSI was used as the reference. A glucose-dependent lag time model is used in the algorithm to correct for differences between blood glucose and interstitial fluid concentrations. 14
Study design
The study was designed to provide at-home performance evaluation of the investigational CGM system. An institutional review board approved the protocol, and all study procedures were conducted in accordance with the principles of the Helsinki Declaration and current guidelines for Good Clinical Practice. Written informed consent was obtained from all subjects before study enrollment.
Twelve subjects with T1DM participated. Enrolled subjects ranged in age from 22 to 52 years (mean±SD age, 37±8 years) and included eight men and four women. All individuals had been diagnosed with T1DM for at least 1 year (mean±SD disease duration, 11±6 years), and body mass index ranged from 19.4 to 29.3 kg/m2 (mean±SD, 24.7±2.9 kg/m2). Baseline hemoglobin A1c ranged from 7.0% to 9.8% (mean±SD, 8.8±1.1%).
All subjects had their sensors inserted on Day 0 and removed on approximately Day 90. The results of sensor glucose measurements were interpreted by an embedded software running in the transmitter and then wirelessly forwarded to be viewed in the smartphone app. A hypoglycemic alarm was set to be triggered by the system when the glucose concentration went below 70 mg/dL. When the hypoglycemic alarm is triggered, the transmitter vibrates, and the smartphone rings to alert the subject.
In addition to the standard use of the Senseonics CGM system at night, there were also durations where pressure was applied to the sensing site to see if PISA could be induced. To implement this test, pressure was applied to the area above the implanted sensors for 30 min, and upon interviewing, the subjects felt the pressure was significant.
Data processing and analysis
For home-use alarm performance analysis, the subjects' self-monitoring of blood glucose (SMBG) meter and CGM system were downloaded while they were attending the regular clinic visits. For an analysis of home use (e.g., accuracy of the sensor, nocturnal sensitivity, and specificity performance), the CGM sensor's glucose and alarm time were paired with SMBG measurements that were taken as confirmation. The rate of change analysis pulled the rates of change in measured glucose level from the downloaded data. For the performance of nocturnal hypoglycemic alarms, the data were analyzed by combining the sensor glucose and alarm log as well as the accelerometer data. These two datasets were combined to find periods of time where the subject was resting, the hypoglycemia alarm was then triggered, activity levels then increased, and then an SMBG reading was taken. This sequence is illustrated in Figure 2.

Transients of the nocturnal glycemic profile, the system alarm triggers, and the activity measurements from the transmitter, as well as the confirmation self-monitoring of blood glucose (SMBG) measurement values. (Color graphics available at
Results
Home-use accuracy with SMBG reference
The accuracy was calculated using SMBG as the reference. The SMBG test values used for calibration were excluded in the accuracy calculation. Clarke error grid analysis 15 was used to assess the clinical accuracy of all trial data provided by CGM sensors. In total, 1,203 paired data points were obtained to evaluate sensor performance; 98.9% were within the combined Zones A+B, 1.1% of the data points were in the combined Zones C+D, and no points were in Zone E (Fig. 3). The overall MARD over the range of 40–400 mg/dL was found to be 12.3±0.7%. The accuracy for Days 1–30, 30–60, and 60–90 was also calculated and is shown in Table 1. As for comparison between home-use accuracy and in-clinic accuracy, another report on this system has focused on the in-clinic accuracy to a lab reference and found an overall MARD of 11.7±0.7%. 9
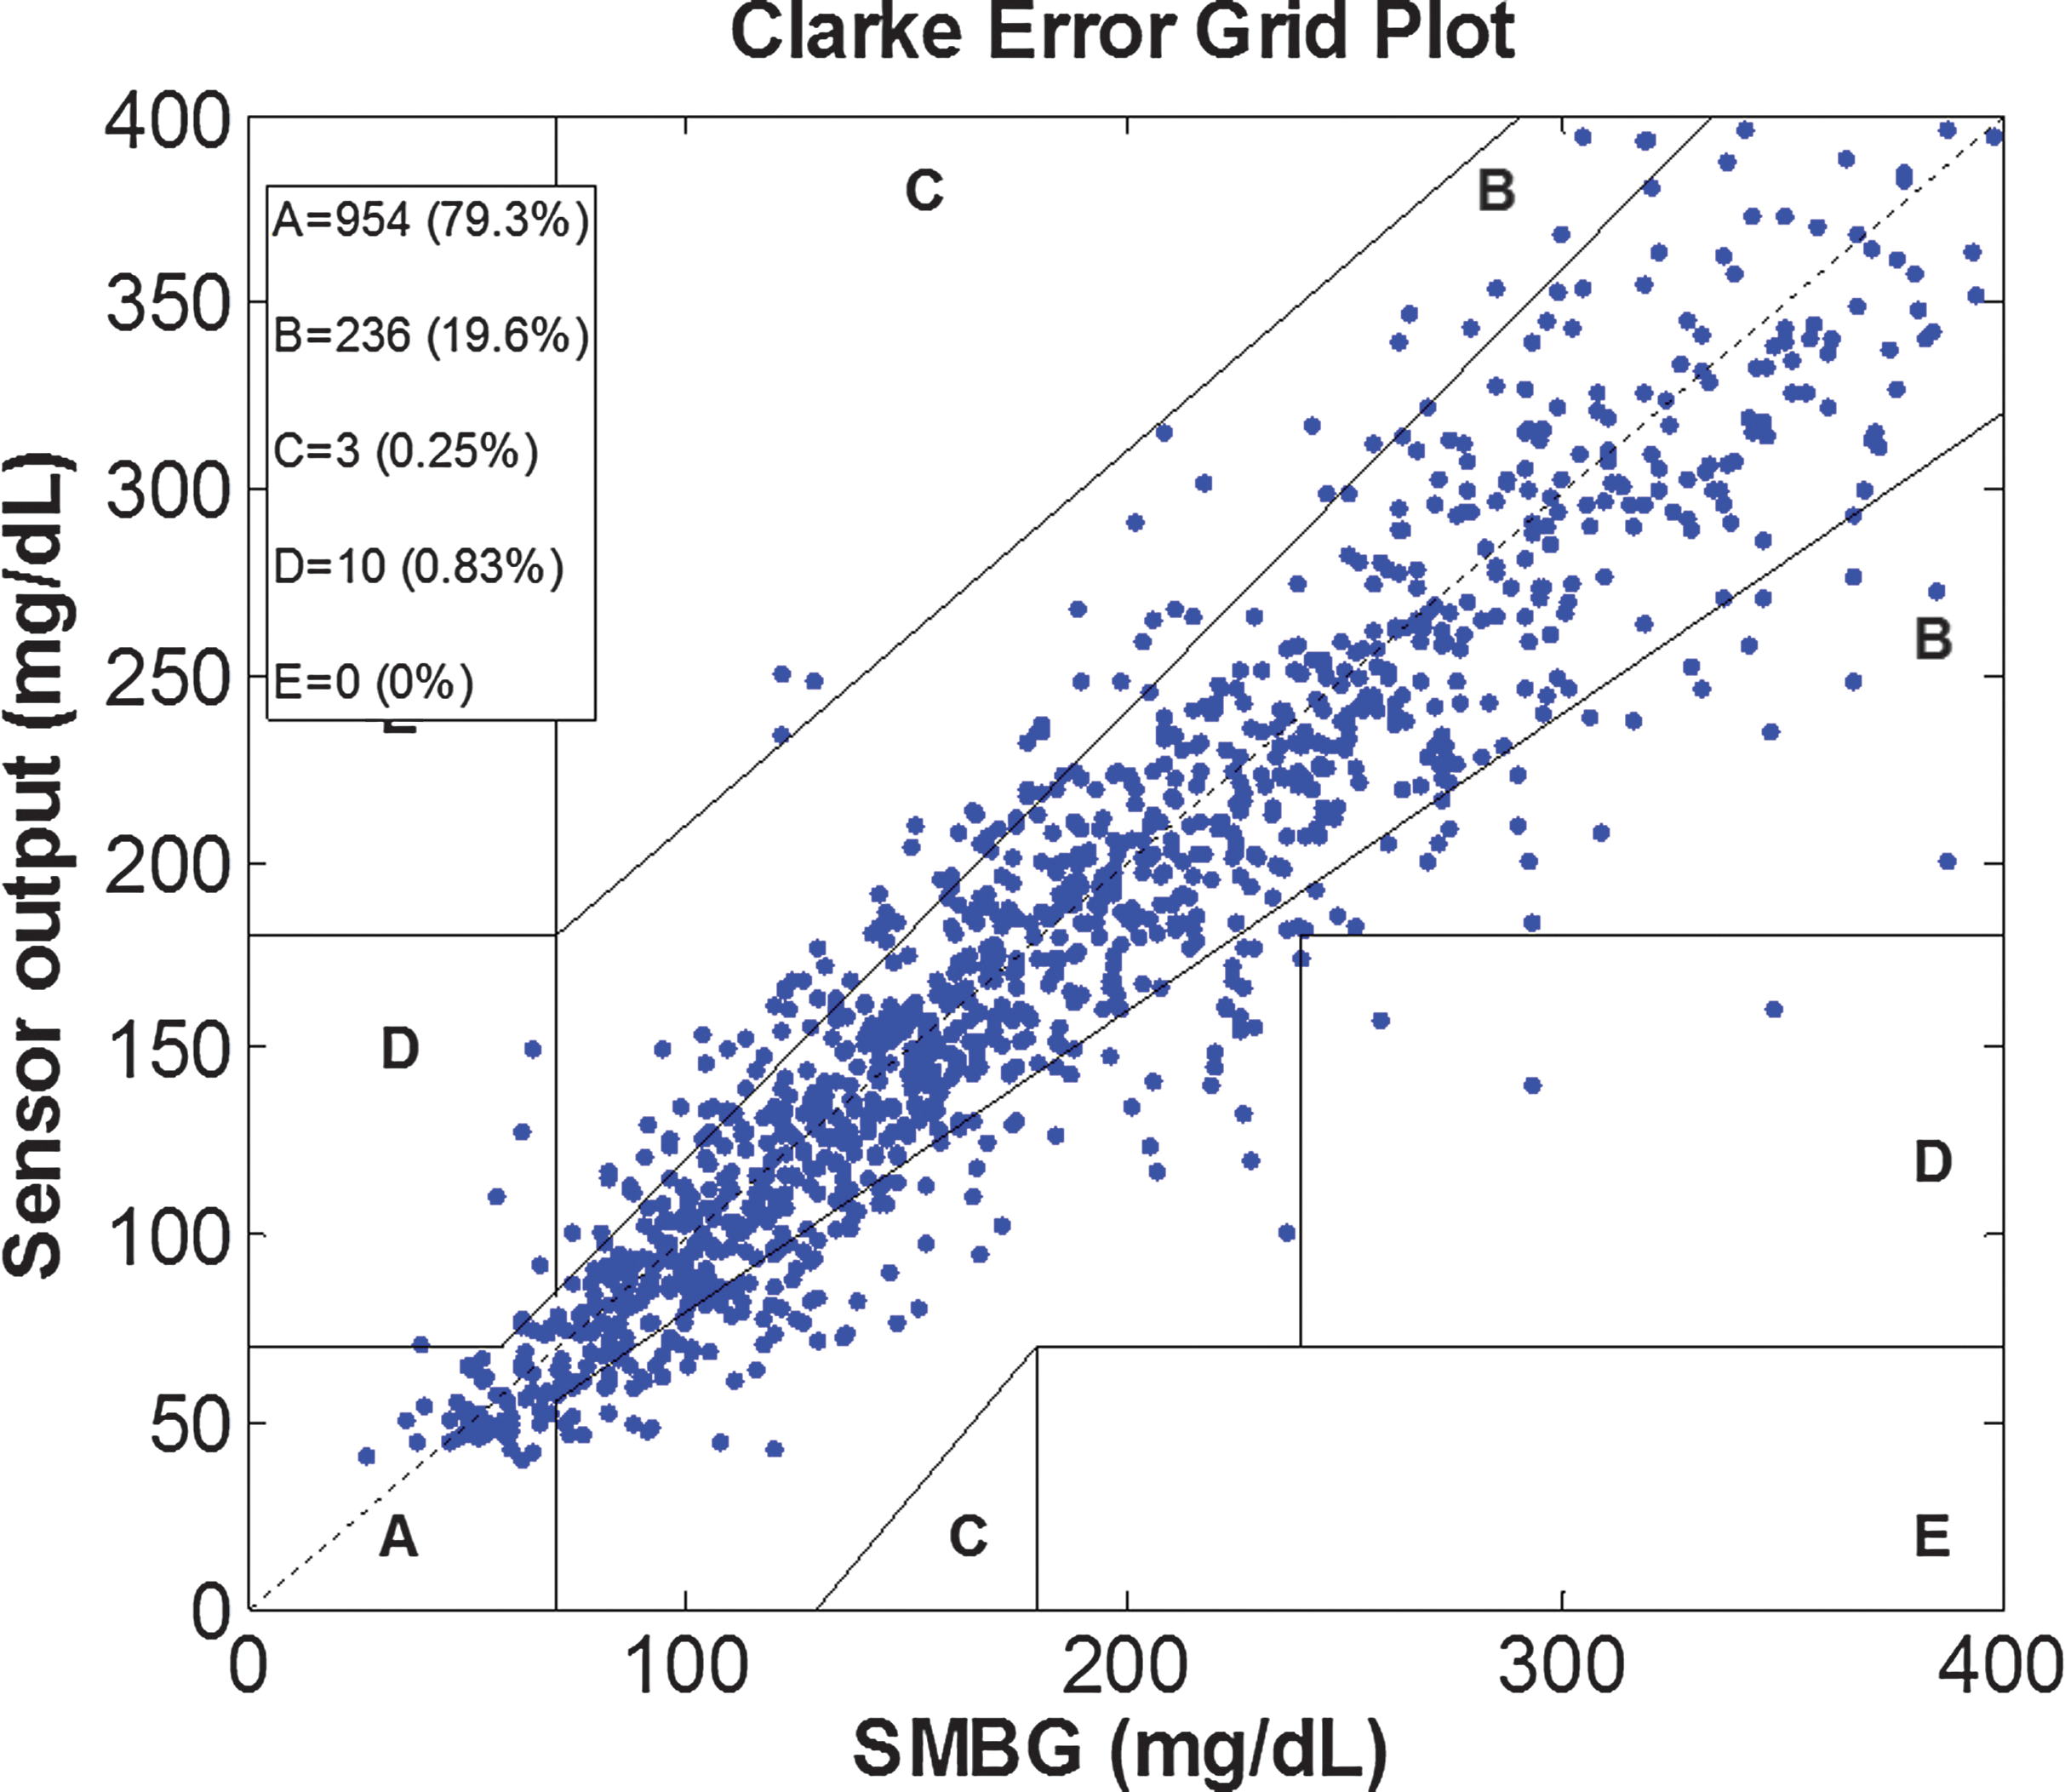
Clarke error grid analysis of all glucose measurements obtained during the home-use study. Zone A values are considered clinically accurate, Zone B are benign errors, Zone C is characterized as the potential for overcorrection, Zone D describes the potential for delayed treatment, and Zone E is clinical errors. SMBG, self-monitoring of blood glucose. (Color graphics available at
MARD, mean absolute relative difference.
Nocturnal rate of change analysis
The analysis of NSA built upon methodologies described by Bequette, 7 which define the start of a NSA as characterized by a sudden decrease in glucose levels that is beyond physiological limits on rate of change. The end of an NSA occurs at least 15 min later and has an increasingly negative rate of change. To investigate for this phenomenon in the dataset, an analysis was done of the rate of change of all the subjects between midnight and 6 a.m. The rate of change is calculated based on the algorithm described by Bequette 16 and the real-time glucose concentration displayed by the subjects.
The overall prevalence for glucose rate of change intervals between midnight and 6 a.m. is shown in Table 2. Over 94% of the rate of change lies within the range of −1 and 0.99 mg/dL/min, with another 4.3% within 1 and 1.99 mg/dL/min. No rate of change below −4 mg/dL/min was seen. There were no NSA episodes recorded throughout the study in any of the participating subjects. The rate of change during the pressure tests was also calculated, and no rate of change below −4 mg/dL/minute was seen. There was no PISA episode recorded.
Nocturnal hypoglycemic performance analysis
The accuracy of the CGM system to SMBG readings for the paired nighttime hypoglycemia confirmation measurements for the entire study was quantified with both mean absolute difference of 12.1±0.4 mg/dL and MARD of 15±0.7%. The reference mean blood glucose level was 59±15 mg/dL.
The chain of events described in Figure 2 is further exemplified for some hypoglycemic events experienced by one of the study subjects during the trial in Figure 4. An example of quantification of the hypoglycemic alarm is illustrated on Day 71; when the hypoglycemic alarm was triggered at 1:24 a.m., 8 min later, SMBG showed 52 mg/dL, then 18 minutes later the hypoglycemic alarm was cleared, and the subject's glycemia rose to be above 80 mg/dL. These data met the criteria for a confirmed detection of a hypoglycemic event.
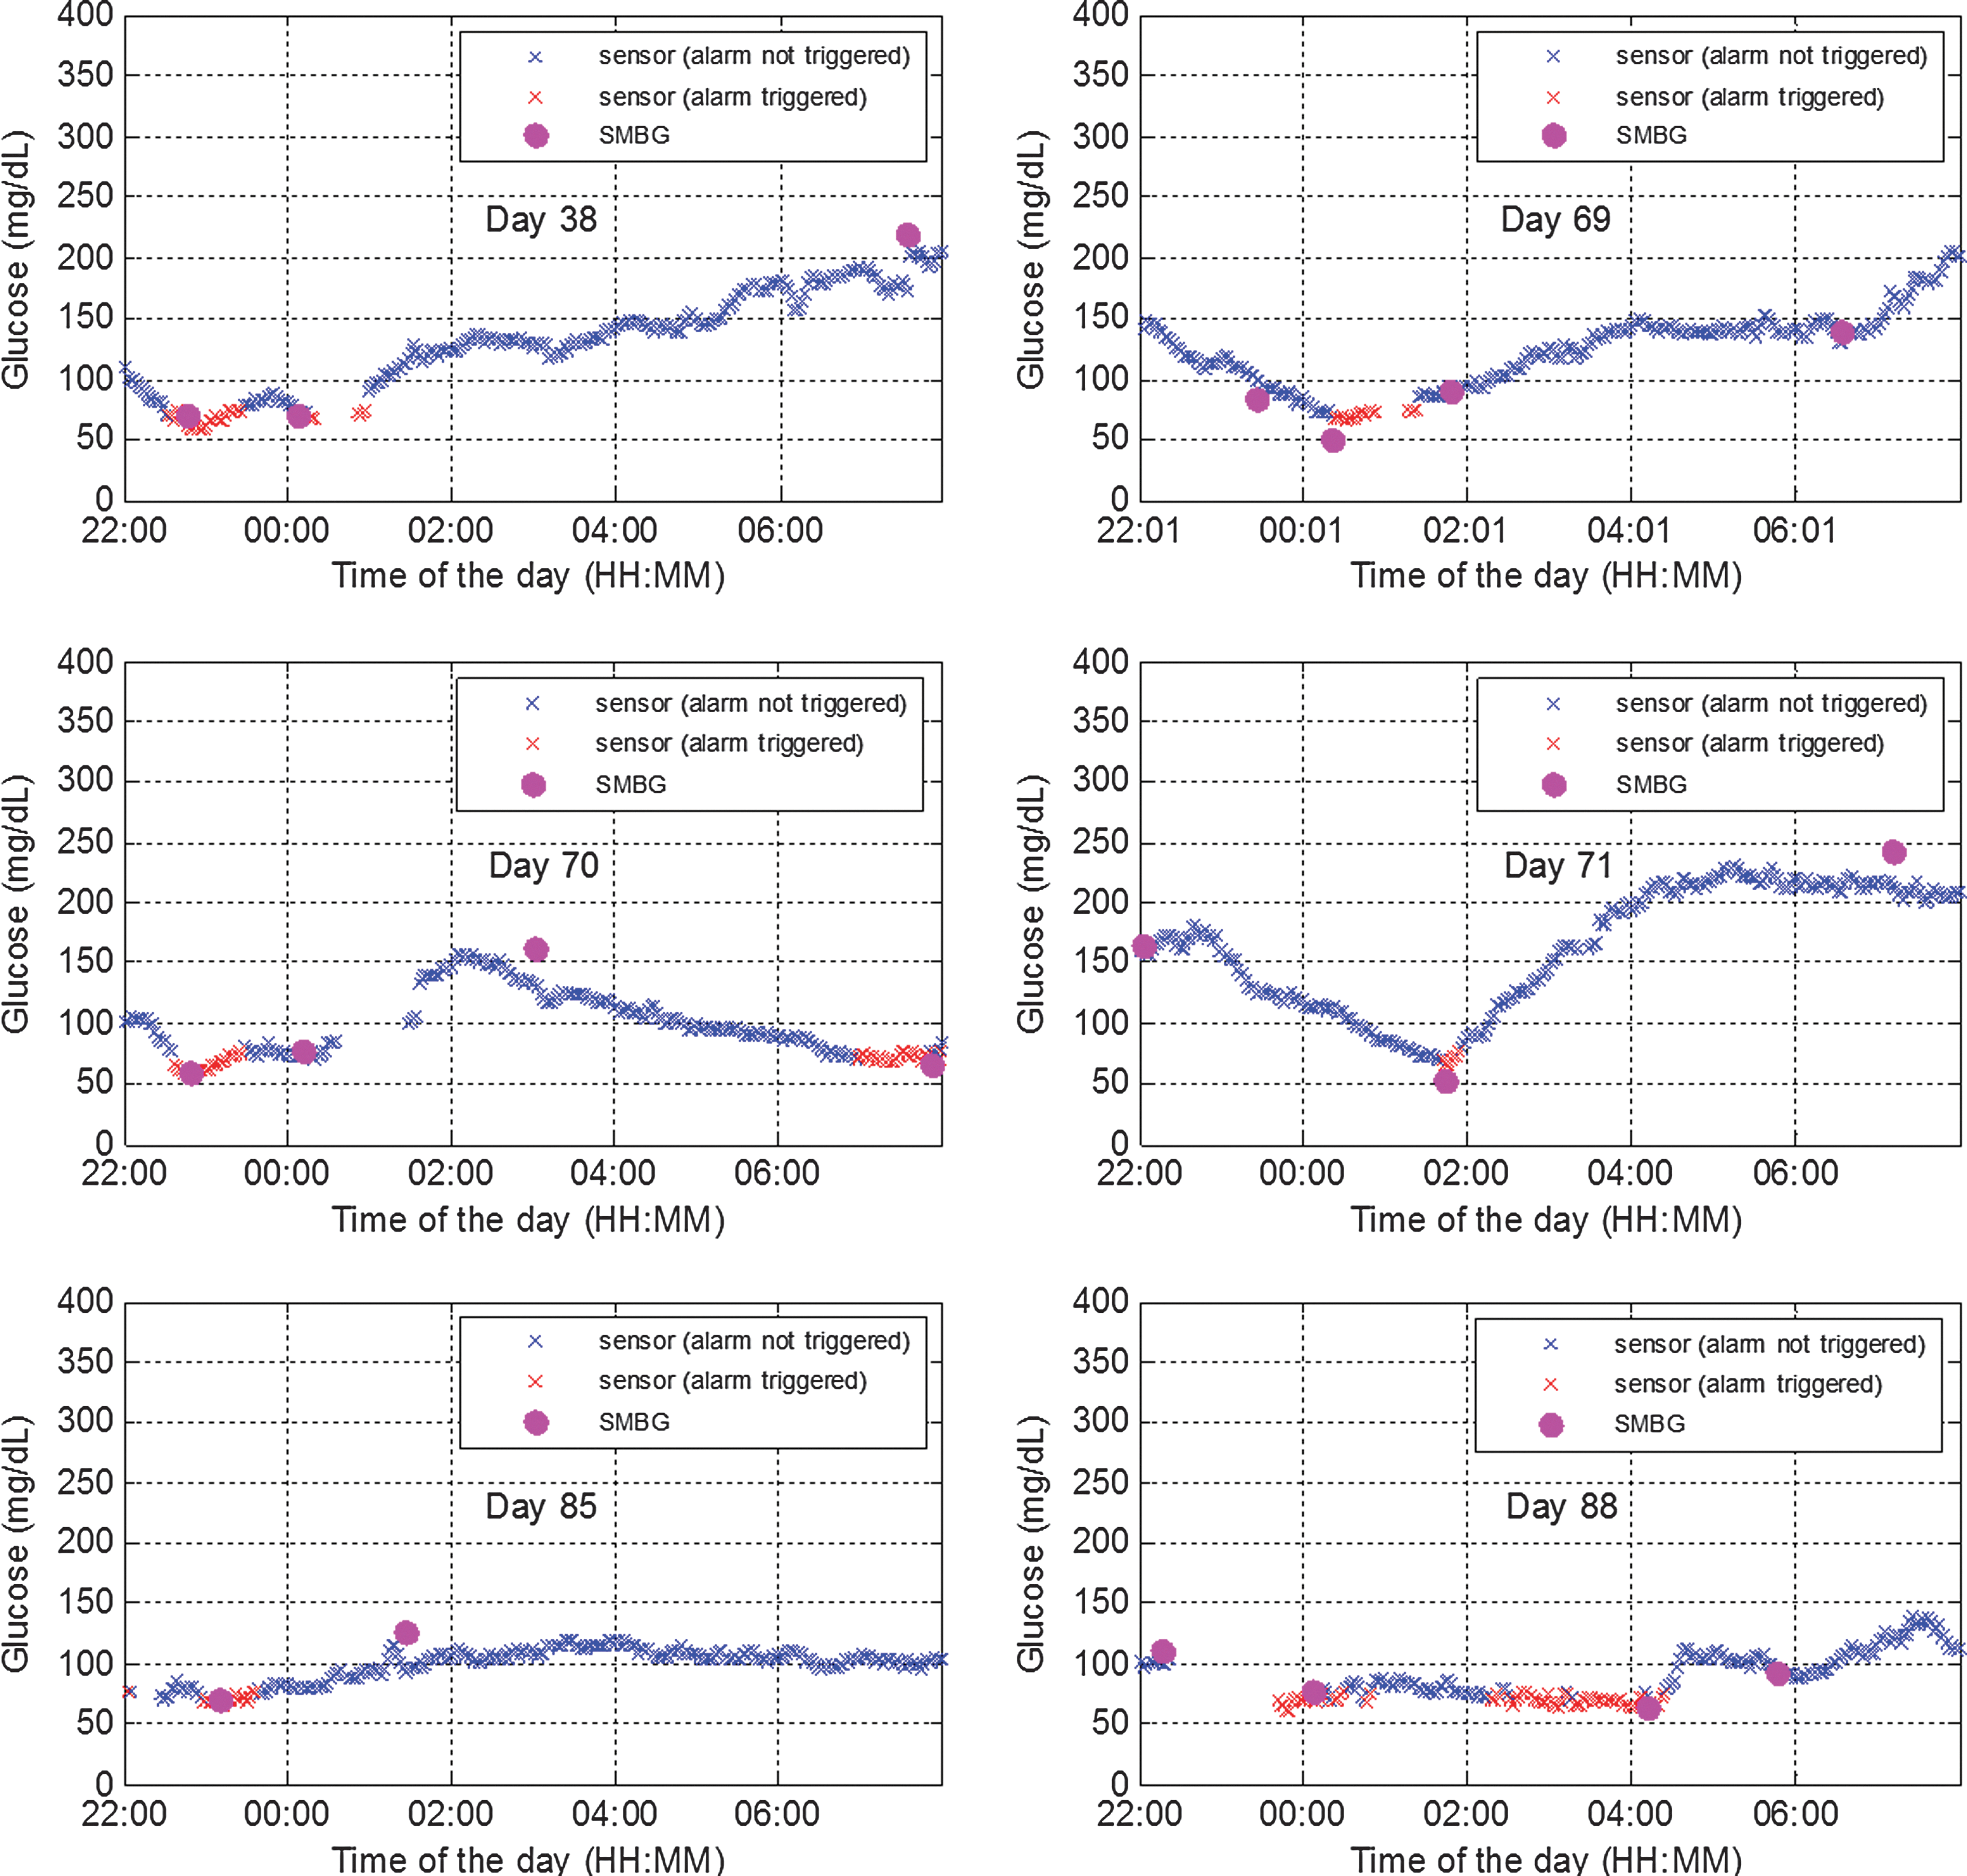
Nocturnal hypoglycemic alarms recorded in one subject. SMBG, self-monitoring of blood glucose. (Color graphics available at
Table 3 shows that the overall prevalence of nights with hypoglycemic alarms being triggered for at least 10 min was 13.6% (n=100). There were 26 SMBG tests performed to confirm the presence of hypoglycemia, and 20 (77%) were found to be under 70 mg/dL (Table 3). Study subjects performed another 19 SMBG tests within 30 min after the hypoglycemic alarm was cleared, and 74% (14/19) were above 70 mg/dL. In addition, they performed 21 SMBG tests within 30–60 min after hypoglycemia resolution, and 90% (19/21) were above 70 mg/dL, indicating a sustained recovery into euglycemia (Table 3).
Data are number of self-monitoring of blood glucose (SMBG) measurements in the given range.
A hypoglycemic alarm was set to be triggered by the system when glucose concentration went below 70 mg/dL. The alarms had a sensitivity of 77% and a specificity of 96%, indicating a 4% false alarm rate. The receiver operating characteristic curve is shown in Figure 5. The area under the receiver operating characteristic curve is 0.97. The true-positive rate and false-positive rate were calculated based on a sensitivity analyses done by setting the hypoglycemic alarm threshold to different levels. Table 4 shows mean and SD values of SMBG taken during a hypoglycemic event was 59±15 mg/dL. Sustained return into euglycemia was confirmed by a significant increase to 89±20 mg/dL (P<0.01) for SMBG values recorded within 30 min from hypoglycemic alarm clearance and a further increase to 114±56 mg/dL (P<0.01) at 30–60 min after hypoglycemia resolution.
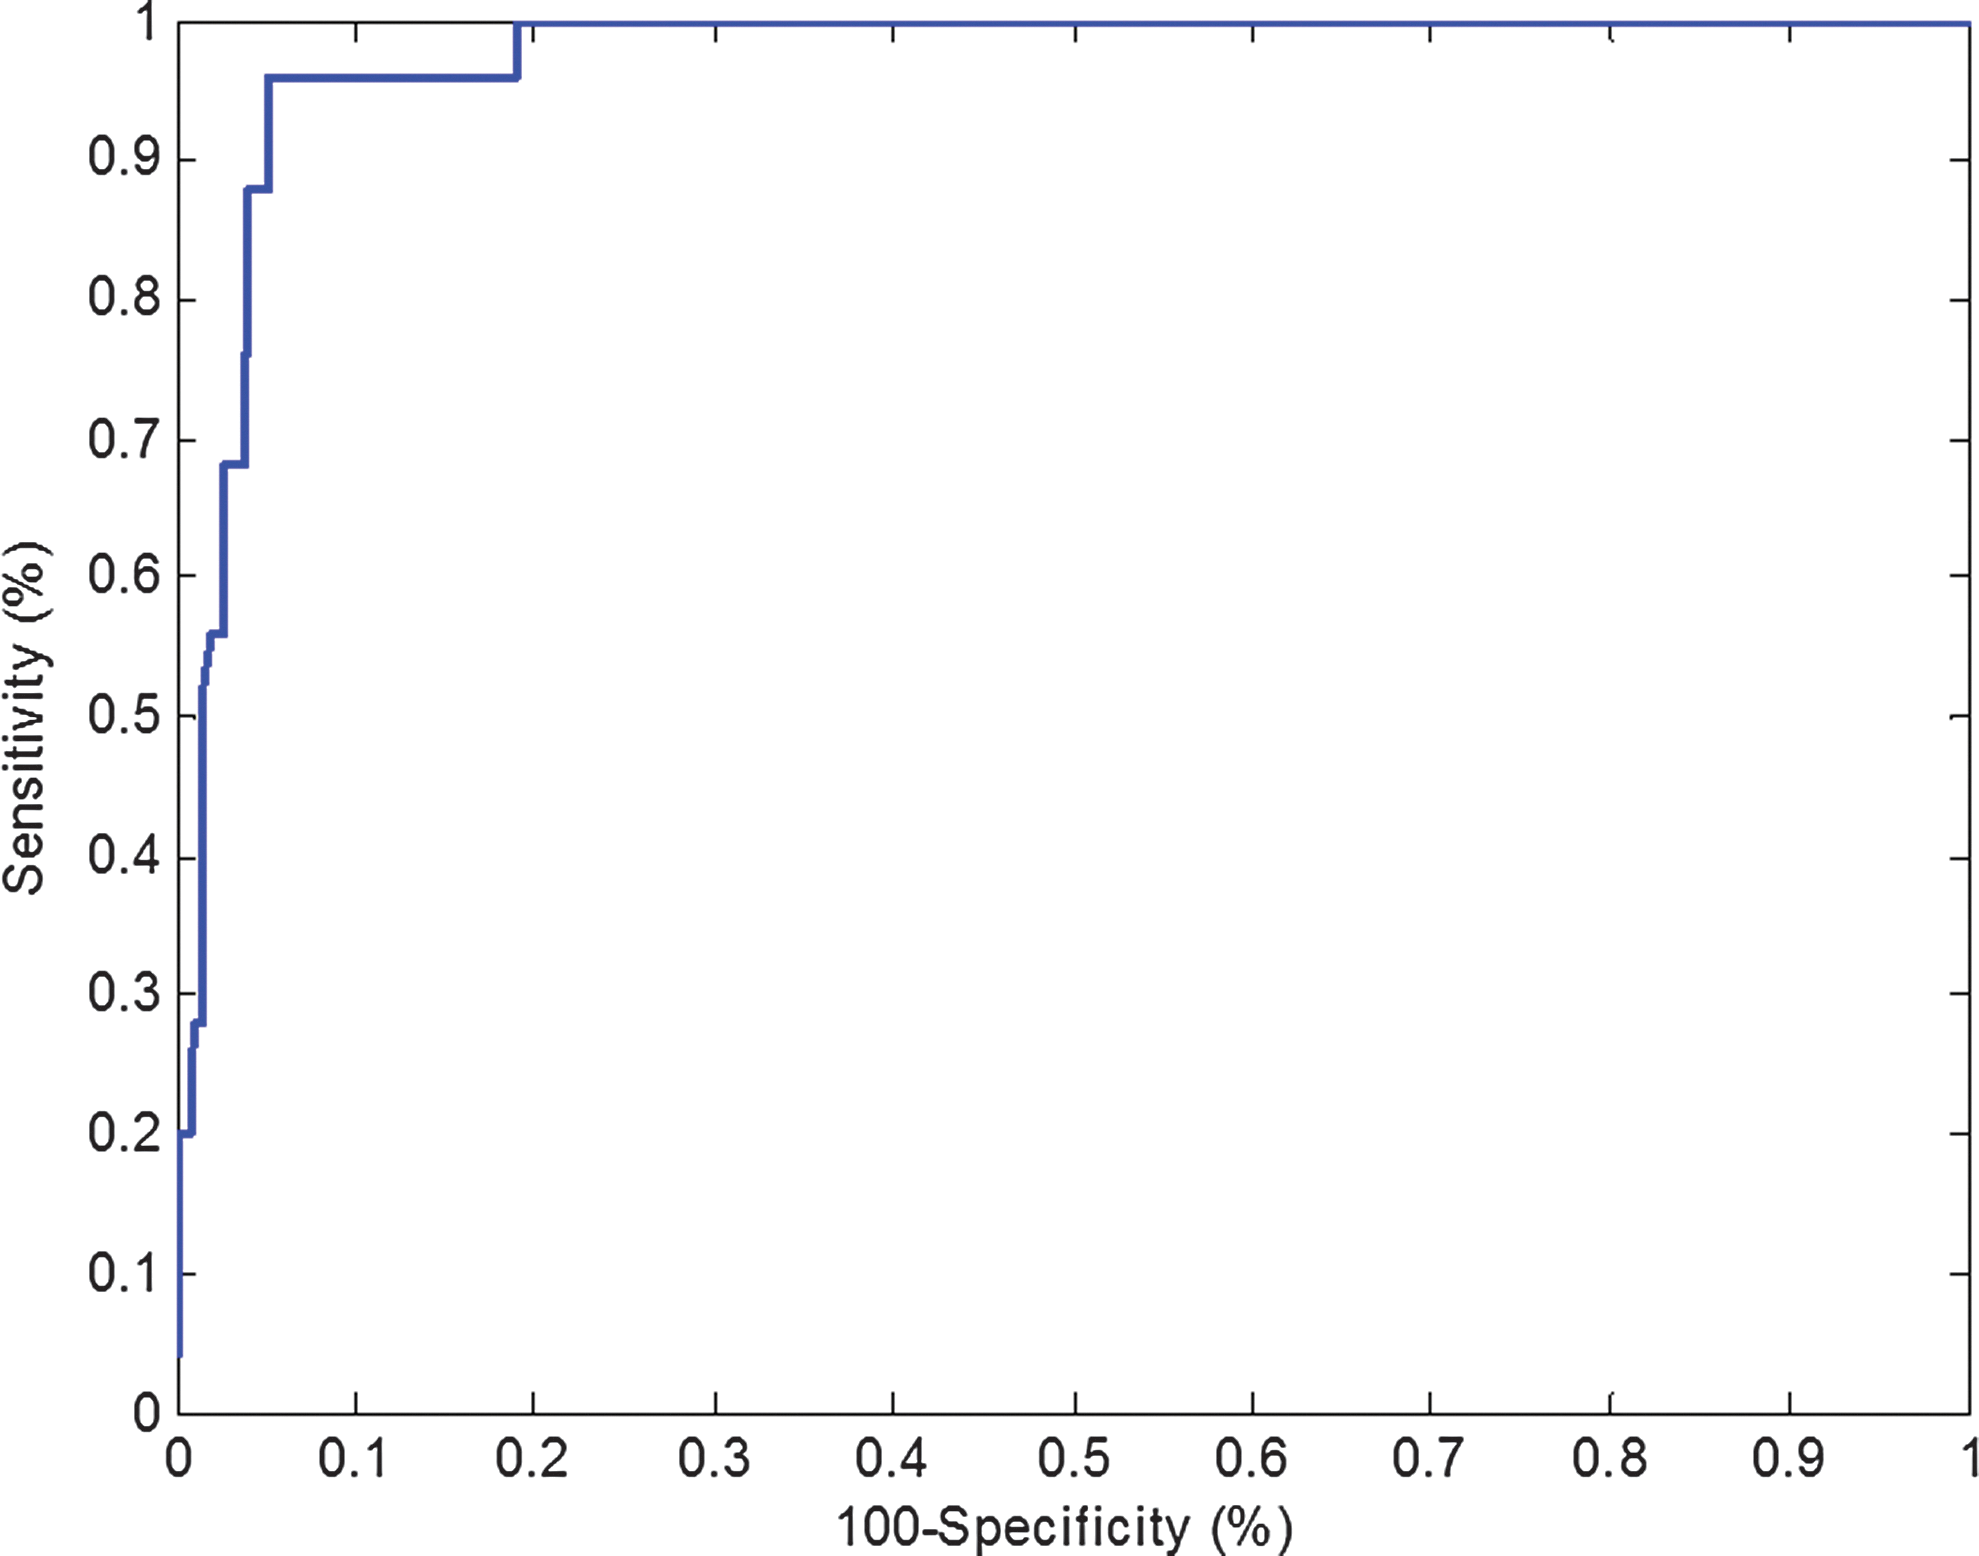
Receiver operating characteristic curve of the alarm. The area under the receiver operating characteristic curve is 0.97. (Color graphics available at
SMBG, self-monitoring of blood glucose.
Discussion
This clinical evaluation of a new, long-term subcutaneous CGM system demonstrated that a fully implantable sensor using an abiotic glucose recognition and fluorescence-sensing technology is capable of detecting nocturnal hypoglycemic episodes and helping subjects become aware of hypoglycemia. The average percentage of the nights with hypoglycemic alarm being triggered for at least 10 min was calculated to be 13.6%. When the alarms were triggered, 26% (26/100) of the time the subjects performed SMBG tests to confirm the hypoglycemic episode, and the sensitivity of the hypoglycemic alarms was calculated to be 77%. In 2013, Bay et al. 17 evaluated the reliability of nocturnal CGM (Guardian® REAL-Time CGM system and Sof-Sensor®; Medtronic MiniMed, Northridge, CA) in patients with T1DM and reported 65% sensitivity. After the alarms were cleared, 40% (40/100) of the time the subjects performed SMBG tests within 1 h to check if they were truly recovered from hypoglycemia, and the results of 82.5% (33/40) of the SMBG tests were above 70 mg/dL, indicating a recovery into euglycemia. In total, subjects awoke to 66% (66/100) of alarm events. By comparison, Buckingham et al. 18 reported subjects awoke to 66% of nocturnal alarm events.
The glucose rate of change was checked to detect any NSA, and all the glucose rates of change were within physiological limits. In addition, the rate of change during the pressure tests of all the participating subjects was checked to detect any PISA, and all the glucose rates of change were within physiological limits. The Senseonics CGM system did not show signs of being susceptible to NSA and PISA; therefore it does not require an algorithm to detect NSA or PISA and can lead to greater acceptance of CGM technology and better overall overcomes for patients with diabetes.
Footnotes
Acknowledgments
This study was funded by Senseonics, Inc., a privately held company. The authors wish to thank Mr. Steve Walters for clinical study management.
Author Disclosure Statement
X.W. and A.D. are employees of Senseonics Inc. S.I. declares no competing financial interests exist.
X.W. conducted the data analysis and statistics and wrote the manuscript. S.I. and A.D. reviewed and edited the manuscript.