
Abstract
Background:
This study explored the relationships between exogenous insulin requirements and endogenous variables in elderly patients with type 2 diabetes (T2D).
Subjects and Methods:
Patients with T2D 65 years of age or older were enrolled for a short hospitalization period in order to start or change their basal–bolus therapy. The following data were collected: age, sex, diabetes duration, body mass index, glycosylated hemoglobin, estimated glomerular filtration rate (eGFR), and triglyceride (TG) levels.
Results:
Data from 71 elderly T2D patients (31 men/40 women; 75.7 ± 6 years of age) were analyzed by data mining techniques. The total daily dose of insulin (TDI) ranged from 0.24 U/kg to 2.5 U/kg (ratio >1:10). Three clusters of patients were identified: Cluster 1 (n = 22) consisted of older patients (age, 82.05 ± 3.6 years) (P < 0.0001) with a TDI of 0.59 ± 0.21 U/kg/day and lower TG level (1.1 ± 0.4 mmol/L) (P < 0.0001). Cluster 2 (n = 22) consisted of patients with a TDI of 0.71 ± 0.24 U/kg/day with a higher eGFR (75.3 ± 18.8 mL/min) (P < 0.001) and a shorter duration of diabetes (13.6 ± 6.4 years) (P < 0.001). Cluster 3 (n = 27) consisted of patients with a larger proportion of macroangiopathic complications (P < 0.05), having a TDI of 1.31 ± 0.54 U/kg/day, higher TG level (2.2 ± 0.7 mmol/L) (P < 0.001), and lower eGFR (46.3 ± 16 mL/min). The average basal–bolus ratio was 43%/57% with a maximum bolus requirement due to carbohydrate intake at breakfast.
Conclusions:
Insulin requirements in elderly T2D patients vary widely. Age, TG level, and eGFR appeared to be the most predictive factors of TDI. Because of the small sample size, further studies would be required to extrapolate these results.
Introduction
T
Insulin requirement differs among patients with T2D, as their sensitivity to insulin is highly variable. In clinical practice, the starting dose of insulin is usually either prescribed according to the patient's body weight or attained by using a treat-to-target 12 protocol or the American Diabetes Association/European Association for the Study of Diabetes consensus algorithm. 13 Clinicians start with a low, safe dose and adjust as needed. Using a stepwise adjustment protocol can take a long time for the glycemia to normalize and is not optimal for basal–bolus therapy.
One of the challenges facing the elderly population with T2D is to better define their individualized insulin requirements. With this in mind, we designed this study to assess the insulin requirements in a cohort of elderly patients at a late stage of stepwise escalation therapy, hospitalized for the initiation or the adjustment of basal–bolus insulin treatment. The objective was to determine if these patients' insulin requirements were allocated to typical profiles and whether certain features were associated with these insulin requirement profiles. The classification of patients in different clusters was conducted by data mining techniques 14 based on insulin requirement. A database of patients was designed. Patients were categorized into three clusters of insulin requirement, and, in a second step, endogenous factors such as age, estimated glomerular filtration rate (eGFR), triglyceride (TG) levels, and duration of diabetes led to the classification of the patients in one of these clusters.
Our approach focused on the generic model that can determine which variables play major roles for dose prescription at this stage.
Subjects and Methods
Study population
In this study 71 T2D subjects were recruited. They were ≥ 65 years old and had been hospitalized because of poor control of their diabetes despite antidiabetes treatment, including basal insulin. Basal–bolus therapy was prescribed to improve blood glucose control.
Exclusion criteria were age <65 years and type 1 diabetes.
This study was conducted as part of scheduled hospitalizations of patients treated in the Endocrinology-Diabetology and Nutrition Department of the University Hospital in Reims, France. All patients signed an informed consent form.
Study design
This was a prospective, observational, single-center study that was conducted between January 2012 and February 2014. Seventy-one elderly T2D patients with poor glucose control were included and were hospitalized for a 5-day period in order to implement or optimize basal–bolus therapy. Hospitalization was decided by their physicians, taking into account the age of the patients who lived alone, often combined with frailty. It was hence very difficult for them to deal with multiple injection regimens. The following characteristics were gathered: gender, age, duration of diabetes, weight, body mass index (BMI), glycosylated hemoglobin (HbA1c), eGFR calculated using the Modification of Diet in Renal Disease formula, TG levels, presence of chronic complications of diabetes, comorbidities, and other antidiabetes treatments, including metformin or liraglutide. Determinations of the total daily dose of insulin (TDI) as well as the bolus dose were calculated at the end of the hospitalization period when metabolic control was achieved.
At admission, treatment with basal–bolus therapy was initiated by calculating the theoretical dose according to weight and using a 50–50% distribution for basal-bolus insulin. 15,16 The dose was adjusted every day to meet individualized glycemic targets during the hospitalization period. Capillary blood glucose was monitored at least six times per day: before each of the three meals, as well as at 4 p.m., at 11 p.m., and at night (3 a.m.). Geriatric assessment was done to identify the frail patients. These assessments included global geriatric scales such as the Mini Mental State Examination, the Mini Nutritional Assessment, screening for repetitive falls, the Activities of Daily Living, and the Mini Geriatric Depression Scale.
Preprandial glycemic target was for “vigorous” patients between 100 and 140 mg/dL and for frail patients between 120 and 180 mg/dL.
Nutritional habits and preferences were assessed for each patient. Carbohydrate was measured for each meal using a 10-g portion size. 17
Statistical analysis and data mining techniques
All statistical analyses were performed using R software (version 3.0.2). The distribution of the target variable (in U/kg) was not Gaussian. Each patient was described by 12 quantitative variables and three qualitative variables. Continuous variables were expressed as the arithmetic mean ± SD. Categorical variables were expressed as the percentage of the total. The data collected during the study were complex, multivariate, and heterogeneous. Classical inferential statistical techniques are not suitable and are limited in this context. Their multivariate and heterogeneous natures led us to use data mining techniques.
18
Our mining approach was divided into three phases: cluster analysis, explaining the clusters and highlighting their main features, and model building for interpretation: • The first exploratory phase was an automatic, unsupervised clustering stage. This phase consisted of a partition of sets of patients based on the prescriptions obtained at the end of their hospitalization. The goal was to cluster the cases (i.e., the patients) with respect to all variables, including the target variable (in U/kg). At the first stage of pretreatment, we performed a principal component analysis.
19
Then, hierarchical ascendant clustering (HAC) (using the criterion of Ward
20
) led to the determination of the number of clusters to retain. The results obtained by several clustering algorithms were compared. The partition obtained with HAC was compared with the ones obtained with the algorithm of k-means or the k-medoids algorithm. • The second phase was to describe the clusters and to underline their main features. This phase of interpretation was necessary to understand the differences among the clusters that were detected. Discrimination of these clusters from the endogenous variables and targeting variable (in U/kg) had a dual purpose: interpreting the score by giving meaning to these groups and targeting the most discriminating variables. Groups were interpreted according to the explanatory variables such as (age, BMI, eGFR, TG, duration of diabetes, HbA1c) and the variable target (in U/kg). Wilcoxon sign-rank tests were used to compare age, BMI, TG, eGFR, HbA1c, and duration of diabetes among the clusters of patients. When comparing differences between clusters, χ2 analysis was used for categorical variables. The differences between clusters were considered statistically significant when the P value was <0.05. • Finally, the third phase was to identify a few decision-making rules, taking into account both the explanatory variables and the target variables (in U/kg). The rules were obtained by using the decision tree methods (the C4.5 algorithm of Quinlan
21
).
Results
Characteristics of patients
The quantitative and qualitative characteristics of 71 patients, their insulin requirements, and the characteristics of the three clusters are summarized in Table 1.
For continuous variables data are mean ± SD values. For categorical variables data are percentages.
BMI, body mass index; eGFR, estimated glomerular filtration rate; HbA1c, glycosylated hemoglobin; TG, triglycerides.
Regarding the level of frailty, 13 patients (18.3%) were found to be frail, and the rest (81.7%) not so.
TDI per day (in U/kg/day)
Distribution of the target variable (in U/kg) showed that TDI values were very heterogeneous among the patients and varied according to a 1 to >10 ratio of between 0.24 U/kg and 2.5 U/kg.
The largest insulin requirements were between 0.5 and 1 U/kg for 53.5% of the patients (n = 38).
Number of patient clusters
When using the HAC method, interpretation of the dendrogram in Figure 1 suggests quite clearly that the number of clusters to retain should be three. Clusters that were obtained using the patients' data included both the explanatory variables (age, BMI, TG, …) and the target variable (in U/kg).
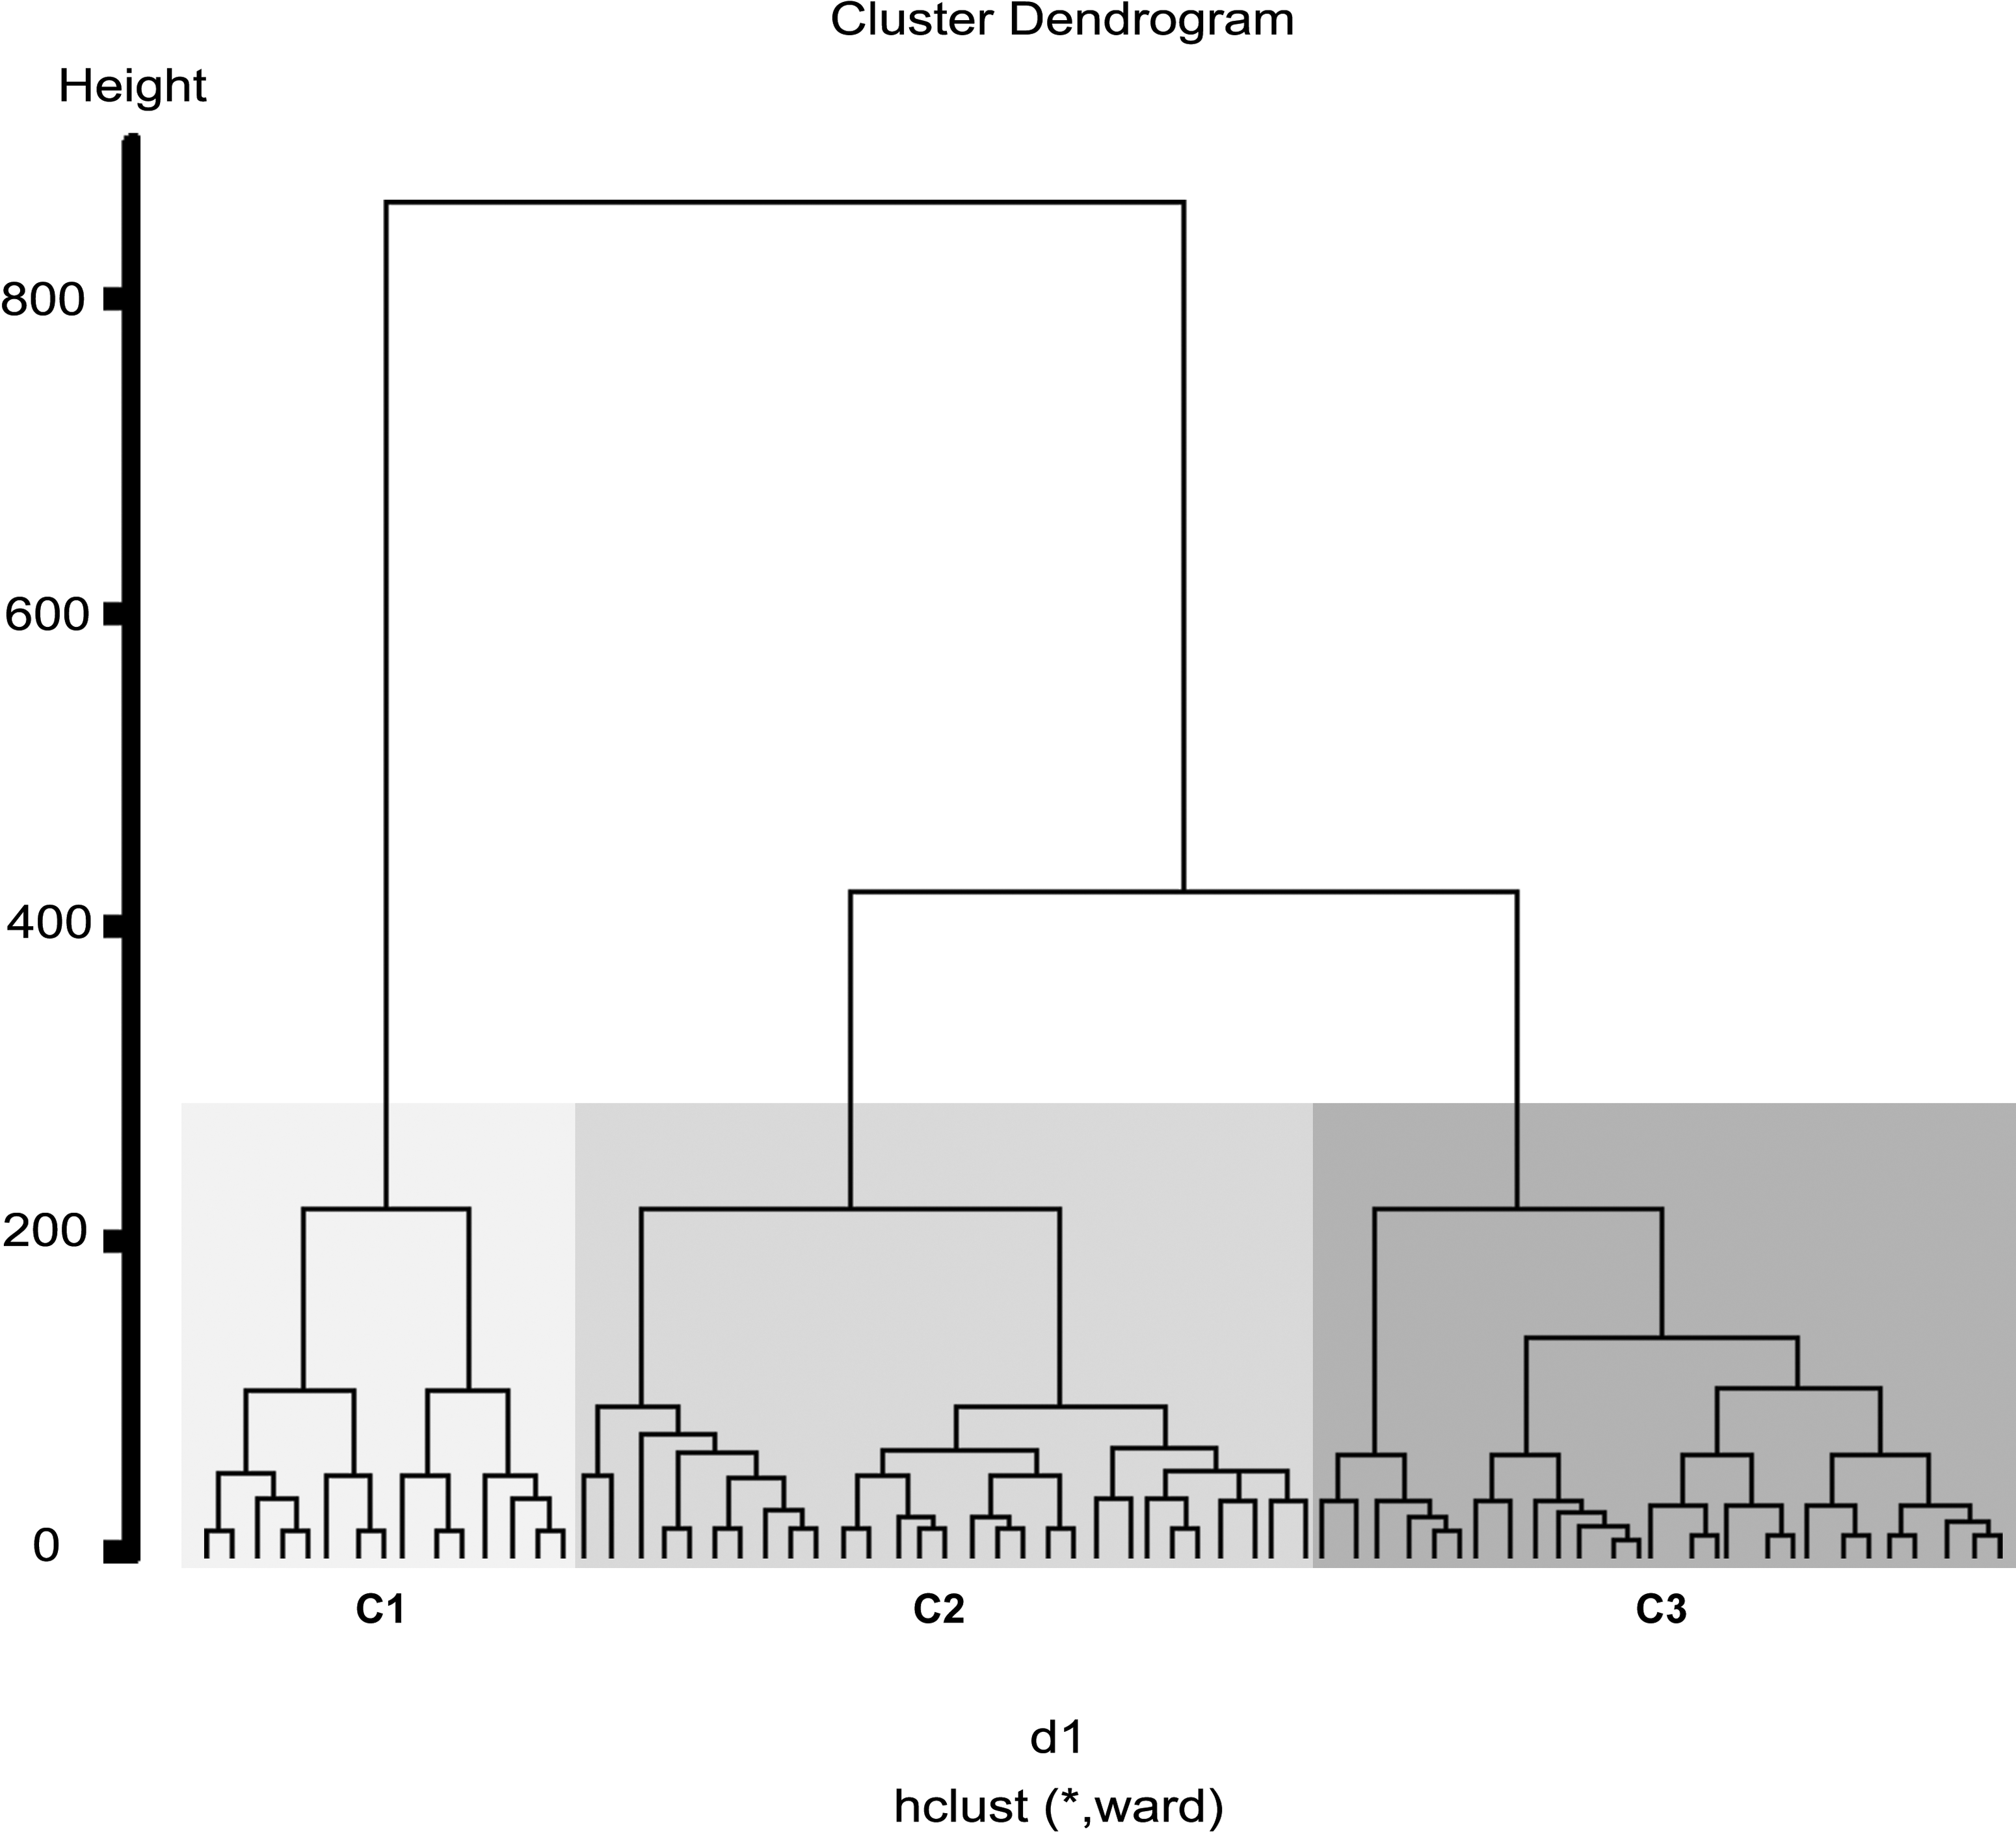
Number of clusters obtained by hierarchical ascendant clustering (n = 71, for continuous variables). C1–C3, Clusters 1–3.
The numbers of patients per cluster were 22, 22, and 27 for Clusters 1–3, respectively. Both the k-means algorithm and the k-medoid algorithm gave consistent results of interclustering agreement with HAC (84.03%).
Description of clusters
The observation of the distribution of TDI by weight (in U/kg) showed that Cluster 1 was distinguished from the other two clusters (Fig. 2a). This cluster was particularly characterized by a low TDI. The average TDI (in U/kg) for the first cluster was 0.59 ± 0.21 U/kg, and that for the second cluster was 0.71 ± 0.24 U/kg; the highest TDI was recorded for the last cluster (1.31 ± 0.54 U/kg).

Distribution of the continuous variables in each of the three clusters:
Similarly, the age distribution suggested that Cluster 1 included older patients than the other clusters (Cluster 1, 82.05 ± 3.6 years; Cluster 2, 71.32 ± 5.1 years [P < 0.0001]; Cluster 3, 74.2 ± 5.6 years [P < 0.0001]) (Fig. 2b).
The BMI variable was different between Clusters 2 and 3; patients from Cluster 3 were characterized by a higher BMI (Cluster 3 vs. Cluster 2, 36.8 ± 5.8 kg/m2 vs. 32.08 ± 6.1 kg/m2; P < 0.05) (Fig. 2c).
The higher level of TG differentiated Cluster 3 from the other two clusters (Cluster 3, 2.2 ± 0.7 mmol/L; Cluster 1, 1.1 ± 0.4 mmol/L [P < 0.001]; Cluster 2, 1.6 ± 0.6 mmol/L [P < 0.01]) (Fig. 2d).
Comparison of the distributions of the eGFR showed a difference between Cluster 2 and Clusters 1 and 3 (Cluster 2, 75.3 ± 18.8 mL/min; Cluster 1, 56.9 ± 19.3 mL/min [P < 0.01]; Cluster 3, 46.3 ± 16 mL/min [P < 0.001]) (Fig. 2e).
Finally, the distribution of the diabetes duration among the three clusters showed a statistically significant difference (P < 0.001) between Cluster 2 (short duration of diabetes) and the other clusters (Cluster 2, 13.6 ± 6.4 years; Cluster 1, 25.7 ± 11 years) or versus Cluster 3 (24.9 ± 11.7 years) (Fig. 2f).
Likewise, cluster membership was associated with use of antidiabetes treatments and the presence of macroangiopathy. Antidiabetes treatments (metformin or liraglutide) were used in 50% of the indivdiduals in Cluster 2 (P < 0.05). Patients in Cluster 3 presented more macroangiopathic complications (81.4%) (P < 0.05) compared with the other two clusters.
There was no significant difference in HbA1c distribution among the three clusters of patients.
Decision tree model
Decision trees have the advantage of generally offering easier interpretations of the clusters. The presented recursive partitioning allowed an explicit reading of Clusters 1–3 (Fig. 3). This decision tree helped to propose the total daily dose for each cluster based on endogenous variables (age and TG).

A few rules obtained by using the decision tree method. C1–C3, Clusters 1–3; MDRD, Modification of Diet in Renal Disease; TG, triglyceride.
Eight rules were created by the decision tree. From these, we extracted the three rules that were associated with statistically significant differences among the proposed clusters. The rules showed that TDI per weight decreased or increased significantly according to age, TG level, eGFR, and diabetes duration.
The significant rules were as follows: • If the age was >79 years and TG level was ≤1.62 mmol/L, then the patients belonged to Cluster 1, and the suggested dose was 0.59 ± 0.21 U/kg (P < 0.01). • If the age was ≤79 years and eGFR was ≤50 mL/min, then the patients belonged to Cluster 3, and the suggested dose was 1.31 ± 0.54 U/kg (P < 0.01). • If the age was ≤79 years and eGFR was >50 mL/min, duration of diabetes was ≤30 years, and TG level was ≤2.53 mmol/L, then the patients belonged to Cluster 2, and the suggested dose was 0.71 ± 0.24 U/kg (P < 0.01).
Distribution of the basal–bolus ratio
The average of the total daily dose was divided into 43 ± 7% basal and 57 ± 7% bolus for all patients. For Clusters 1 and 2, the basal was 40 ± 10% and the bolus was 60 ± 10%, and for Cluster 3, the basal was 34 ± 16% and the bolus was 66 ± 16%.
Even if Clusters 1 and 2 seemed to have similar basal–bolus ratios, the distribution of basal and bolus insulin was not homogeneous in Cluster 3 patients, suggesting that the similarity between individuals in this class was much less (Fig. 4).
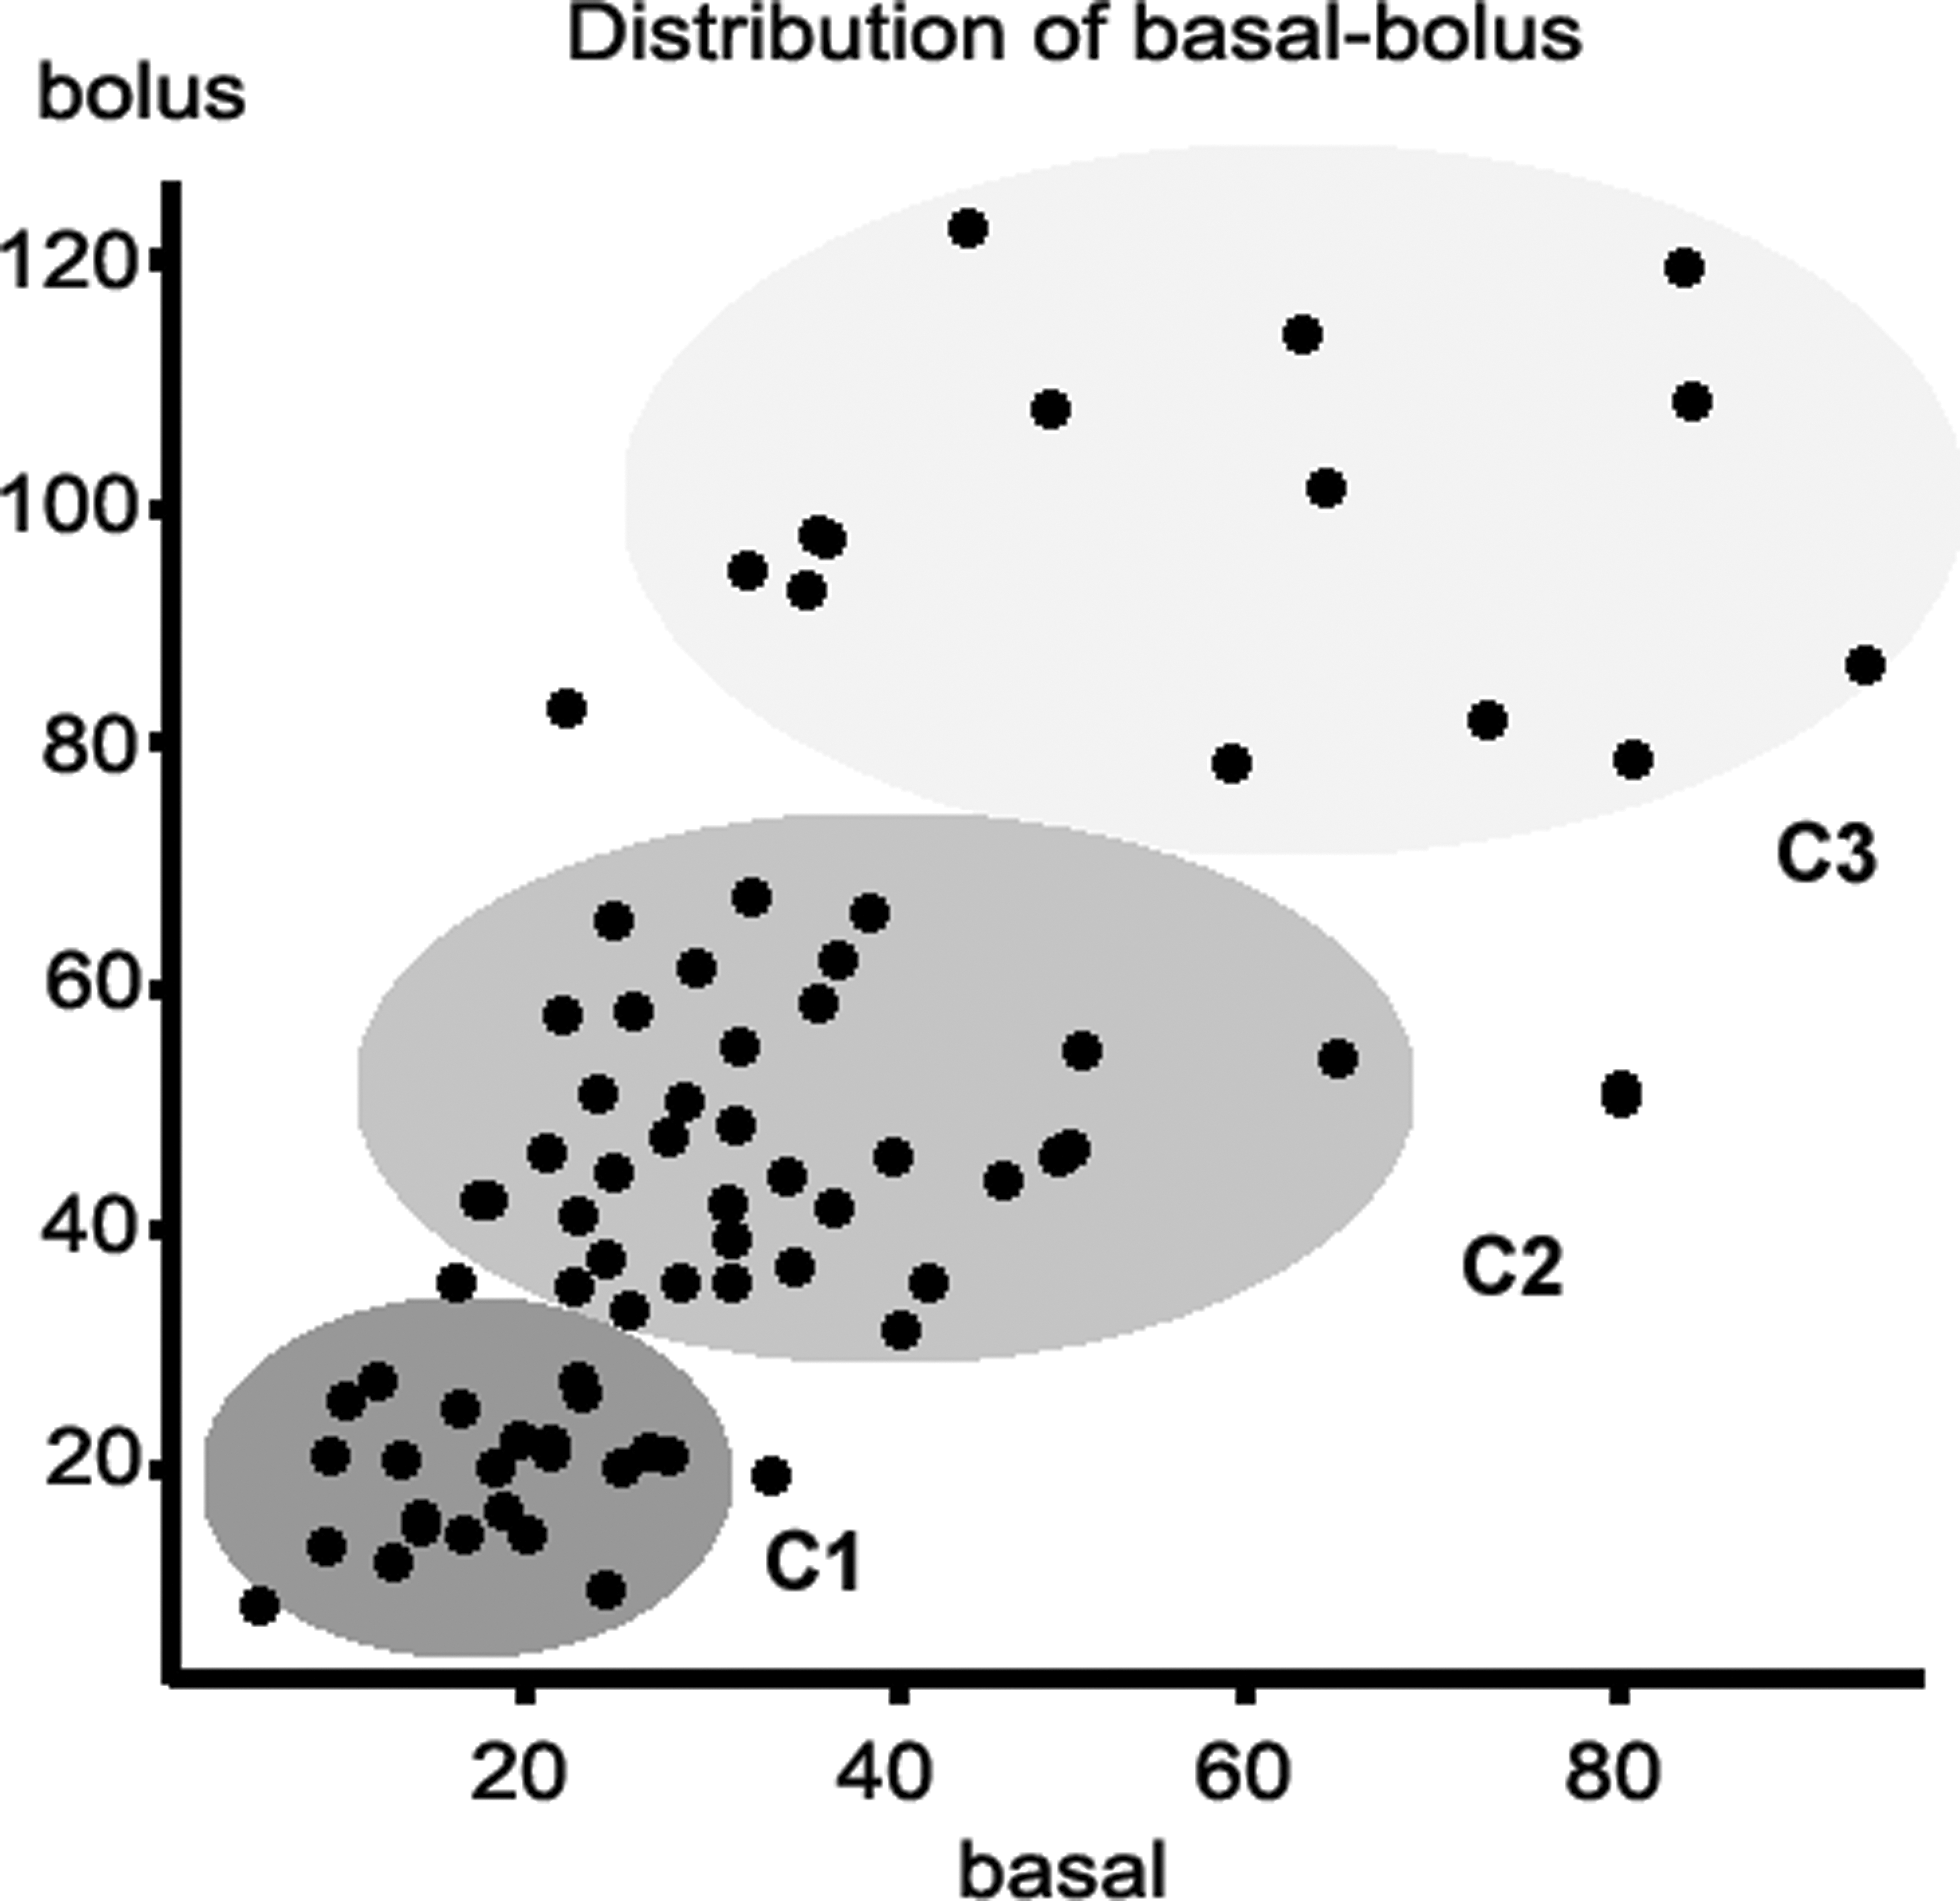
Distribution of basal–bolus insulin (in U) for each cluster. C1–C3, Clusters 1–3.
Variation of the bolus dose to carbohydrate ratio during the day
We calculated the ratio between bolus insulin and carbohydrate intake for each meal. The results showed that the ratio was higher at breakfast (bolus/breakfast) than at lunch (bolus/lunch) and dinner (bolus/dinner) (P < 0.0001). The mean bolus doses for a 10-g portion of carbohydrate for each cluster and each meal are shown in Table 2. This difference was found in all of the patients regardless of their insulin requirements.
Data are mean ± SD values.
Discussion
Prescribing insulin in T2D patients can be a difficult challenge. The need for insulin treatment usually occurs at the end of the natural evolution of diabetes with the presence of both insulinopenia and insulin resistance, combined to different degrees. 22 In this context, switching to basal–bolus therapy may be required to achieve individualized glucose targets as has previously been recommended (American Diabetes Association/European Association for the Study of Diabetes). 13,23 This treatment can be particularly difficult in elderly patients in whom the risk of hyperglycemia has to be balanced with the high risk of hypoglycemia. Optimal dose prescription in older patients with T2D requires an assessment of insulin needs (in this target population). The standard regimen applied by clinicians involves a daily adjustment of the prescribed insulin dose to achieve glycemic goals for each patient.
For this reason we propose here a relatively new approach based on observational data analysis. We built a database composed of all the data on insulin treatment in a cohort of elderly patients hospitalized for 5 days, and we integrated the following endogenous variables: age, gender, duration of diabetes, BMI, TG levels, HbA1c, eGFR, presence of macrovascular complications, and treatment by metformin/liraglitude. The results demonstrated the high variability (from 1 to 10) of the insulin requirements in the whole cohort of elderly T2D patients, as was previously suggested in patients with T2D. 24 Clustering algorithms provided three clusters of patients with different insulin needs: TDI per weight for Cluster 1 was 0.59 ± 0.21 U/kg, for Cluster 2 it was 0.71 ± 0.24 U/kg, and Cluster 3 had the highest TDI per weight of 1.31 ± 0.54 U/kg. Using these three clusters allowed a faster optimization of the insulin dose, despite the complexity of insulin requirement in T2D.
This work led to the characterization of some discriminatory factors among the three clusters. We highlighted that age, TG levels, and eGFR may be important factors for insulin requirement according to our decision tree. Indeed, age is already known to be an important factor linked to insulinopenia, as it has been demonstrated that β-cells' activity declines rather than number with age in animal models and possibly in humans as well. 25 But, age is also related to an increase of insulin resistance associated with the loss of muscle mass (sarcopenia) 6,26 and intraabdominal fat. 27
The results also showed that TDI decreased with increasing age. In this study the T2D patients over 79 years of age with TG levels of ≤1.6 mmol/L needed a lower TDI (in U/kg) than patients less than 79 years of age (P < 0.01). These results could mean that in old age, insulinopenia may be the most important defect explaining the chronic hyperglycemia seen. Furthermore, these patients had a mean duration of diabetes of 25.7 ± 11 years, which is also consistent with decreased insulin secretion by the β-cells. 28
In this study, TG levels helped to classify patients. Normal TG levels seemed to be a significant indicator of good insulin sensitivity in Cluster 1 patients. Cluster 2 patients, who were less sensitive to insulin, presented slightly elevated TG levels together with shorter duration of diabetes (13.6 ± 6.4 years) and no renal failure (eGFR = 75.3 ± 18.8 mL/min). This indicator seemed more predictive than BMI to reflect insulin resistance, which is also consistent with the findings of other studies. 29
The value of eGFR was the lowest in Cluster 3 patients, therefore suggesting that the presence of renal failure was consistently associated with increased insulin requirement, after considering other variables such as age, TG level, or duration of diabetes. This association between renal failure and insulin resistance has already been demonstrated by other authors. 30
However, no relationship was found between TDI (U/kg) and HbA1c levels or gender.
Another goal of our study was to analyze the basal–bolus ratio among elderly patients throughout the day. The basal–bolus ratio ranged from 40% to 60% for Clusters 1 and 2, but in Cluster 3 the range was from 34% to 66%. This cluster was composed of heterogeneous patients for whom the bolus dose was much higher than the basal insulin dose.
One of the observed factors altering the variability of the insulin dose was the time of day, and indeed the insulin requirements did vary throughout the day. Bolus requirements in the morning were consistently higher at lunch and dinner compared with carbohydrate intake, as has already been suggested in patients with type 1 diabetes. 31
However, this study had some limitations. First, the study subjects were limited to a single French center with a small number of patients (n = 71). Therefore, the results of this study cannot be generalized to the populations of other countries, who might have different dietary or genetic patterns. Second, because of the highly selected population (elderly patients) with multiple daily insulin injection routines, the findings are difficult to generalize to other T2D patients; thus the results should be confirmed with a larger number of patients. Third, as with all analytical methods, our decision tree is still not precise enough to propose the exact dose to be taken without taking other variables into consideration. Measurements of waist circumference, C-peptide level, or homeostasis model of assessment could clarify the evaluation of insulin resistance more precisely. By the same token, thigh circumference would be a reasonable indicator for the loss of muscle mass (sarcopenia). In order to go beyond these medical limits artificial intelligence approaches, such as “case-based reasoning” are now possible and which could also help solve this complicated problem of individualized insulin prescription. 32
In conclusion, our study demonstrates that insulin requirements in elderly patients with T2D are highly variable, and it points out a significant association between insulin requirement and certain endogenous variables in this population, such as age, TG levels, and the presence of renal failure. The decision tree identified three subgroups of elderly patients with different insulin requirements. This methodology, proceeding from data mining techniques, could be used in different populations in their own context to further validate this model. Our model could complete and confirm more empirical experience-based models of medical experts. This approach could improve insulin therapy for future patients in order to reduce hospitalization time and optimize treatments more rapidly.
Footnotes
Acknowledgments
This research study was funded by Axon Care.
Author Disclosure Statement
No competing financial interests exist.