
Abstract
The article entitled, “Evaluation of Blood Glucose Meter Efficacy in an Antenatal Diabetes Clinic,” 2016;18(2):68–74. DOI: 10.1089/dia.2015.0104, is being officially retracted from Diabetes Technology and Therapeutics (DTT).
One year after the publication of this article, the lead author, Dr. Rachel T. McGrath (Royal North Shore Hospital; Sydney, Australia), contacted the Editor-in-Chief of DTT to ask for a significant number of corrections be made to the published text due to erroneous analyses of the data. After reviewing the pervasive nature of the requested changes, the Editor determined that the corrections do not qualify as errata, but instead warrants a full retraction.
While the errors in the reported analyses were unintentional, DTT and its editorial leadership are committed to maintaining the highest level of scientific reporting and publishing, and therefore officially retracts the article.
Introduction
T
The incidence of diabetes in pregnancy is increasing, with the latest figures published by Diabetes Australia showing gestational diabetes mellitus (GDM) will be detected in 3–8% of pregnant women during Weeks 24–28 of pregnancy. 7 This is further compounded by the concomitant rise in prediabetes and type 2 diabetes in the general population. 8,9 Rates of GDM vary substantially between and within countries; however, the latest International Diabetes Federation statistics demonstrate a similar increase in GDM incidence, with up to 15% of pregnant women affected. 10 In addition, the most recent recommendations by the Australasian Diabetes in Pregnancy Society have changed the diagnostic criteria for GDM, incorporating the World Health Organization and International Association of Diabetes and Pregnancy Study Groups guidelines (75-g oral glucose tolerance test results: fasting plasma glucose, 5.1–6.9 mmol/L; 1-h plasma glucose, ≥10 mmol/L; 2-h plasma glucose, 8.5–11.0 mmol/L). 11 This is predicted to further increase the number of patients classified as having diabetes in pregnancy. 12
Blood glucose meters are routinely used to monitor capillary blood glucose levels (BGLs) in individuals with diabetes. The technology used in the meters is based on the glucose oxidase or glucose dehydrogenase enzymatic reaction, with some meters also using dynamic or static electrochemistry as a way of controlling for dilution factor differences. The International Organization for Standardization (ISO) has recently released an updated set of guidelines for blood glucose monitoring systems, with lower levels of deviation now recommended. 13 Most blood glucose meters have been validated for use in the general diabetes population; however, data in the pregnancy population are limited.
Several exogenous factors may interfere with the accuracy of blood glucose meters. Changes in temperature, hematocrit, and levels of ascorbic acid have been shown to affect the performance of blood glucose meters, particularly those that do not have an intrinsic dilution factor readjustment and correction system. 14 As a consequence of the pregnancy-associated expansion in blood volume, measures of glycemic control are subject to inaccuracy. 15 Therefore, meters that minimize these effects would be the preferred choice in pregnancy.
Recent studies have examined the efficacy of various blood glucose meters in women with diabetes in pregnancy. Parwaiz et al. 16 determined the accuracy of two blood glucose meters (the FreeStyle Lite® from Abbott Diabetes Care [Alameda, CA] and the Accu-Chek Performa® from Roche Diagnostics [Leverkusen, Germany]) by comparing the results obtained with that of the laboratory plasma glucose level, demonstrating good concordance for both meters. Conversely, comparison of six blood glucose meters (the Accu-Chek Advantage-II® [Roche Diagnostics], the Accu-Chek Performa, two OptiumXceed® meters [Abbott Diabetes Care], the FreeStyle Lite, and the Stat-Strip® [Nova Biomedical, Waltham, MA]) in an antenatal diabetes clinic setting found that blood glucose meters are not providing accurate readings in diabetes in pregnancy. 17 It was further observed that low hematocrit affected two of the meters tested and that capillary blood glucose readings could vary from the laboratory plasma glucose value by up to 2 mmol/L. Thus, it is uncertain whether blood glucose meters are effective at providing accurate results in diabetes in pregnancy.
The aim of this study was to evaluate the efficacy of two blood glucose meters in a population of women with diabetes in pregnancy attending an outpatient antenatal clinic for diabetes education and management. The performance of the blood glucose meters was compared with the laboratory plasma glucose result as the gold standard, and the effect of hematocrit on meter accuracy was determined.
Materials and Methods
Study population
Pregnant women with diabetes attending an outpatient antenatal clinic for diabetes education, management, and routine blood testing were eligible for inclusion in the study. Types of diabetes included preexisting type 1 diabetes, preexisting or newly diagnosed type 2 diabetes, and newly diagnosed GDM. GDM was diagnosed using a 75-g oral glucose tolerance test (fasting glucose of ≥5.5 mmol/L and/or a 2-h glucose of ≥7.8 mmol/L) between 24 and 28 weeks of gestation, according to the modified local criteria. 18 The oral glucose tolerance test was carried out earlier in pregnancy for women at higher risk of developing GDM (n = 14), such as those with a history of GDM in previous pregnancies (n = 4), a history of polycystic ovary syndrome (n = 2), a family history of diabetes (n = 7), or those with an increased body mass index (>35 kg/m2) (n = 1). 19 The exclusion criteria comprised an inability to attend the local pathology service for blood sampling, eating 2 h or less before the blood testing, and patients who were unable to provide informed consent. Study recruitment took place over an 8-month period, between April and December 2014.
Blood glucose meter testing and collection of blood samples
Capillary blood glucose measurements were carried out in duplicate using the FreeStyle Lite (Abbott, Sydney, Australia) and BGStar® (Sanofi, Sydney) blood glucose meters. Both of these meters calculate the plasma-equivalent glucose concentration and have been validated for use in the general diabetes population against ISO 15197:2003 standards. 20,21
Capillary blood was obtained using a single-use lancet after participants had washed their hands, and one finger prick was used to obtain four samples, two samples per meter. The blood glucose meters were used in random order for each participant to minimize order bias. To ensure that the strips were used before their expiry date, two batches of blood glucose testing strips were used for the FreeStyle Lite meter (lot numbers 1366540 and 1379652), whereas three batches of testing strips were used for the BGStar meter (lot numbers JT08WX83G, KD31WU87H, and LF12WX42M). The meters were calibrated before use and throughout the study, in accordance with the manufacturers' guidelines.
Venipuncture was carried out within approximately 5 min, either before or after capillary blood glucose samples were obtained. Nonfasting blood samples for glucose level analysis were collected into Vacuette® glycolytic inhibitor tubes (Greiner Bio-One, Frickenhausen, Germany) as per standard clinical practice. These tubes contain sodium fluoride as a stabilizer, which prevents glycolysis of glucose within the blood sample. Blood samples were transported to the central laboratory for analysis within 60 min of collection. Blood samples that were processed (centrifuged and analyzed) in the laboratory greater than 2 h after collection were excluded from the final analysis to avoid falsely low glucose levels. 22 The routine laboratory plasma glucose assay used is the hexokinase method on the Abbott Architect C16000 analyzer (coefficient of variation [CV] <1.5% across the measuring range of the assay). Other biochemical variables assessed were glycated hemoglobin (HbA1c) and full blood count to determine hemoglobin level and hematocrit.
Capillary blood glucose meter results were assessed according to the ISO 15197:2013 guidelines. 13 These guidelines recommend that for samples with a BGL ≤4.2 mmol/L on laboratory testing, blood glucose meter results should be within 0.83 mmol/L for at least 99% of samples tested; similarly, for a BGL >4.2 mmol/L on laboratory testing, blood glucose meter results should be within 15% for at least 99% of samples tested.
Statistical analysis
A sample size of 100 was determined on the basis of detecting a clinically significant difference in blood glucose level of 0.5 mmol/L between the blood glucose meters and the standard laboratory plasma glucose assay, with 90% power and a 5% significance level.
The mean of the two capillary blood glucose readings per meter was used for comparison with the laboratory plasma glucose value. The mean difference in meter results was calculated as (mean of the blood glucose meter results – plasma glucose value), and the mean percentage bias indicates ([blood glucose meter results – plasma glucose value]/plasma glucose) ×100, as described by Perera et al. 17 Bland–Altman analysis was performed to evaluate agreement between the blood glucose meter and laboratory plasma glucose results. The Clarke Error Grid was formulated in 1987 as a way of determining the clinical significance of blood glucose meter deviations from the true blood glucose value. 23 Blood glucose meter results are categorized according to the percentage difference between the meter result and the laboratory glucose value. Clarke Error Grid analysis was carried out using R version 3.1 software with the EGA package. The effect of hematocrit on blood glucose meter results was determined using a two-sample t test. P values of <0.05 were considered significant. Statistical analyses were carried out using GraphPad (San Diego, CA) Prism® version 6 and Analyse-It® (Analyse-it Software, Ltd., Leeds, United Kingdom) version 2.30 software.
Ethics
This study was approved by the local institutional review board (Northern Sydney Local Health District Human Research Ethics Committee; study reference number 1309-308M). All participants provided written informed consent, prior to taking part in the study.
Results
Study population demographics
In total, 110 women were recruited to the study. Of the samples provided, 14 were excluded because of laboratory processing times of greater than 2 h, giving a final sample size of 96. Eight (8.3%) study participants had preexisting type 1 diabetes, six (6.3%) had preexisting or newly diagnosed type 2 diabetes, and 82 (85.4%) were diagnosed with GDM approximately 2 weeks prior to study inclusion. The mean ± SD age of women taking part in the study was 33 ± 4 years, and the mean ± SD stage of gestation was 26 ± 7 weeks. An overview of the study population characteristics is outlined in Table 1.
Data are mean ± SD values or number (%) as indicated.
GDM, gestational diabetes mellitus; HbA1c, glycated hemoglobin; T1DM, type 1 diabetes mellitus; T2DM, type 2 diabetes mellitus.
There was considerable ethnic diversity in the study population, with women of Southeast Asian, South Asian, white, and Pacific Islander descent taking part. The majority of women (80%) were managing their diabetes with lifestyle modification (i.e,. diet and exercise). Of the study participants taking antidiabetes medication(s), 15% were on metformin, 25% on metformin in combination with insulin, and 60% on insulin alone. The glucose treatment targets that were used in the study cohort were in keeping with the latest Australasian Diabetes in Pregnancy Society recommendations (i.e., fasting plasma glucose of <5.1 mmol/L and a 2-h postprandial glucose of <6.7 mmol/L).
Determination of blood glucose meter performance
The CV was determined for both blood glucose meters used in the study by measuring meter-specific control solution 20 times and dividing the SD of the results obtained by the mean result. The BGStar demonstrated a CV of 4.54% and the FreeStyle Lite a CV of 2.45%, both of which are below 5% and indicate acceptable precision for subsequent analysis.
The mean ± SD plasma glucose level (BGL) as determined by standard laboratory testing was 4.6 ± 1.4 mmol/L, with a range of 3–10.4 mmol/L. Corresponding mean values from the BGStar and FreeStyle Lite meters were 5.3 ± 1.4 mmol/L and 5 ± 1.3 mmol/L, respectively. The average difference in blood glucose meter and laboratory blood glucose results was 0.65 mmol/L for the BGStar and 0.42 mmol/L for the FreeStyle Lite. These results and additional analytical variables are outlined in Table 2.
BGL, blood glucose level; ISO, International Organization for Standardization.
Bland–Altman analysis was carried out to determine the agreement between blood glucose meter results and the laboratory plasma glucose values. As shown in Figure 1, both meters demonstrate a positive bias; the limits of agreement for the BGStar meter were −0.24 to 1.55 mmol/L, and those for the FreeStyle Lite meter were −0.30 to 1.15 mmol/L.
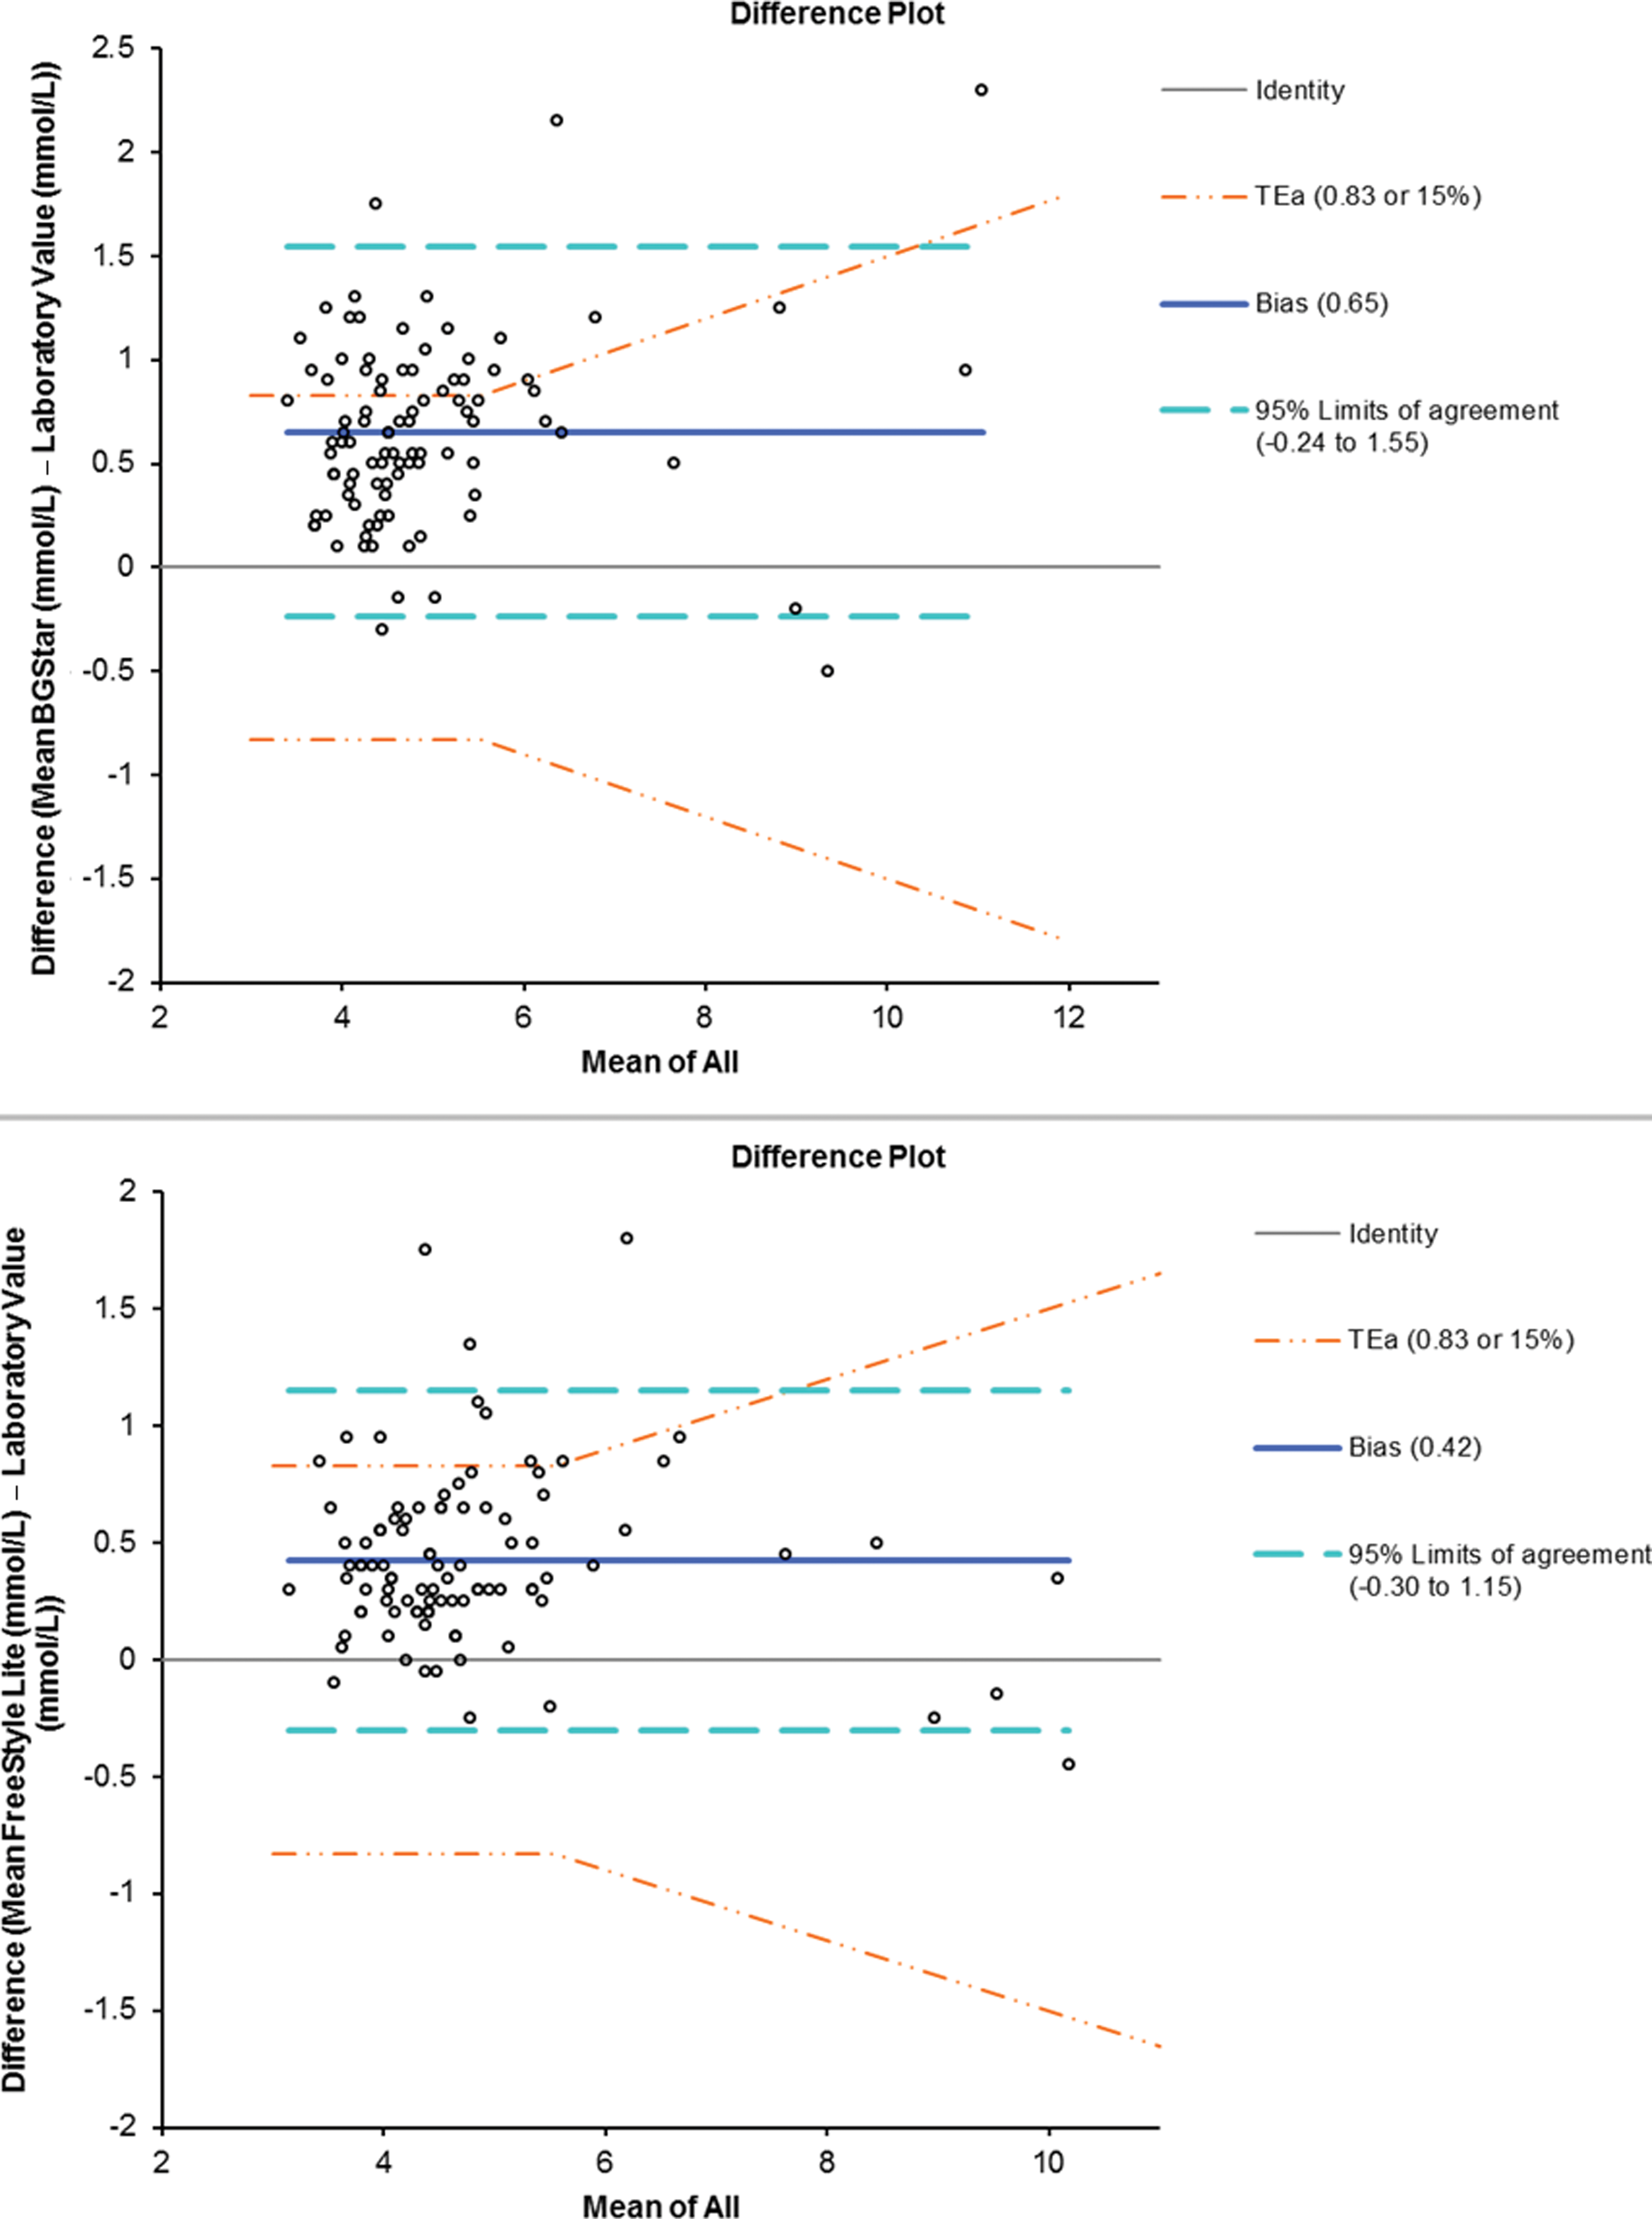
Bland–Altman analysis of concordance between blood glucose meter results and laboratory glucose values:
The study results were stratified based on a laboratory plasma glucose value of ≤4.2 mmol/L (46 samples) or >4.2 mmol/L (53 samples), in keeping with ISO guidelines. As highlighted in Table 2, the results obtained from the BGStar meter fulfilled ISO criteria for 62.5% of samples tested. Results from the FreeStyle Lite meter achieved the ISO standards for 85.4% of the samples tested. Both the BGStar and FreeStyle Lite meters were marginally more accurate at lower BGLs (≤4.2 mmol/L), with 65.9% and 88.6% of values being within 0.83 mmol/L of the laboratory result, respectively (FreeStyle Lite, P = 0.41; BGStar, P = 0.53). Overall, the BGStar did not perform as well as the FreeStyle Lite, but neither meter fulfilled the ISO 15197:2013 standards for blood glucose monitoring systems.
When analyzed using the Clarke Error Grid (Fig. 2), 66.7% of samples from the BGStar and 78.1% of samples from the FreeStyle Lite fell within Zone A, indicating that these results were within 20% of the laboratory plasma glucose value and would lead to appropriate clinical treatment. Furthermore, 12.5% of BGStar samples and 4.2% of FreeStyle Lite samples were found to be in Zone B, indicating that these results differed from the laboratory plasma glucose value by >20% but the difference would not impact on clinical decisions. Of the results, 17.7% from the FreeStyle Lite and 20.8% from the BGStar fell within Zone D, indicative of inaccurate results that may lead to a failure to detect and appropriately treat patients. No results from either meter were found to be within Zone E, where dangerous and inappropriate treatment decisions could occur.

Clarke Error Grid analysis of blood glucose meter results:
To eliminate the possibility that a delayed centrifugation and analysis (processing) time for plasma samples may lead to falsely low laboratory plasma glucose levels, the samples were stratified, depending on the time lag incurred between sample collection and laboratory testing. The time lag for each sample was divided into quartiles: 0–30 min (18%), 31–60 min (38%), 61–90 min (33%), and 91–120 min (11%) processing time. A longer processing time of >60 min for laboratory plasma glucose did not impact on the percentage of capillary blood glucose samples that fell within ISO 15197:2013 criteria (60.9% of BGStar samples and 85.4% of FreeStyle Lite samples). Similar results were found for samples that were processed in under 60 min (61.8% and 89.0%, respectively).
Effect of hematocrit on blood glucose meter accuracy
The mean hematocrit for study participants was 0.36 ± 0.03 L/L, with a range of 0.31–0.43 L/L. The effect of hematocrit on the accuracy of blood glucose meter measurements was assessed by determining the mean difference between capillary blood glucose meter results and laboratory plasma glucose values. Samples were then stratified based on a hematocrit level of <0.36 L/L or ≥0.36 L/L, in keeping with the study design of Perera et al. 17 The results demonstrate that haematocrit had no influence on the blood glucose values obtained from the BGStar and FreeStyle Lite blood glucose meters (P = 0.36 and P = 0.62, respectively; data not shown). To further investigate the possibility that hematocrit may be influencing blood glucose meter results in diabetes during pregnancy, the results were subdivided based on weeks of gestation. The average hematocrit level was no different for pregnancies of ≤28 weeks or >28 weeks. Thus, hematocrit at different stages of pregnancy (i.e., first and second trimester or third trimester) did not have an effect on the accuracy of the two meters, with no significant difference observed between the percentages of results falling within ISO 15197:2013 standards.
Discussion
In this prospective cohort study, we have evaluated the performance of the BGStar and FreeStyle Lite blood glucose meters at determining capillary BGLs in women with diabetes in pregnancy, in an outpatient antenatal clinic setting. Comparison of the blood glucose meter results with the gold standard laboratory plasma glucose values showed that neither the BGStar nor the FreeStyle Lite met ISO 15197:2013 standards for blood glucose monitoring systems. A positive bias was found for both meters, and the mean difference in glucose meter readings was 0.42 mmol/L for the FreeStyle Lite and 0.65 mmol/L for the BGStar. Furthermore, Clarke Error Grid analysis demonstrated that the majority of results obtained from both meters would lead to appropriate clinical action (correct treatment decisions, benign treatment decisions, or no difference in treatment).
The most recent ISO guidelines (ISO 15197:2013) for blood glucose monitoring systems stipulate a narrower range within which blood glucose meter results should fall, in order to satisfy acceptable levels of deviation from the laboratory value. 13 The percentage of samples fulfilling ISO 15197:2013 criteria was 62.5% and 85.4% for the BGStar and FreeStyle Lite blood glucose meters, respectively. Thus, in our study population, the BGStar did not perform as well as the FreeStyle Lite; however, neither meter met the 99% cutoff required by ISO 15197:2013. The precision of each meter was determined using repeated measures of control solution to determine the CV. The difference observed in precision for the meters could in part be responsible for the variation seen in performance of the meters, as the BGStar demonstrated a higher CV (4.54%), which may explain why fewer of the results obtained from this meter met ISO 15197:2013 standards, in comparison with the FreeStyle Lite (CV of 2.45%). Of note is that both meters demonstrated greater accuracy at lower BGLs, although this difference was not statistically significant. It is interesting that analysis of the blood glucose meter results using the previous ISO-15197 standards issued in 2003 24 showed that 76% of BGStar (ISO 15197:2003 vs. ISO 15197:2013, P = 0.04) and 91.7% of FreeStyle Lite (ISO 15197:2003 vs. ISO 15197:2013, P = 0.18) results met these criteria. Thus, both meters performed better under the less stringent ISO guidelines of 2003.
Clarke Error Grid analysis demonstrated that the majority of samples from both blood glucose meters studied fell within Zone A, indicating accuracy in comparison with the laboratory plasma glucose assay. Conversely, approximately one-fifth of results from the FreeStyle Lite and BGStar meters fell in Zone D, suggesting that a proportion of BGLs requiring treatment may be missed and not treated appropriately. This is in accordance with the observations of Perera et al., 17 as they similarly found that blood glucose meter results fell into Zones A–D, with no results in Zone E. The capillary blood glucose results that fell within Zone B (4.2% for FreeStyle Lite and 12.5% for BGStar) represent >20% variability from the laboratory plasma glucose value. Under nonpregnancy conditions, results within Zone B are unlikely to affect management of diabetes; however, in the context of diabetes in pregnancy, we cannot exclude the possibility that clinical decisions could be impacted. Overall, the results highlight that approximately 70% of samples tested by both meters would give rise to appropriate clinical treatment decisions.
This study was performed to supplement the results obtained by Perera et al., 17 where the performance of six blood glucose meters in diabetes in pregnancy was found to be suboptimal. The limits of agreement and bias observed for the FreeStyle Lite meter in the study by Perera et al. 17 were similar to those found in our cohort of samples. Conversely, a more recent study 16 found that the FreeStyle Lite meter was very accurate in diabetes during pregnancy, with 99% of samples meeting ISO 15197 criteria. The variance we observed may be explained by differences in methodology for processing venous samples or by user-dependent discrepancies. However, trained research staff carried out each of the capillary blood glucose tests, and analysis showed that venous plasma processing times did not impact on study results. To our knowledge, this is the first assessment of the BGStar blood glucose meter in the diabetes in pregnancy population.
The present study was carried out in a busy, functional outpatient clinic and so provides a real-world experience for interpreting the results of blood glucose meters. A pragmatic approach in study design was adopted to reflect current clinical practice, whereby the venous samples collected for blood glucose measurement were analyzed in the standard manner. This is different to the methods used in other studies, where venous blood samples were centrifuged within 5 min of collection 17 or centrifuged and analyzed in the laboratory in less than 30 min. 16 Analysis showed that our methodological approach did not have an effect on the interpretation of blood glucose meter performance. In addition, we found that hematocrit did not influence meter accuracy, suggesting that the performance of the meters observed in this study is not due to inaccurate glucose readings based on hemodilution associated with pregnancy. A limitation of this study is that a narrow range of BGLs was evaluated, and thus we were unable to assess meter accuracy in higher glucose ranges.
It is standard clinical practice in the management of diabetes in pregnancy for glucose targets to be based on capillary blood glucose measures. However, it is widely recognized that this process has limitations. 17,25 Based on this and other studies, the potential bias in capillary glucose measures using currently available meters should be noted. However, as the observed bias is small (0.42 mmol/L and 0.65 mmol/L, respectively), it is unlikely to cause inappropriate treatment decisions or lead to an increased risk of hypoglycemia when insulin therapy is initiated or up-titrated. Nonetheless, clinicians should consider these results when using these meters for the management of glycemic targets in diabetes in pregnancy.
Footnotes
Acknowledgments
We wish to thank Sanofi Australia and Abbott Australia for providing the blood glucose meters and blood glucose testing strips for use in this study. We would also like to acknowledge Ms. Carol Palmisano and Ms. Natalie Creak for aiding in participant recruitment at the gestational diabetes education sessions. Furthermore, we wish to thank Mr. Abdul Quayum for assistance with pathology specimen collection and facilitation of blood glucose meter testing. We acknowledge Jillian Patterson of the Biostatistics Department, University of Sydney, for assistance with the power calculation and advice on statistical analyses. Finally, we thank Pathology North (Northern Sydney) for intellectual contribution towards interpretation of the study data.
Author Disclosure Statement
No competing financial interests exist.
R.T.M. and V.C.D. recruited study participants, carried out study procedures, and collated and analyzed study data. S.J.G., V.A.P., and N.S. assisted with study participant recruitment and collation of study data. P.W. assisted with study data analysis and interpretation. S.L.H. and G.R.F. designed the study and guided study data interpretation. All authors contributed toward drafting the manuscript and approved the final version of the manuscript prior to submission.