
Abstract
Background:
Glucagon-like peptide-1 (GLP-1) is a powerful insulin secretagogue that is secreted in response to meal ingestion. The ability to quantify the effect of GLP-1 on insulin secretion could provide insights into the pathogenesis and treatment of diabetes. We used a modification of a model of GLP-1 action on insulin secretion using data from a hyperglycemic clamp with concomitant GLP-1 infusion. We tested this model using data from a mixed meal test (MMT), thereby measuring GLP-1-induced potentiation of insulin secretion in response to a meal.
Materials and Methods:
The GLP-1 model is based on the oral C-peptide minimal model and assumes that over-basal insulin secretion depends linearly on GLP-1 concentration through the parameter Π, representing the β-cell sensitivity to GLP-1. The model was tested on 62 subjects across the spectrum of glucose tolerance (age, 53 ± 1 years; body mass index, 29.7 ± 0.6 kg/m2) studied with an MMT and provided a precise estimate of both β-cell responsivity and Π indices. By combining Π with a measure of L-cell responsivity to glucose, one obtains a potentiation index (PI) (i.e., a measure of the L-cell's function in relation to prevailing β-cell sensitivity to GLP-1).
Results:
Model-based measurement of GLP-1-induced insulin secretion demonstrates that the PI is significantly reduced in people with impaired glucose tolerance, compared with those with normal glucose tolerance.
Conclusions:
We describe a model that can quantitate the GLP-1-based contribution to insulin secretion in response to meal ingestion. This methodology will allow a better understanding of β-cell function at various stages of glucose tolerance.
Introduction
E
A primary contributor to the incretin effect is the gut hormone glucagon-like peptide-1 (GLP-1). 4 –6 GLP-1 is a 30-amino acid peptide hormone secreted by L-cells, distributed in the region of the terminal ileum and colon. GLP-1 is derived from posttranslational processing of preproglucagon. Active isoforms of GLP-1 include GLP-1(7–36) amide and glycine-extended GLP-1(7–37). After secretion from enteroendocrine L-cells, the active forms of GLP-1 are rapidly inactivated by dipeptidyl peptidase-4 to its N-terminally truncated metabolite GLP-1(9–36), which does not have effects on glucose metabolism—at least in the postprandial period. 1,2,6 Recently GLP-1-based therapy has become part of the treatment of T2D. Therefore, the ability to quantify GLP-1 action on insulin secretion could provide insights into the pathogenesis of diabetes and perhaps help to individualize the treatment of T2D. 7
Several studies have attempted to describe and/or quantify the incretin effect. Mari et al. 8 introduced a potentiation factor into their secretion model to better describe the plasma C-peptide during an oral glucose test, by modulating the dose–response relationship between insulin secretion and glucose concentration. However, there was no description of the incretin effect and its relation with incretin hormones. Campioni et al. 9 assessed the incretin effect using the C-peptide minimal model proposed by Toffolo et al. 10 and calculating indices of responsivity of β-cells to glucose from both oral and i.v. glucose. The difference between oral and i.v. indices provided a quantification of the incretin effect. A similar approach was adopted by Tura et al. 11
More recently, Dalla Man et al. 12 proposed a mechanistic model of GLP-1 action on insulin secretion, which allows a simultaneous estimate of both β-cell responsivity indices to glucose and the ability of GLP-1 to enhance insulin secretion, using data obtained from a hyperglycemic clamp with concomitant exogenous infusion of GLP-1. This model also provides an index (Π) that quantifies the incretin effect due to GLP-1. However, the experimental methodology used by Dalla Man et al. 12 is not reflective of normal physiology and cannot be applied to large cohorts.
In normal physiologic conditions the potentiation of pancreatic insulin secretion is the result of both GLP-1's ability to enhance β-cell responsivity to glucose (GLP-1 sensitivity, Π) and the responsivity of L-cells to nutrients such as intraluminal glucose (L-cell responsivity, Λ) (Fig. 1). The methodology used by Dalla Man et al. 12 only provides a measure of Π in response to exogenous GLP-1. For these reasons, we examined whether it is possible to use a modification of the GLP-1 model proposed by Dalla Man et al. 12 to estimate β-cell responsivity to glucose and GLP-1 sensitivity, using data from a mixed meal test (MMT). We used glucose, C-peptide, and GLP-1 data measured in 62 subjects with different degrees of glucose tolerance undergoing an MMT. Paralleling the concept of the disposition index first proposed by Bergman et al., 13 Cobelli et al., 14 and Denti et al. 15 to assess β-cell function in relation to prevailing insulin sensitivity, we also introduced the concept of a potentiation index (PI), a measure of the L-cell's function in relation to prevailing GLP-1 sensitivity (Fig. 1).

A scheme of the glucose regulatory system. Glucose enters in the body though the gastrointestinal tract. When the plasma glucose level increases, β-cells secrete insulin (β-cells' responsivity [Φ] measures the ability of glucose to promote insulin secretion). Insulin is partially extracted by the liver (HE) and, with some delay, decreases the net hepatic glucose balance (NHGB) and stimulates glucose uptake (Rd) (insulin sensitivity [SI]). The disposition index (DI) is defined as the β-cells' responsivity in relation to SI. In addition, glucose absorption by the gut stimulates L-cell secretion of glucagon-like peptide-1 (GLP-1) (L-cells' responsivity [Λ] measures the ability of glucose to promote GLP-1 secretion). Finally, GLP-1 enhances the insulin secretion rate (β-cells' sensitivity to GLP-1 [Π] measures the ability of GLP-1 to promote insulin secretion). Like DI, the potentiation index (PI) is defined as the L-cells' responsivity in relation to GLP-1 sensitivity. ISR, insulin secretion rate; ID, insulin degradation, GLP1SR, secretion of GLP-1; GLP1D, GLP-1 degradation; RaM, meal glucose rate of appearance. (Color graphics available at
Materials and Methods
Data used here were generated from a separate study described in detail by Bock et al. 16 A brief description of subject characteristics and protocol design is reported below.
Subjects
After approval by the Mayo Institutional Review Board, subjects gave informed written consent prior to enrollment. Sixty-two white subjects (age, 53 ± 1 years; body mass index, 29.7 ± 0.6 kg/m2) were studied. All subjects were in good health and at a stable weight and did not engage in vigorous physical exercise.
Protocol
As previously reported, 16 subjects were studied on three occasions in random order when they underwent a standard oral glucose tolerance test (OGTT), a labeled MMT, and a euglycemic–hyperinsulinemic clamp. The OGTT data were used here only to classify subjects based on their glucose tolerance: normal glucose tolerance (NGT) (2-h plasma glucose level, <7.8 mmol/L; n = 25), impaired glucose tolerance (IGT) (2-h plasma glucose level between 7.8 and 11.1 mmol/L; n = 28), and T2D (2-h plasma glucose level >11.1 mmol/L; n = 9).
Prior to the MMT, all subjects were instructed to follow a weight-maintenance diet containing 55% carbohydrate, 30% fat, and 15% protein for at least 3 days before the study date. Subjects were admitted to the Mayo Clinical and Translational Science Activities-Clinical Research Unit at 1700 h on the evening before the study and ate a standard 10 kcal/kg meal (55% carbohydrate, 30% fat, and 15% protein) between 1830 and 1900 h. Subjects remained fasting overnight.
An 18-gauge cannula was inserted at 0600 h into a forearm vein for tracer infusions on the day of the study. Another 18-gauge cannula was inserted in a retrograde fashion in a dorsal hand vein of the opposite arm, and the hand was placed in a heated box (approximately 55°C) to enable sampling of arterialized venous blood. At time 0 (i.e., 1000 h) subjects ingested a standard mixed meal within 15 min, which consisted of three scrambled eggs, 55 g of Canadian bacon (or 47 g of steak), and gelatin containing 75 g of glucose, as previously described. 3,4 Plasma samples were collected at −180, −178, −170, −140, −100, −30, −20, −10, 0, 5, 10, 15, 20, 30, 40, 50, 60, 75, 90, 120, 150, 180, 210, 240, 280, 300, and 360 min, and plasma glucose, insulin, C-peptide, and GLP-1 concentrations were measured with standard assays (Fig. 2).

Plasma
Plasma samples were placed on ice, centrifuged at 4°C, separated, and stored at −80°C until assayed. Glucose concentrations were measured using a glucose oxidase method (Yellow Springs Instruments, Yellow Springs, OH). Plasma insulin was measured using a chemiluminescence assay (Access Assay; Beckman, Chaska, MN). Plasma glucagon and C-peptide were measured by radioimmunoassay (Linco Research, St. Louis, MO). Collection tubes for GLP-1 had 100 μM dipeptidyl peptidase-4 inhibitor (Linco Research) added. Total GLP-1 concentrations were measured at the time of the original experiments (as was the case for glucose, insulin, and C-peptide) using a C-terminal assay as previously described. 17
Minimal model of C-peptide secretion and kinetics
The GLP-1 model proposed by Dalla Man et al. 12 (hereafter referred to as the i.v. GLP-1 model) is based on the C-peptide minimal model, originally proposed by Toffolo et al. 10 for i.v. glucose graded infusion and then used also during an oral test 18 to describe C-peptide secretion as function of glucose and glucose rate of change. The pancreatic C-peptide secretion rate (SR) is linked to plasma C-peptide concentration by the two-compartment model of C-peptide kinetics originally proposed by Eaton et al. 19 :
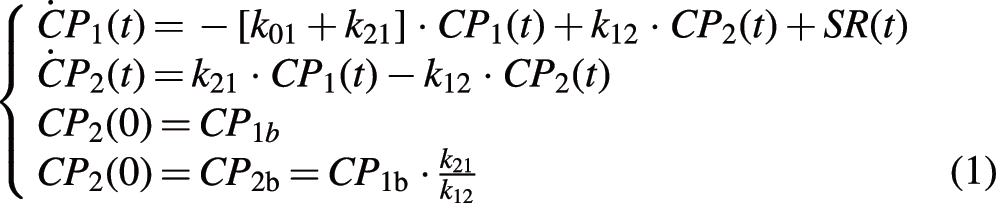
where CP
1 and CP
2 (pmol/L) are C-peptide concentrations in the accessible and peripheral compartments, respectively, and k
12 and k
21 (min−1) (the transfer rate parameters between compartments) and k
01 (min−1) (the irreversible loss) are the C-peptide kinetic parameters, fixed to standard values
20
to assure numerical identification of the overall model. The model also assumes that SR is made up of a basal (SR
b), a static (SR
s) and a dynamic (SR
d) component:
SR
b can be derived from steady-state constraint:
SR
s is assumed to be equal to the provision of releasable insulin to β-cells, controlled by glucose concentration above a threshold level h:
that is, the static secretion component is linearly related, through parameter Φs, to delayed glucose concentration above a threshold h, with a time delay equal to 1/α. Φs is the static β-cell responsivity to glucose and measures the ability of glucose to stimulate SR s.
SR
d represents the secretion of insulin stored in β-cells in a promptly releasable form and is proportional to the glucose rate of increase:
where Φd is the dynamic β-cell responsivity to glucose and measures the ability of glucose rate of change to stimulate SR d.
The over-basal insulin secretion (ΔSR) is thus:
The oral model of GLP-1 action on C-peptide secretion
The oral GLP-1 model is derived from the already published i.v. GLP-1 model
12
and shares with it the assumption that GLP-1 acts only on over-basal insulin secretion, whereas there is no effect on basal secretion.
1,12
As in Dalla Man et al.,
12
we first tested a model where the GLP-1 action was proportional to both GLP-1 concentration and its rate of change. However, at variance with Dalla Man et al.,
12
during MTT the parameter governing the control of GLP-1 derivative on β-cell secretion always collapsed to 0. Thus, here we simplified the model and hypothesized that ΔSR is linearly modulated by GLP-1, through the GLP-1 sensitivity index Π (% per pmol/L):
where GLP1(t) is the above-basal intact hormone concentration.
According to Dalla Man et al., 12 Π quantifies the ability of GLP-1 to enhance the over-basal insulin secretion and is defined as the ratio between the average percentage increase in over-basal insulin secretion and average GLP-1 plasma concentration.
Model identification was performed in one step (i.e., all model parameters [those describing β-cell responsivity to glucose and that describing β-cell sensitivity to GLP-1] are estimated simultaneously from C-peptide concentration, using GLP-1 and glucose measurement as forcing functions).
Assessment of L-cell responsivity to glucose
A good measure of GLP-1 secretion is represented by the area under the above basal (intact) GLP-1 concentration (AUCGLP-1). In addition, because in this experiment all subjects ingested the same meal (both same composition and amount carbohydrates), the (AUCGLP-1) is also a marker of L-cell responsivity to a mixed meal (Λ).
The concept of PI
Paralleling the concept of disposition index proposed by Bergman et al.,
13
Cobelli et al.,
14
and Denti et al.
15
to assess β-cells' function in relation to prevailing insulin sensitivity, we introduce here the new concept of PI, a measure of L-cells' function in relation to prevailing GLP-1 sensitivity (Fig. 1). In other words, at least in principle, a subject may present a defect in postprandial insulin secretion either because GLP-1 is unable to properly stimulate β-cells, because GLP-1 secretion is inadequate, or because of both. If, as for insulin sensitivity and β-cell responsivity, a hyperbolic relationship between Π and Λ exists in a given population, then PI can be defined as:
with PI and x estimated using a total least square algorithm, as described by Denti et al.
15
This PI represents the population value of the PI. However, an individual value can also be calculated in each subject (e.g., by assuming x = 1):
with N number of subjects in the database (as many authors usually do for calculating the disposition index from insulin sensitivity and β-cell responsivity to glucose).
Parameter estimation
The model was numerically identified on C-peptide data by nonlinear least squares, 21 implemented in MATLAB™ (release 2012; The MathWorks, Natick, MA). Error on C-peptide data was assumed to be independent, Gaussian, and with zero mean and known variance. 22 Glucose and GLP-1 concentrations are the model-forcing functions, assumed to be known without error.
Statistical analysis
Data are presented as mean ± SE values. An analysis of variance test was performed to compare groups; post hoc analysis was done using the unpaired t test. Values of P < 0.05 were considered statistically significant. Pearson's correlation coefficient was used to assess the association between variables.
Results
Model prediction and estimates of parameters
Figure 3A shows the average oral GLP-1 model prediction of C-peptide against average C-peptide data concentration: the oral GLP-1 model well describes C-peptide data in all subjects. Average estimated model parameters are reported in Table 1 with their precisions.

Data are mean ± SE values (percentage coefficient of variation).
NGT, normal glucose tolerance; IGT, impaired glucose tolerance; T2D, type 2 diabetes.
Indices of β-cell responsivity to glucose and the GLP-1 sensitivity index Π were estimated with good precision in all subjects. In particular, Φd was lower in T2D than in both IGT and NGT subjects (T2D, 215.26 ± 72.67 · 10−9; IGT, 476.78 ± 57.13 · 10−9 [P = 0.004]; NGT, 491.89 ± 72.21 · 10−9 [P = 0.01]), Φs was similar in all groups (T2D, 21.53 ± 2.39·10−9 · min−1; IGT, 27.18 ± 2.20 · 10−9 · min−1; NGT, 23.96 ± 2.61 · 10−9 · min−1), and Π was slightly, but not significantly (P = 0.08), higher in NGT than IGT (T2D, 4.44 ± 2.72% per pmol/L; IGT, 2.78 ± 0.63% per pmol/L; NGT, 4.77 ± 0.90% per pmol/L) (Fig. 3B, upper left panel).
L-cell responsivity and PI
Λ [here calculated as AUC(GLP_1)] was significantly lower in T2D than in NGT subjects and lower but not significantly in T2D than in IGT subjects (T2D, 3,345.00 ± 818.52 pmol/L · min; IGT, 5,431.48 ± 974.96 pmol/L · min [P = 0.06]; NGT, 5,577.20 ± 541.88 pmol/L · min [P = 0.02]) (Fig. 3B, upper right panel).
The individual value of PI, calculated with Eq. 9, was significantly higher in NGT than in both IGT and T2D subjects (NGT, 20,341.69 ± 2,970.64% · min; IGT, 11,105.89 ± 2,329.76% · min [P = 0.02]; T2D, 7,768.33 ± 2,294.86% · min [P = 0.001]) (Fig. 3B, lower panel). PI also shows a significant inverse correlation with the degree of glucose tolerance, measured by the plasma glucose value at t = 2 h: R = −0.3317, P = 0.0085.
The population PI was also calculated from Eq. 8 in the three groups and was significantly higher in NGT than in IGT and T2D subjects (NGT, 12,873 ± 3,923% · min; IGT, 4,078 ± 1,004% · min [P < 0.05]; T2D, 2,953 ± 1,333% · min [P < 0.05]), and x was significantly higher in NGT than in IGT subjects (NGT, 1.08 ± 0.19; IGT, 0.47 ± 0.17 [P < 0.05]) (Fig. 4).

Responsivity of L-cells to glucose (Λ) versus sensitivity of β-cells to glucagon-like peptide-1 (Π) in normal glucose tolerance (NGT) (white circles), impaired glucose tolerance (IGT) (gray circles), and type 2 diabetes (T2D) (black circles) subjects. A hyperbolic relationship between Λ and Π has been demonstrated in the three populations (NGT, dashed line; IGT, dashed-dotted line; T2D, continuous line).
Discussion
The observation that enteral nutrition results in a higher insulinotropic stimulus if compared with isoglycemic i.v. challenge has led to the development of the incretin concept. GLP-1 is a potent insulin secretagogue hormone that plays an important role in mediating the incretin effect. 1 –5,23,24 Because GLP-1-based therapy is become part of the treatment of T2D, the ability to quantify the GLP-1 action on insulin secretion could provide insights into the pathogenesis and treatment of diabetes. Several different approaches have been recently proposed to indirectly measure the incretin effect (e.g., by introducing a potentiation factor that modulates the dose–response relationship between insulin secretion and glucose concentration in order to achieve a better fit of plasma C-peptide concentrations 8 or by comparing the insulin secretion profiles during oral and glucose-matched i.v. challenge, reconstructed by using the minimal model of C-peptide secretion and kinetics 9,11 ). However, none of the above-cited methodologies provides a direct measure of the ability of GLP-1 to potentiate insulin secretion.
Dalla Man et al. 12 tested four models, of increasing complexity, describing GLP-1 action on insulin secretion against C-peptide data from an hyperglycemic clamp with a concomitant two-step GLP-1 i.v. infusion, which brought the hormone concentration first to physiological and then to supraphysiological concentrations. Among the four, the most parsimonious model was selected using standard criteria. This was based on the C-peptide minimal model 18 to describe insulin secretion at basal GLP-1 concentration and assumes that GLP-1 acts only on over-basal insulin secretion, whereas there is no effect on basal secretion; it also assumes that GLP-1 action is proportional to both GLP-1 concentration and its rate of change.
The GLP-1 model selected by Dalla Man et al. 12 can assess GLP-1 potentiation during hyperglycemic clamp and exogenous GLP-1 i.v. infusion in healthy individuals. However, it is of great interest to estimate β-cells' responsivity to glucose and sensitivity to GLP-1 with a model able to interpret data of a more physiological test, such as a meal, and to see if the method is applicable to IGT subjects and people with T2D. Therefore, we adapted the i.v. GLP-1 model to examine MMT data. The resulting model assumes that the over-basal insulin secretion is linearly modulated by GLP-1 through the GLP-1 sensitivity index Π, which quantifies the percentage increase of over-basal insulin secretion due to a 1 pmol/L increase in level of circulating GLP-1.
The oral GLP-1 model predicts the C-peptide concentration data and provides precise estimates of all model parameters, including Π (coefficient of variation of 43 ± 4%, with the higher value being for the T2D subjects). It is interesting to note that the sensitivity index Π provided by the oral GLP-1 model, in the NGT group, was lower compared with the sensitivity index Πiv calculated by Dalla Man et al. 12 (4.8 ± 0.9 vs. 12.6 ± 0.7% per pmol/L); such a difference could in part be explained by the fact that the NGT subjects in this study were matched for age and body mass index with IGT and T2D subjects (age, 53 ± 1 years; body mass index, 29.7 ± 0.6 kg/m2), whereas in Dalla Man et al. 12 subjects were younger and leaner (age, 26 ± 1 years; body mass index, 24.9 ± 0.4 kg/m2). This would imply that age and body mass index may have a role in determining β-cell sensitivity to GLP-1, as already reported in prior studies suggesting consistently decreased responses to multiple secretagogues with increasing age. 25 Nevertheless, this will require testing in future studies.
However, it is also possible that during an oral test the model underestimates the actual GLP-1 sensitivity because total instead of active GLP-1 concentrations were used (given that active GLP-1 is rapidly degraded, measurement of total GLP-1 concentrations is a better reflection of endogenous GLP-1 secretion). This aspect also needs further study. Additional studies are needed to assess model performance in nonwhite populations, also enlarging the T2D group, to better understand the mechanisms underlying the deficiency in incretin potentiation observed in T2D. Finally, further studies are also needed to validate the model using oral and intravenously infused glucose-matched data and in the presence and absence of a competitive antagonist of GLP-1 at its cognate receptor.
This model is superior to other methods of the literature in several aspects. For instance, the method recently proposed by Tura et al. 11 was designed to analyze the OGTT and i.v. matched test simultaneously, whereas here the potentiation is estimated from a single MTT. Also, Tura et al. 11 did not attempt to mechanistically describe the action of incretin hormones on insulin secretion or to quantify the sensitivity of β-cells to incretins. They simply estimate a potentiation time course, but, as also recognized by the authors, the correlation between the estimated incretin potentiation and GLP-1 was significant in a small percentage of the subjects.
The potentiation of insulin secretion depends not only on how well β-cells respond to the GLP-1 potentiation (Π), but also on how much GLP-1 is secreted by the L-cells in response to an enteral caloric stimulus (here called L-cell responsivity [Λ]). Thus, paralleling the concept of disposition index proposed by Bergman et al., 13 Cobelli et al., 14 and Denti et al. 15 to assess β-cell function in relation to prevailing insulin sensitivity, the PI is a measure of L-cell function in relation to prevailing GLP-1 sensitivity (Fig. 1). This new index can be calculated either at the single individual level, as the product between individual Π and Λ, or at the population level, by adopting a method similar to that proposed by Denti et al. 15 In both cases our results show that PI is significantly impaired in both IGT and T2D subjects. On the other hand, as already observed, Π is not significantly different in NGT than in IGT and T2D subjects, but, as discussed above, this could also be due to the fact that in this particular database, Π is already lower than expected in our NGT subjects. Conversely, Λ is similar in IGT and NGT subjects but significantly lower in T2D subjects. We could thus speculate that Π decreases first in obese and IGT individuals but that L-cells continue to normally secrete the hormone; however, when the T2D is established, L-cells are unable to maintain the required secretion rate, and the potentiation of insulin secretion is markedly reduced.
On the other hand, it must be noted that GLP-1 secretion has not been shown to be consistently defective in people with T2D before; thus this finding must be confirmed in future studies. Also, the pattern of postprandial GLP-1 secretion likely reflects the appearance of calories in the intestine—a rate that is affected by gastric emptying—thus, the particular meal composition may affect the results. A limitation of this study is that we only analyzed the GLP-1-induced insulin secretion, neglecting the effect of other incretins (e.g., gastric inhibitory polypeptide). However, it is also widely recognized that GLP-1 is the incretin hormone that functions as the main incretin hormone. Another possible limitation of this study is that we did not derive the GLP-1 secretion with a mathematical model, but simply as the area under the above basal intact GLP-1 concentration. However, we believe that such index is a reasonable marker of GLP-1 secretion.
In summary, the i.v. GLP-1 model proposed by Dalla Man et al. 12 has been first simplified and used to assess Π from data of a meal test. Coupling the estimate of this model with a measure of GLP-1 secretion allows us to better understand the pathogenesis of T2D and provides insight into its treatment based on GLP-1 therapies.
Footnotes
Acknowledgments
This study was supported by the Ministero dell'Università e della Ricerca Scientifica e Tecnologica, Italy (grant FIRB 2008) and grants DK82396 and DK78646 from the National Institutes of Health. The authors thank Dr. Paolo Denti (University of Cape Town) for his support in the use of the total least square algorithm.
Author Disclosure Statement
No competing financial interests exist.
C.D.M. conceived the model and wrote the manuscript. F.M. helped in model development and analyzed the data. M.S. and A.V. contributed to the discussions. A.V and C.C. reviewed/edited the manuscript. C.C. is the guarantor and takes full responsibility for this work.