
Abstract
Background:
The Food Insulin Index (FII) is a novel algorithm for ranking foods based on their insulin demand relative to an isoenergetic reference food. We compared the effect of carbohydrate counting (CC) versus the FII algorithm for estimating insulin dosage on glycemic control in type 1 diabetes.
Materials and Methods:
In a randomized, controlled trial, adults (n = 26) using insulin pump therapy were assigned to using either traditional CC or the novel Food Insulin Demand (FID) counting for 12 weeks. Subjects participated in group education and individual sessions. At baseline and on completion of the trial, glycated hemoglobin A1c (HbA1c), day-long glycemia (6-day continuous glucose monitoring), fasting lipids, and C-reactive protein were determined.
Results:
Changes in HbA1c from baseline to 12 weeks were small and not significant in both groups (mean ± SEM; FII vs. CC, −0.1 ± 0.1% vs. −0.3 ± 0.2%; P = 0.855). The incremental area under the curve following breakfast declined significantly among the FID counters with no change in the CC group (FID vs. CC, −93 ± 41 mmol/L/min [P = 0.043] vs. 4 ± 50 mmol/L/min [P = 0.938]; between groups, P = 0.143). The mean amplitude of the glycemic excursion (MAGE) was significantly reduced among the FID counters (FID vs. CC, −6.1 ± 1.0 vs. −1.3 ± 1.0 mmol/L; P = 0.003), and only the FID counters experienced a trend (−44% vs. +11%; P = 0.057) to reduced hypoglycemia.
Conclusions:
In a 12-week pilot study, MAGE and postprandial glycemia following breakfast were significantly improved with FII counting versus CC, despite no significant differences in HbA1c.
Introduction
P
Carbohydrate counting (CC) is frequently recommended as routine therapy for patients with type 1 diabetes. However, numerous studies in healthy subjects have demonstrated that the same amount of carbohydrate from different food sources produces wide variations in blood glucose and insulin responses. 4 –7 Furthermore, studies in vitro and in vivo have demonstrated the significant role of protein and fat in addition to carbohydrate on normal physiological insulin secretion. 8 –10 A more comprehensive understanding of the relationship between dietary factors, such as macronutrient and fiber contents, and physiological insulin secretion evoked by foods is likely to improve clinical and practical outcomes in the management of type 1 diabetes.
The Food Insulin Index (FII) is a novel algorithm of ranking foods based on the insulin response (“demand”) in healthy subjects relative to an isoenergetic reference food. 11 The algorithm uses food energy as the constant, and thus all dietary components and their metabolic interactions can be considered for any food with sufficient energy density, allowing a holistic approach to determining insulin demand. Previous studies in healthy people have demonstrated that the FII algorithm is a more accurate predictor of observed insulin responses to composite meals than carbohydrate content. 12 In individuals with type 1 diabetes, the FII algorithm was associated with improved postprandial glycemia without increased risk of hypoglycemia compared with CC. 13 The FII algorithm can theoretically be integrated into clinical practice by counting “units” of insulin demand per serving in the same way that carbohydrate is counted.
The Food Insulin Demand (FID) is a formula for translating the relative FII values into units proportional to the food portion's energy content (FID = FII × kJ per serving/1,000). The FID allows a mealtime insulin dose to be calculated based on the FII of the food (or foods) to be consumed and the actual portion size. Prandial insulin doses are then determined using an individualized insulin:FID ratio akin to that applied when using the insulin:carbohydrate ratio (ICR). However, whether estimating prandial insulin doses using FID counting is feasible in practice and is beneficial for glycemic control has not been investigated.
Our aim was to compare the use of CC versus FID counting for estimating insulin dosage on postprandial glycemia in adults with type 1 diabetes over 12 weeks. This was the first study to apply the FII to a chronic feeding situation.
Materials and Methods
In this randomized, controlled, parallel design pilot study, we compared traditional CC with FID counting for estimating insulin dosage on postprandial glycemia in adults with type 1 diabetes over a 12-week period. Twenty-six adults with type 1 diabetes using insulin pump therapy were recruited through the Sydney Insulin Pump Clinic, a private endocrinology clinic in Sydney, Australia. Eligibility criteria included the following: between 18 and 70 years of age; type 1 diabetes diagnosed for ≥1 year; use of insulin pump therapy for at least 3 months; HbA1c between 7.0% and 9.5% (53–80 mmol/mol); and reliably performing self-monitoring of blood glucose at least four times daily. Suboptimal glycemic control, assessed by HbA1c, was required for eligibility as this study aimed to improve control. Exclusion criteria included food allergies, intolerances, or eating disorders, as well as use of other medication that may influence blood glucose. The protocol was approved by the Human Research Ethics Committee of the University of Sydney.
Subjects were randomly allocated one of two methods of estimating their mealtime insulin doses: traditional CC or the FID counting. Randomization was achieved through a computer-generated randomization table and the use of opaque sealed envelopes. The allocation sequence was concealed from patients and investigators until the commencement of the trial.
Subjects participated in a 2-h interactive group education workshop with the research dietitian. This workshop covered the principles of the allocated method, awareness of foods to be counted and orientation to the carbohydrate or FID values of common foods, and instruction on calculating mealtime insulin doses. Participants were given workshop manuals, pictorial booklets, and pocket-sized guides and given access to a Web site and an iPhone® (Apple, Cupertino, CA) application to assist with their “counting” and dose calculations. These resources were all designed to be as similar as possible with only key information and numerical food values being different. In the case of foods not included in the materials, participants in both groups were instructed to use the value of a food with a similar nutrient composition (e.g., the FID/carbohydrate value for an apple could be used to estimate the value for a pear) and were encouraged to contact the research dietitian if assistance was required.
During the first education session, subjects were asked to record a 24-h food recall, to identify the carbohydrate content or FID of their meals and snacks using the resources provided, and to practice estimating the portion sizes and corresponding carbohydrate content/FID of self-served, common, real foods, such as rice, pasta, milk, juice, cereal, and, in the case of FID counters, meats. At the conclusion of the workshop, the FID counters had their individualized ICR converted to an insulin:FID ratio (IFR) to allow the calculation of insulin doses. The IFR was calculated by scaling the usual ICR by a factor of 1.7 (1.7 = 100 divided by 59 = FII of 1,000 kJ of glucose divided by grams of carbohydrate in 1,000 kJ of glucose). For example, an ICR of 1 unit:10 g of carbohydrate became an IFR of 1 unit:17 FID. In this way, the IFR automatically adjusted for differences in insulin sensitivity among subjects. No changes were made to the ICR of the carbohydrate counters. Changing the IFR also promoted adherence to FID counting because patients could not default to counting carbohydrate. Telephone and e-mail support was offered to both groups, and all participants received a follow-up e-mail each week throughout their intervention.
In the week following their group education workshop, subjects completed a food diary and recorded their carbohydrate/FID estimations and blood glucose levels. At the end of the week, they attended a 30-min follow-up individual appointment with the research dietitian to review their food diary and estimations, discuss estimations for other food preferences, and individualize the information provided in the group workshop.
During the week prior to the study and then again after the 12-week intervention, subjects wore a continuous glucose monitoring system (iPro™2; Medtronic, Northridge, CA) for 6 consecutive days to capture glycemic control. HbA1c, blood lipids, and C-reactive protein were measured at baseline and the end of the study to assess average glycemic control, lipid metabolism, and low-grade chronic inflammation.
Statistical analysis
A sample size of 38 subjects was calculated to provide 80% power to detect a 0.3% point difference in HbA1c between carbohydrate and FID counting, assuming an SD of 0.32 mmol/L. Because a planned interim analysis after 25 subjects had completed the trial revealed no clinically or statistically significant difference in HbA1c between the groups, the pilot study was terminated at this point to avoid unnecessary burden on patients.
Data were analyzed using the SPSS statistical package version 21 (SPSS Inc., Chicago, IL). Changes in the following measures of glycemic control between baseline and 12 weeks were analyzed using independent-sample t tests between groups and paired t tests within groups: (1) HbA1c, (2) mean blood glucose level, (3) SD in blood glucose level, (4) mean amplitude of glycemic excursions (MAGE) (average difference in blood glucose excursions exceeding 1 SD of the mean blood glucose value), (5) percentage of time within low (<3.9 mmol/L), normal (3.9–7.8 mmol/L), and high (>7.8 mmol/L) blood glucose ranges, (6) number of hyperglycemic and hypoglycemic episodes, (7) average incremental area under the curve (iAUC) for breakfast postprandial blood glucose levels over 120 min, (8) iAUC above target (10 mmol/L) for breakfast postprandial blood glucose levels over 120 min, and (9) peak postprandial breakfast blood glucose level over 120 min. Breakfast postprandial glycemia was identified from the 6-day continuous glucose monitoring system output.
For each subject, the mean of every tagged breakfast meal with at least 120 min of blood glucose data available and not confounded by another meal, exercise, or correction dose was calculated. The final group mean was calculated from the mean of each individual subject. This method ensured that the final results were not biased by the number of tagged breakfast meals available for each subject and that each subject had equal weight in the final analysis. Differences in coefficients were considered statistically significant if P was <0.05, as well as highly significant if P was <0.01 (two-tailed).
For subjects who withdrew, available baseline measures were carried forward for analysis.
Participant characteristics are presented as mean ± SD. All other results are presented as mean ± SE.
Results
A total of 26 adults responded to recruitment notices and met the inclusion criteria between January and September 2013. Of these, 14 were randomized to FID counting, and 12 were randomized to CC (Fig. 1). Twenty-two subjects completed all testing sessions (10 men, 12 women), with four subjects withdrawing because of work commitments. Two of these subjects (one from each arm) withdrew prior to completing all baseline measures and therefore could not be included in the intention-to-treat analysis, whereas two subjects (one from each arm) withdrew following the group education session. For all four withdrawn subjects, any available baseline measures were carried forward to 12 weeks. The final sample size included in each analysis is reported in the tables and figures. Subject characteristics are shown in Table 1. Mean age, body mass index, and baseline HbA1c were similar in each group.

Flow of subjects through the study. Carb, carbohydrate; FID, Food Insulin Demand.
Data are mean ± SD values.
Carbohydrate counters, n = 11; Food Insulin Demand (FID) counters, n = 13.
BG, blood glucose; BMI, body mass index; HbA1c, glycated hemoglobin A1c.
The mean HbA1c value was higher in the CC group at baseline compared with the FID counters, although the difference was not statistically significant (FID vs. CC, 8.1 ± 0.2 vs. 8.6 ± 0.3; P = 0.112). Changes in HbA1c after 12 weeks of intervention were not different between the groups (FID vs. CC, −0.1 ± 0.1% vs. −0.3 ± 0.2%; P = 0.31) (Fig. 2).
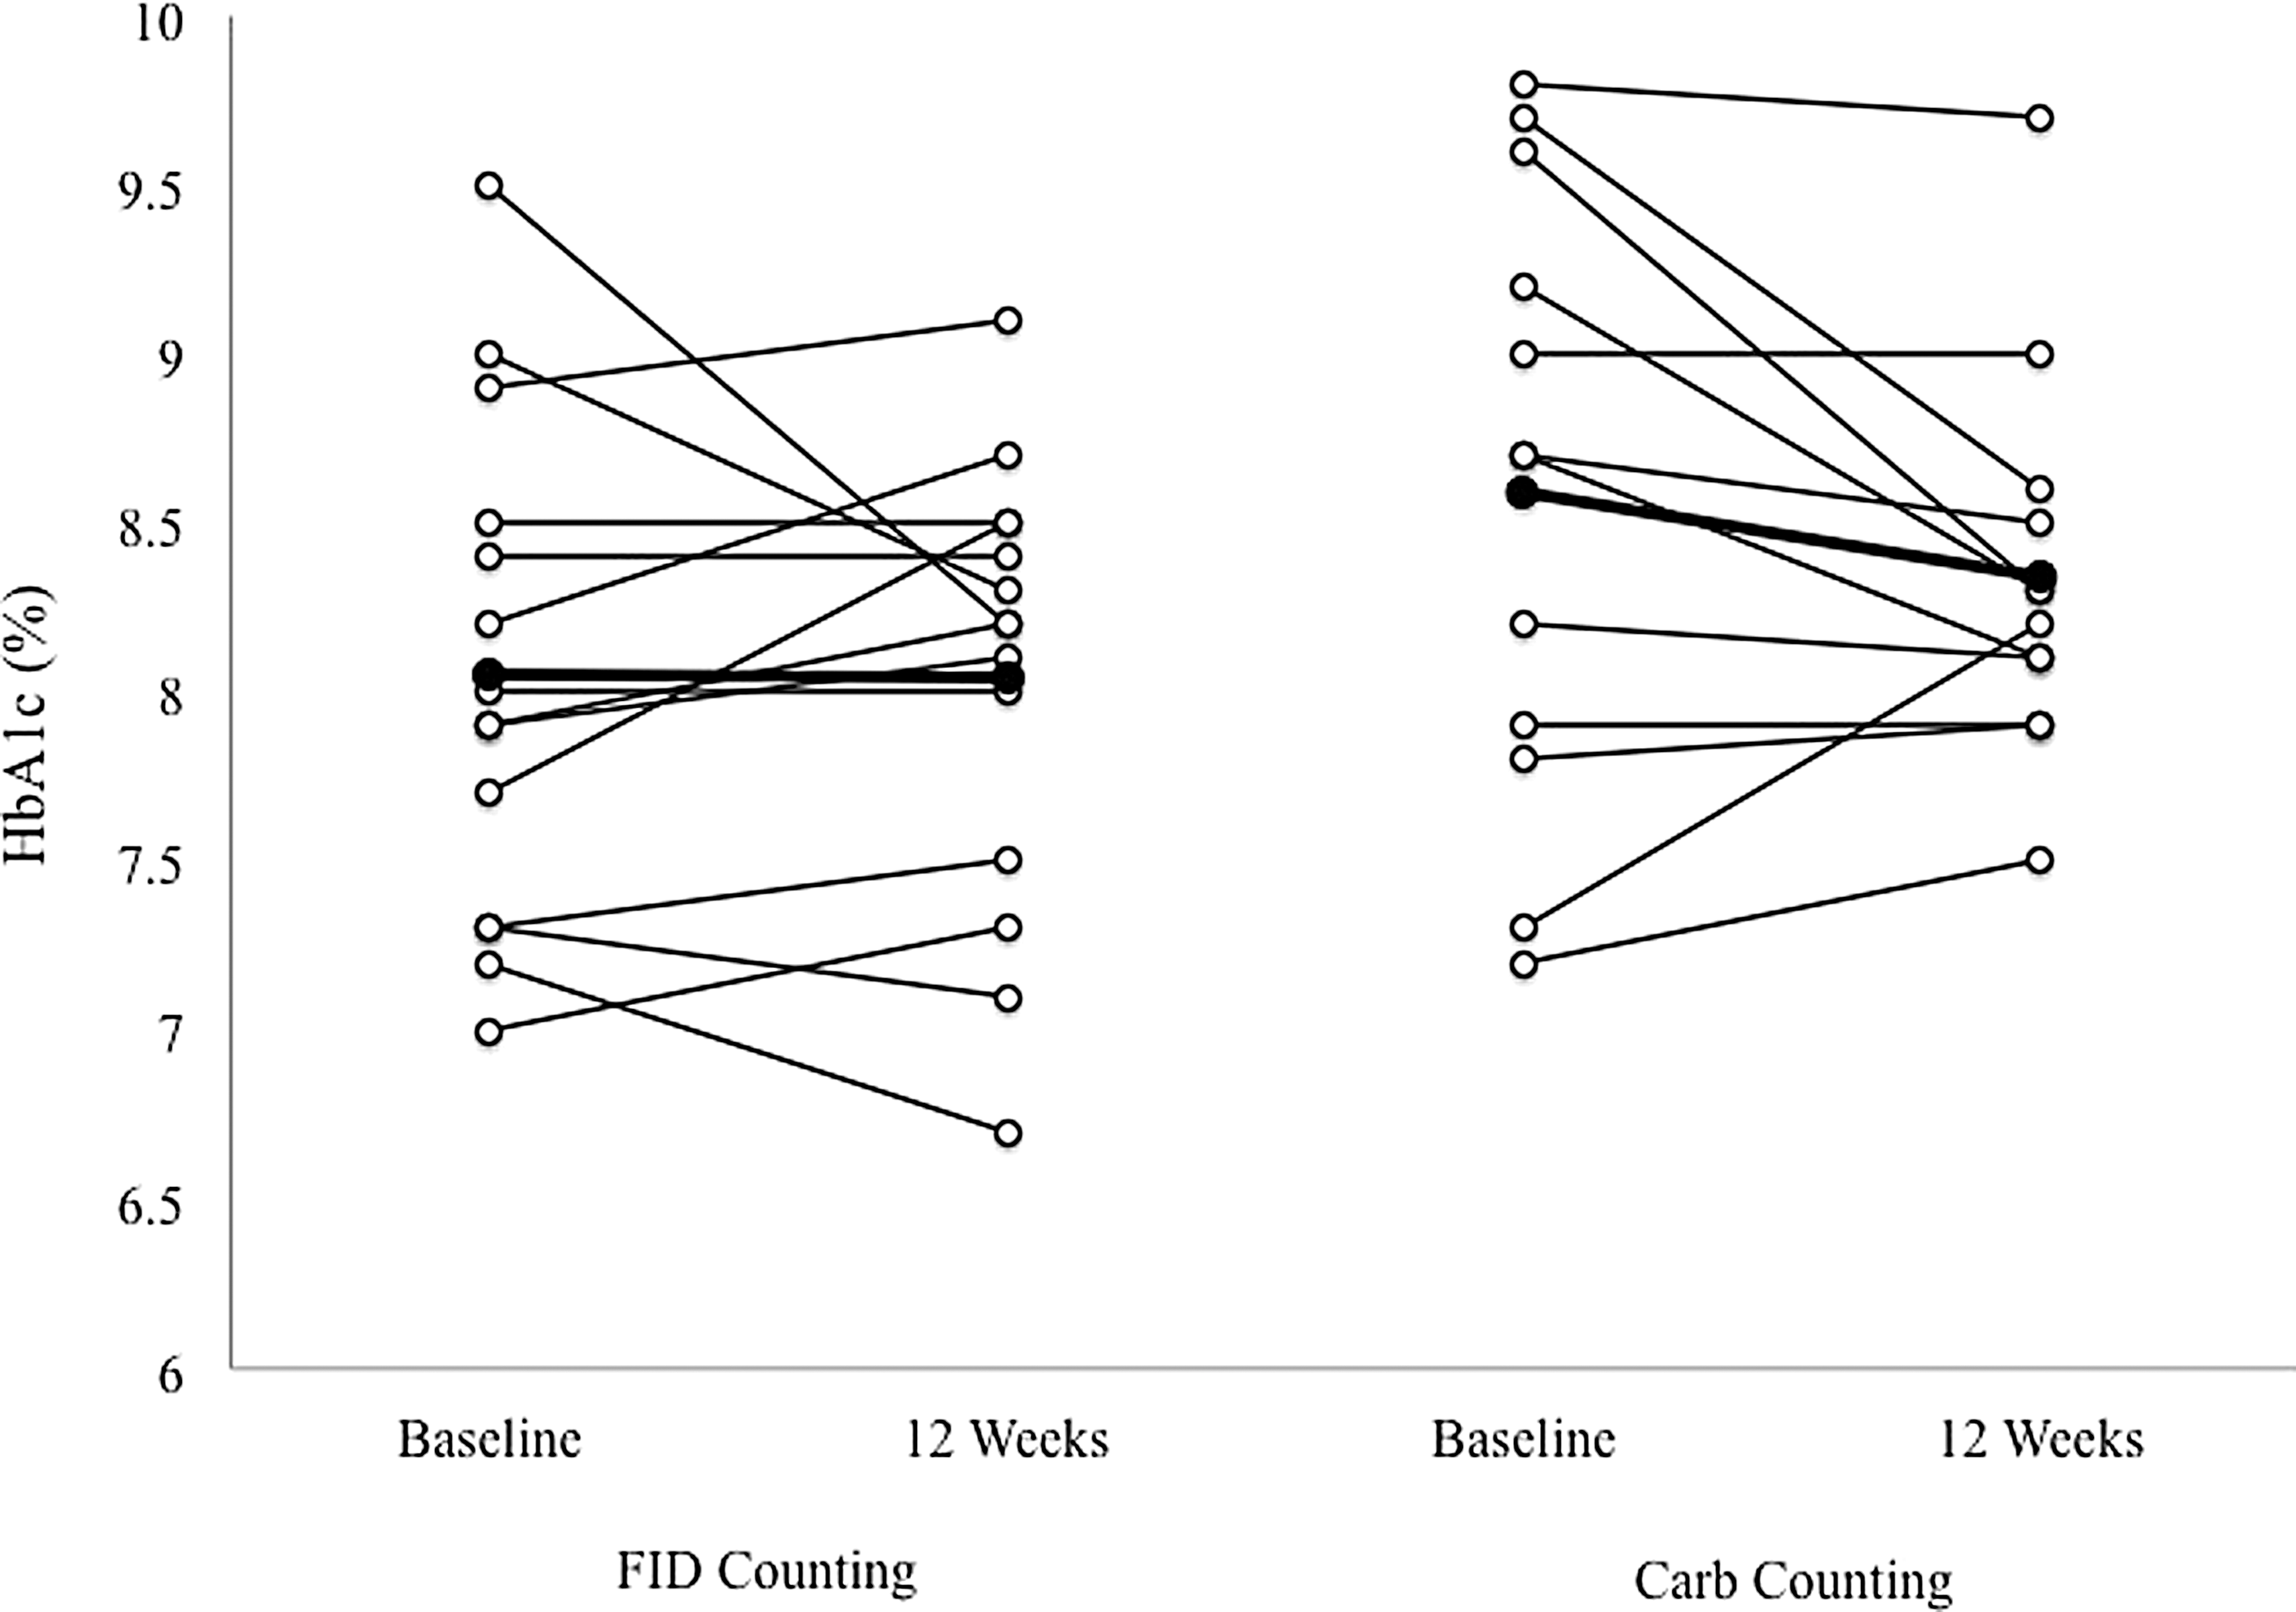
Changes in glycated hemoglobin A1c (HbA1c) over a 12-week period in adults with type 1 diabetes using either Food Insulin Demand (FID) counting (n = 14) or traditional carbohydrate (Carb) counting (n = 12) for estimating mealtime insulin doses. Group means are given in in bold.
Glycemic control as judged by 6-day continuous glucose monitoring is summarized in Table 2. There were no significant differences in the fasting blood glucose level at baseline or 12 weeks within or between groups. The SD around the mean blood glucose levels was similar in both groups, but MAGE was significantly reduced among the FID counters (FID vs. CC, −6.1 ± 1.0 mmol/L vs. −1.3 ± 1.0 mmol/L; P = 0.003) (Fig. 3). The 120-min iAUC following breakfast was significantly reduced among the FID counters (−93 ± 41 mmol/L/min; P = 0.043), whereas there was no change in the CC group (4 ± 50 mmol/L/min; P = 0.938). There was no difference between groups at 12 weeks (P = 0.143).
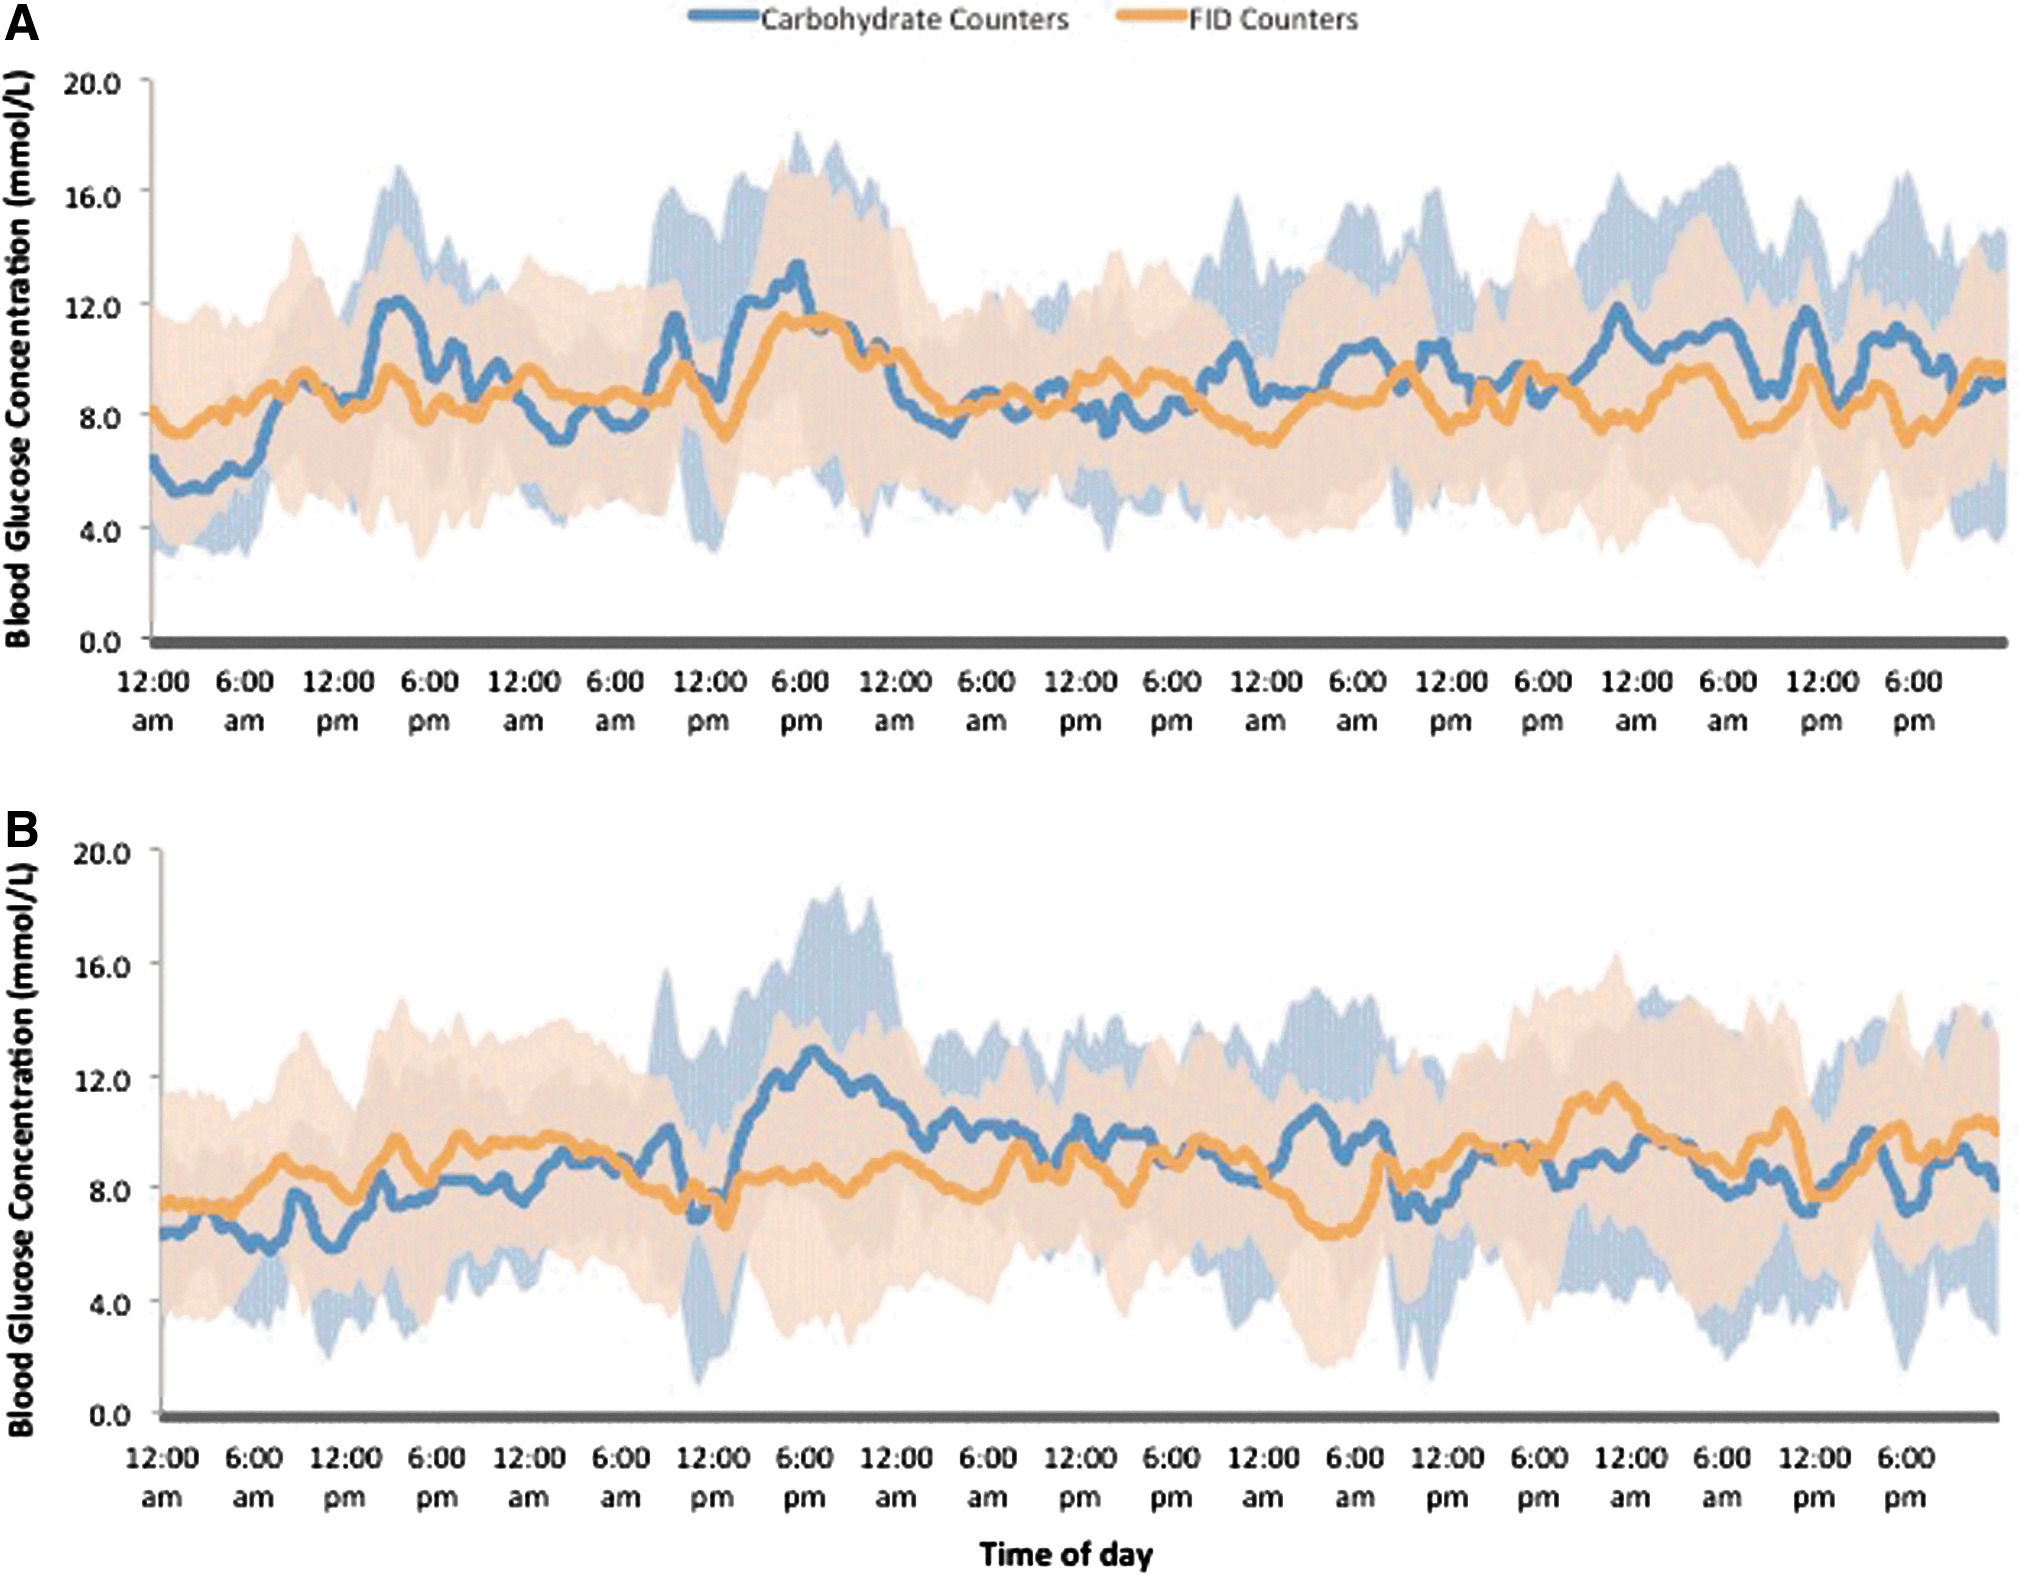
Variability in the mean blood glucose level in adults with type 1 diabetes using either Food Insulin Demand (FID) counting (n = 13) or traditional carbohydrate counting (n = 11) for estimating mealtime insulin doses at
Data are mean ± SE values.
Carbohydrate counters, n = 11; Food Insulin Demand (FID) counters, n = 13.
Significant difference.
Blood glucose (BG) ranges were defined as follows: low, <3.9 mmol/L; normal, 3.9–7.8 mmol/L; and high, >7.8 mmol/L.
CRP, C-reactive protein; HbA1c, glycated hemoglobin A1c; HDL, high-density lipoprotein; iAUC, incremental area under the curve; LDL, low-density lipoprotein; MAGE, mean amplitude of glycemic excursions.
Both groups spent a similar amount of time within the normal glycemic (FID vs. CC, 41 ± 45% vs. 40 ± 5%; P = 0.814) and hyperglycemic (FID vs. CC, 55 ± 65% vs. 51 ± 6%; P = 0.646) ranges, and there was no statistical difference between groups in the mean change in time spent in the hypoglycemic range (P = 0.158). However, FID counters experienced a 44% reduction in time in the hypoglycemic range (4.0 ± 1.1% at 12 weeks vs. 7.1 ± 1.4% at baseline; P = 0.058), whereas the CC group showed no change at end of the trial (9.4 ± 2.1% at 12 weeks vs. 8.5 ± 1.8% at baseline; P = 0.682) (change between groups, P = 0.117).
Changes in lipids or C-reactive protein were similar in both groups.
When asked to rate their experience with their allocated insulin dosing method, all participants, irrespective of assignment, agreed that their method was easy to use and that they were able to enjoy a wide range of foods. Approximately half of the participants in both groups felt their blood glucose levels were better managed during the study (FID vs. CC, 54% vs. 55%), whereas the remainder felt there had been no change. None of the subjects felt their glycemic control had deteriorated while they were involved in the study. In the FID group, almost half (46%) stated that they would continue using FID counting to estimate their bolus insulin dose.
Discussion
This is the first study of the clinical application of the FII to estimate insulin bolus requirements in adults with type 1 diabetes. The findings indicate that FID and CC produce comparable glycemic control as judged by changes in HbA1c, mean blood glucose, and the time within the optimum glycemic range. However, reductions in the overall MAGE and the 2-h postbreakfast blood glucose iAUC suggest that FID counting may be helpful in terms of improving postprandial glycemia. Although the number of hyperglycemic episodes was similar, FID counters showed a trend to reduced risk of hypoglycemia, inferring the potential for improved glycemic stability.
There are surprisingly few well-designed randomized controlled trials assessing the efficacy of CC in type 1 diabetes. Indeed, a recent meta-analysis reported that CC did not result in significant improvements in HbA1c when compared with routine care or an alternative strategy. 14 Since then, Schmidt et al. 15 reported large reductions in HbA1c using CC (−0.7% points and −0.8% points with and without an automated bolus calculator, respectively), but these improvements were not significantly different from that of the control group (P = 0.175).
Currently, there is interest in the importance of glycemic variability for reducing the risk of cardiovascular and other diabetes-related complications. Studies have shown that oxidative stress and epithelial dysfunction are more closely related to large fluctuations in glycemia than in chronic hyperglycemia. 16 Specifically, MAGE has been directly linked with the risk of microvascular complications, with univariate analysis showing MAGE to be a strong and significant predictor of oxidative stress. 17 In the present study the significant improvements in MAGE after 12 weeks in FID counters suggest it may be possible to reduce the risk of acute and chronic diabetes-related complications over and above those seen in CC. Because the FII is derived from integrated insulin responses in normal individuals, the FII may be able to more precisely estimate prandial insulin requirements in those with type 1 diabetes.
The strengths and weaknesses of our study should be noted. To reduce bias, we used an “attention placebo” (i.e., a control group that received the same intensity of interaction as the intervention group). Because glycemic control can improve owing to increased contact time with healthcare professionals, both groups received similar attention throughout the trial. Subjects in both groups attended structured group and individual appointments with the research dietitian, received identical resources, with only the key information and numerical food values changed, and were offered the same telephone and e-mail support throughout the trial. This attention placebo ensures that the differences in HbA1c observed were a direct result of the method of estimating mealtime insulin dose used.
The most important limitations of our study are the small sample size and large variability in blood glucose response as demonstrated by the interindividual variability in HbA1c and mean glucose levels. The higher baseline HbA1c in the carbohydrate counters could favor the FID counting group, although it could also be argued that the carbohydrate counters had more “room for improvement.” Factors such as differences in exercise between participants, incorrect insulin sensitivity factors, and missed meal boluses could have contributed to differences in the MAGE and the glucose iAUC after breakfast.
Our pilot study was designed to keep a “close eye” on participants and to gauge the sample size necessary for a larger trial. The observed difference in HbA1c levels at 12 weeks does not suggest any important advantage of one strategy over the other. Indeed, based on the SD in HbA1c level of 0.57 seen in this study (average SD of both groups), 116 subjects (58 in each group) would be required to achieve 80% power to detect a difference of 0.3% points in HbA1c in this population. However, the potential of the FII to reduce the risk of hypoglycemia and improve measures of glycemic variability should be considered in the design of future studies.
The inclusion of poorly controlled subjects could be viewed as a limitation. However, it was imperative that this type of subject was recruited as the study aimed to improve glycemic control in both groups. Indeed, the inclusion of well-controlled subjects may have limited the outcomes, as there was little opportunity for improvement. Nonetheless, poor glycemic control resulting in imprecise ICRs, correction factors, or basal rates may have limited the improvement in HbA1c regardless of the method of prandial dose estimation. Because neither group had these rates optimized during this study, both groups were equally “disadvantaged.” This may have limited the absolute improvement in HbA1c seen but not the relative differences between groups. Future studies should titrate insulin therapy ratios and rates to determine whether greater absolute improvements in HbA1c can be achieved in both groups.
In our study the potential for bias was real because the same research dietitian was responsible for both patient instruction as well as assessment. Interestingly, FID counting was not found to be “too complex” for clinical practice. All FID counters appeared to adapt quickly to the new algorithm. At the conclusion of the trial, all rated the method as “easy to use,” with just under half of subjects opting to continue with the system if the option were available. Of the two subjects who withdrew from the study following the initial group education workshop, one came from the CC group and one from the FID group.
Currently, CC is a routine part of the clinical management of type 1 diabetes and a compulsory requirement of initiating insulin pump therapy. This previous experience gave the carbohydrate counters a distinct advantage because they were all familiar and proficient with this algorithm. In contrast, the FID counters were required to learn and master the novel strategy in the space of a few weeks. In addition, the insulin dose to food ratio in the FID counters was extrapolated from their existing ICR, rather than determined through titration, which may have been a confounder that attenuated any potential improvement in HbA1c. Future studies should include the titration of insulin ratios in both groups to optimize postprandial glycemia results and allow fair comparison. Collection of insulin therapy data (e.g., insulin pump downloads), physical activity monitoring, records of communication, and detailed food diaries will also provide further insights into study compliance and postprandial blood glucose control. Although recruitment was limited to those using insulin pump therapy for ease of converting to the IFR, there is no reason why FID counting could not be applicable to patients using multiple daily injections as well. Further trials should explore the use of FID counting in those treated with multiple daily insulin injections. These considerations will also be important for the implementation of FID counting or any other new system of estimating insulin dose in clinical practice.
Other issues should also be addressed. Some subjects commented that the limited number of foods with a tested FII value made some meal estimations difficult. This is an important limitation of FID counting at present as the FII of each food is determined from the postprandial insulin responses of 10 lean, healthy adults and cannot be calculated from the macronutrient composition. At the time of the study the FII of 127 foods had been tested, representing a broad cross-section of commonly eaten foods in the Western diet. However, expansion of the FII database is ongoing and needs to continue before FID counting can be widely implemented.
In conclusion, our findings indicate that FID and CC produce comparable glycemic control as judged by changes in HbA1c, mean blood glucose, and the time within the optimum glycemic range. FID counting produced reductions in the overall MAGE and the 2-h postbreakfast blood glucose iAUC, suggesting it may have additional advantages. The small sample size and large variability in blood glucose responses in both groups are limitations that need to be addressed in future studies.
Footnotes
Acknowledgments
Support for this study was provided by the University of Sydney.
Author Disclosure Statement
No competing financial interests exist.
K.J.B. conceived the study, conducted the study, prepared the foods, collected data, analyzed and interpreted data, and wrote the manuscript. R.G. conceived the study, conducted the study, and interpreted data. D.M. conceived the study and interpreted data. P.P. and G.S. analyzed and interpreted data. G.H. conceived the study, monitored the whole test period as an endocrinologist, and interpreted data. S.C. conceived the study. J.C.B.-M. conceived the study, interpreted data, and wrote the manuscript. All authors contributed to the discussion of the manuscript.