
Abstract
Background:
Diabetes mellitus (DM) is a global metabolic epidemic associated with numerous adverse complications. Invasive finger prick tests or invasive monitors are currently the most common means of monitoring and controlling blood glucose levels (BGLs). Heart rate variability (HRV) is a noninvasive measure of the autonomic nervous system, and its dynamic physiological nature may provide an alternative means of blood glucose monitoring. However, the relationship between BGL and HRV parameters remains relatively unknown.
Materials and Methods:
Thirty-two participants with diabetes (39.97 ± 17.21 years of age) and 31 without diabetes (27.87 ± 10.55 years of age) participated in the current study. Fasting preceded a 10-min three-lead electrocardiogram (ECG), which was followed by a finger prick blood glucose assessment. Following this, a regular meal was consumed, and 30 min after ingestion, a second postprandial 10-min ECG was obtained, and blood glucose assessment was conducted.
Results:
Low-frequency (LF) power, high-frequency (HF) power, and total power (TP) of HRV were negatively associated with BGL in participants with DM. Additionally, the ratio of LF to HF was positively correlated with BGL. Duration of DM was also associated with multiple HRV parameters, with negative associations to both LF and HF parameters as well as TP.
Conclusions:
This study demonstrates links between specific HRV variables and BGL. In the future the dynamic nature of HRV could provide a unique and real-time method for monitoring BGL, for continuous noninvasive prediction and/or management of DM.
Introduction
D
Stringent glycemic control is used as the primary approach for the prevention of complications, resulting in approximately 85% of DM sufferers monitoring their BGL through numerous invasive finger prick tests over the course of the day. 3 This method not only mechanically limits the frequency of BGL monitoring, but the inflicted self-injury acts as a psychological barrier inhibiting regular BGL examination and monitoring. 3 –5 Furthermore, the discrete nature of a finger prick blood glucose test renders prospective projection of subsequent BGLs not possible; hence, a continuous and noninvasive method for monitoring BGL would be of great advantage over existing systems.
Heart rate variability (HRV) measures are known to closely reflect the sympathetic and parasympathetic branches of the autonomic nervous system (ANS). 6 Almost all visceral, metabolic, and vascular functions are innervated by components of the ANS, including the regulation of blood glucose. 7 It has been well established that acute hypoglycemia stimulates an acute sympathetic response in individuals with DM, 8 and a recent study by Cichosz et al. 9 effectively developed a novel HRV algorithm to predict hypoglycemic episodes in subjects with type 1 DM (T1DM). Unfortunately, the relationship between acute hyperglycemia and ANS activity remains relatively unknown. 8 Some studies have suggested there is an inverse relationship between BGL and parasympathetic HRV parameters. 10 –13 However, it is not clear whether this is an acute response or the result of cardiac autonomic neuropathy. 1
The present study explored the relationship between HRV parameters and BGL. This initial investigation provides pilot data for the potential investigation and future development of a noninvasive cardiac measure as a continuous glucose monitor (CGM) for T1DM and type 2 DM (T2DM).
Research Design and Methods
Study design and participants
The current cross-sectional observation study recruited 32 subjects with DM, 39.97 ± 17.21 years of age (21 with T1DM and 11 with T2DM), from the local community. An additional 31 individuals without diabetes (non-DM comparison group) (27.87 ± 10.55 years of age) were also recruited for the current study. The study had the following exclusion criteria: diagnosed diabetic neuropathy, blood pressure higher than 160 mm Hg during systole and/or 100 mm Hg during diastole, treatment for hypotension, proliferative retinopathy, history of cardiovascular events, excessive alcohol and/or nicotine consumption, and/or other diseases that were able to modify glucose metabolism. Based on these criteria, no individual recruit was excluded from inclusion in the current study.
The study protocol described in the next section was conducted in a controlled laboratory setting and was approved by the University of Technology Sydney Human Research Ethics Committee. Prior to commencing the study, all participants were instructed to abstain from food, drinks (excluding water), nicotine, alcohol, caffeine and any non–diabetes-related medications for at least 8 h prior to the study. All participants provided informed consent prior to the commencement of the study.
Experimental tasks and procedures
Initially each participant was seated and instructed to rest for a period of 5 min, after which three left arm blood pressure measurements were obtained 14 with a 2-min rest interval between each blood pressure recording. The blood pressure measures were obtained to satisfy the exclusion criteria and ethical requirements of the study, which dictated that any participant with a blood pressure of ≥160/100 mm Hg was to be excluded from the study. No participants were excluded because of their blood pressure readings.
Following the blood pressure measurements, disposable Ag/AgCl electrodes were placed, one at each shoulder and one over the xiphoid process, and a 10-min three-lead electrocardiogram (ECG) was recorded at 2,048 Hz, using a FlexComp Infiniti encoder (Thought Technology Ltd., Montreal West, QC, Canada) in conjunction with BioGraph Infiniti software (version 3.1.6; Thought Technology Ltd.). Each participant was asked to rest quietly in a seated position during the ECG recording. A three-lead ECG was selected as it is minimally intrusive and has been shown to produce clear QRS complexes adequate for subsequent HRV analysis. 15 Immediately following the completion of the first ECG recording, the participant's fasting BGL was determined using an ACCU-CHEK® Performa glucometer (Roche Diagnostics Pty Ltd., Castle Hill, NSW, Australia) with a finger prick test applied to the dominant ring finger. 16
The participant then consumed a regular meal, the contents of which were recorded for subsequent kilojoule (calorie intake) calculation; in the present study, calorie intake was not a factor required in the analysis. Fasting and postprandial BGL measures were taken to allow for a range to be obtained for subsequent correlation analysis with HRV parameters (see the Statistics and data analysis section).
BGL is expected to peak 30 min after meal consumption 11,17 ; hence at this time point a postprandial ECG of 10 min was also obtained under the same conditions as the fasting ECG recording described previously. At the completion of the postprandial ECG recording a second finger prick test was also performed to record the participant's postprandial BGL. Finally, three post-study left arm blood pressure measurements were obtained conforming to the ethical requirements, concluding the experimental protocol.
ECG data processing
Before HRV analysis can be performed, the raw ECG data must be subjected to preprocessing. A band pass filter set at 5–30 Hz was applied to the ECG recordings, as it helps remove other signal artifacts. 18 To ensure all R value were positive, the R values are squared, and the R-R time series is computed. A nonparametric fast Fourier transform was then applied to the resultant R-R time–series graph to obtain the power spectrum density spectrogram, which allowed the derivation of the HRV frequencies.
The HRV frequency bands obtained were the low-frequency (LF) power (0.04–0.15 Hz), high-frequency (HF) power (0.15–0.4 Hz), total power (TP) (0.00–0.4 Hz), and the LF/HF ratio. The LF parameter primarily reflects sympathetic activity, the HF parameter reflects parasympathetic activity, the TP parameter reveals overall autonomic activity, 19 and the LF/HF ratio represents sympathovagal balance or the complex interactions between the sympathetic and parasympathetic inputs. 20 The Shapiro–Wilks Normality Test revealed that all HRV parameters were highly skewed, as is typical of HRV studies 21 –24 ; hence the derived HRV measures were natural logarithm transformed prior to analysis.
Statistics and data analysis
The independent-sample t test was used to identify differences in demographics, HRV parameters, and BGL between the two sample groups. 25 Partial Pearson's correlation adjusting for age was used to assess the association of HRV parameters with BGL and DM duration in non-DM, T1DM, T2DM, and all DM participants (four groups). The groups were examined in this manner as there may be physiological and clinical disparities between T1DM and T2DM that could influence the results of the study. 26,27 It is important to note that the correlation analysis was conducted using fasted, postprandial, average (between fasted and postprandial data), and stacked (where fasted and postprandial data are considered multiple observations of the same variable) values. Significance is reported at P values of <0.05.
Results
Data from 31 participants without DM and 32 participants with DM were included in the following analysis. Twenty-one of the participants had T1DM, whereas the remaining 11 had T2DM. Table 1 shows the mean and SD values of several demographic variables, as well as the differences between the groups.
Data are mean ± SD values.
Statistically significant, P < 0.05.
Natural logarithm.
BGL, blood glucose level; BMI, body mass index; DBP, diastolic blood pressure; HF, high-frequency; LF, low-frequency; NA, not applicable; NDM, non–diabetes mellitus; SBP, systolic blood pressure; T1DM, type 1 diabetes mellitus; T2DM, type 2 diabetes mellitus; TP, total power.
Non-DM group versus both DM groups
Independent-sample t tests revealed that there were significant differences between the non-DM and DM groups (Table 1). As expected, BGL was significantly lower in the non-DM participants than in their DM counterparts (P < 0.01). It was found that all LF, HF, and TP HRV variables were all significantly higher (P < 0.01) and that postprandial LF/HF was significantly lower (P = 0.03) in the non-DM group compared with the T1DM group. Furthermore, the fasted non-DM group reported significantly higher (P < 0.01) LF, HF, and TP values than the T2DM group. Average LF, HF, and TP values were also significantly higher (P < 0.01) in the non-DM group.
T1DM group versus T2DM group
Independent-sample t tests revealed that there were no significant differences between the two DM groups for DM duration, BGL, or the HRV values of LF, HF, LF/HF, or TP (Table 1). It was, however, noted that participants with T2DM had a significantly greater age (P < 0.01), body mass index (P = 0.03), and systolic blood pressure (P = 0.02).
Associations between BGLs and HRV parameters
Correlation analysis identified that there was no significant relationship between any HRV parameter and BGL in the non-DM participants (Table 2). Similarly, it was revealed that there were no significant associations between any HRV parameter and BGL in the T1DM group (Table 3).
HF, high-frequency; LF, low-frequency; TP, total power.
Statistically significant, P < 0.05.
DM, diabetes mellitus; HF, high-frequency; LF, low-frequency; T1DM, type 1 diabetes mellitus; T2DM, type 2 diabetes mellitus; TP, total power.
Table 3 demonstrates that the fasted T2DM group's BGL was significantly associated with HF (r = −0.64, P = 0. 04) and LF/HF (r = 0.78, P < 0.01) (Fig. 1C), postprandial BGL was associated with postprandial HF (r = −0.64, P = 0.04) (Fig. 2B), average BGL was negatively associated with average HF (r = −0.67, P = 0.04) and positively associated with LF/HF (r = 0.70, P = 0.02), and stacked BGL was associated with stacked LF/HF ratio (r = 0.66, P = 0.04).
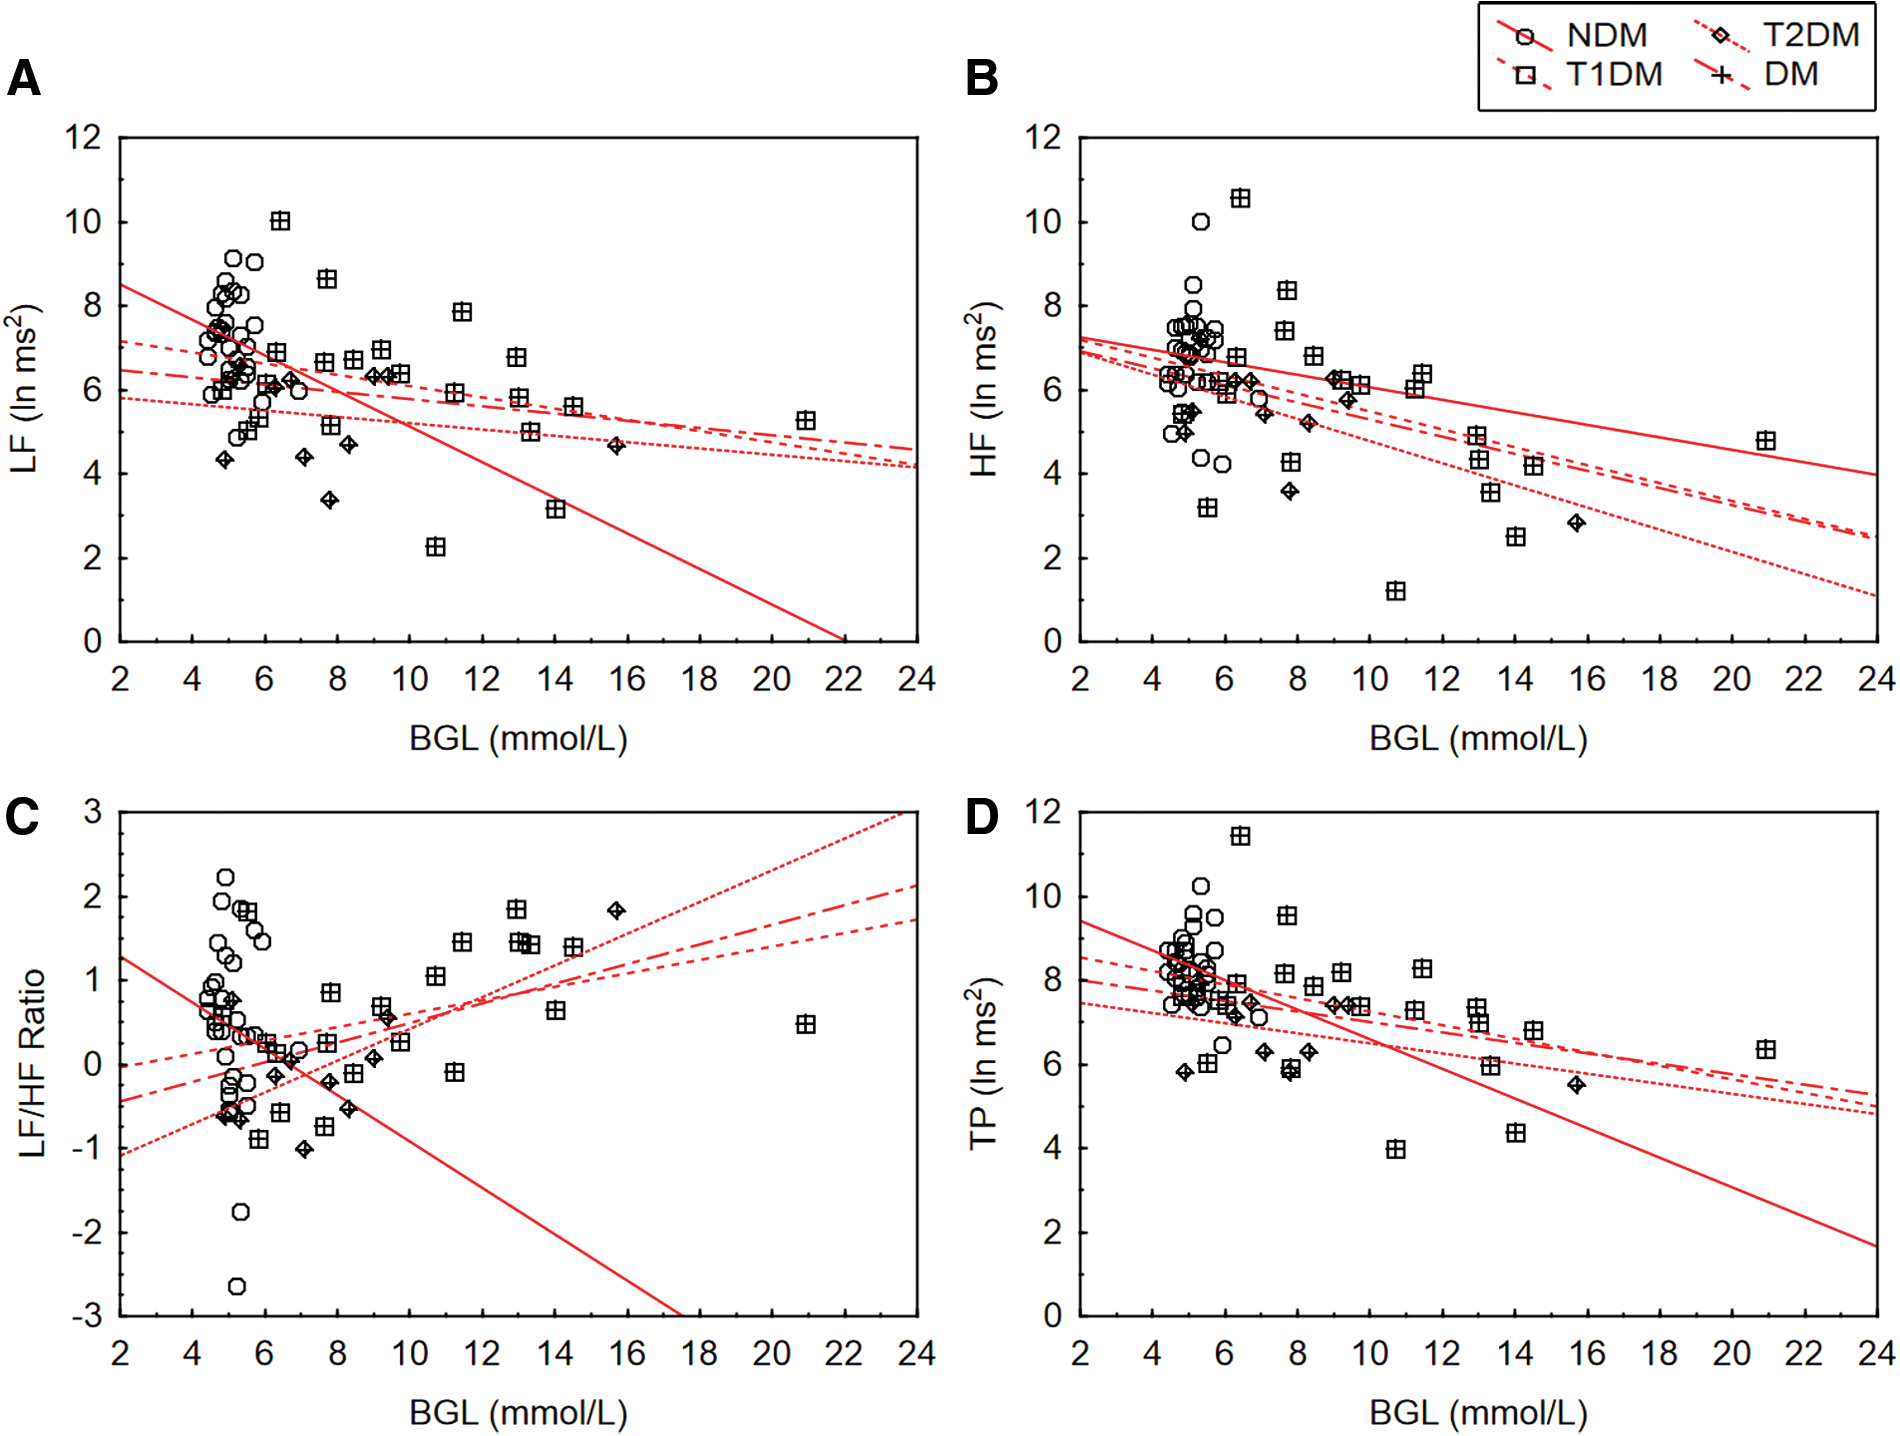
The associations between fasted heart rate variability and blood glucose level (BGL) in non–diabetes mellitus (NDM), type 1 diabetes mellitus (T1DM), type 2 diabetes mellitus (T2DM), and pooled diabetes mellitus (DM) participants (n = 32):
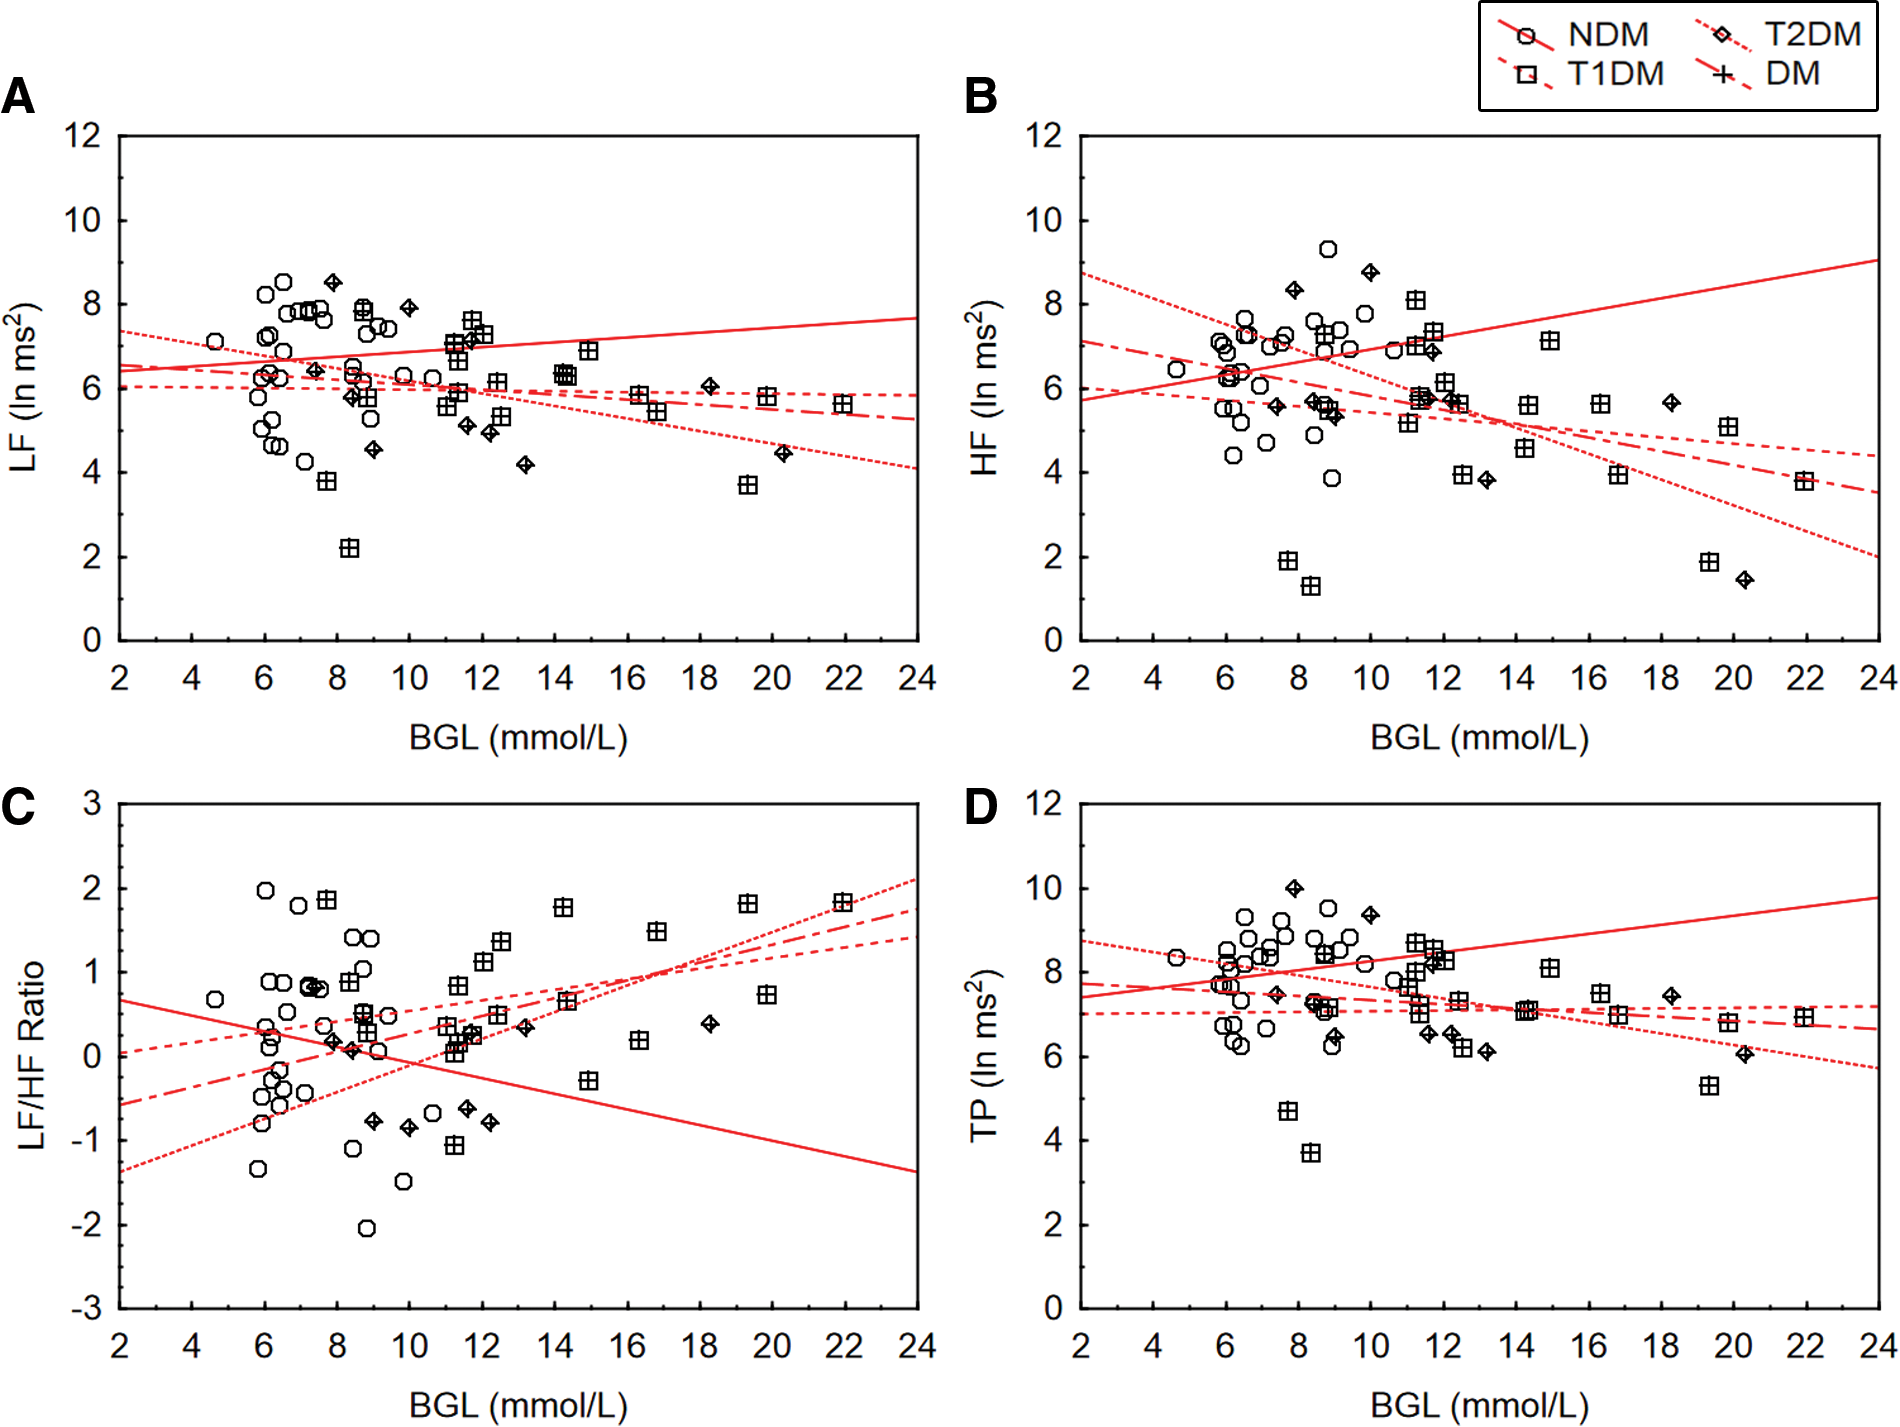
The associations between postprandial heart rate variability and blood glucose level (BGL) in non–diabetes mellitus (NDM), type 1 diabetes mellitus (T1DM), type 2 diabetes mellitus (T2DM), and pooled diabetes mellitus (DM) participants (n = 32):
Furthermore, as there was little significant difference between duration of DM, BGL, and HRV parameters, the data from the T1DM and T2DM groups were also pooled for the correlation analysis. Partial Pearson's correlation analysis performed on the entire DM dataset (n = 32) revealed that BGL in fasted subjects was negatively associated with HF (r = −0.46, P = 0.01) and TP (r = −0.40, P = 0.02) as well as positively associated with LF/HF (r = 0.50, P < 0.01). Similarly, postprandial BGL was also positively associated with postprandial BGL (r = 0.44, P = 0.01). Averaging the data revealed a negative association between BGL and HF (r = −0.40, P = 0.03) (Fig. 3B) and a positive association with LF/HF ratio (r = 0.49, P < 0.01); stacked data revealed similar relationships between BGL and HF (P = −0.39, P = 0.03) (Fig. 4B) as well as LF/HF (r = 0.45, P = 0.01). Additionally, the correlations between change in BGL (between the fasted state and postprandial measures) and postprandial HRV were also examined; however, no significant results were found (Table 4).
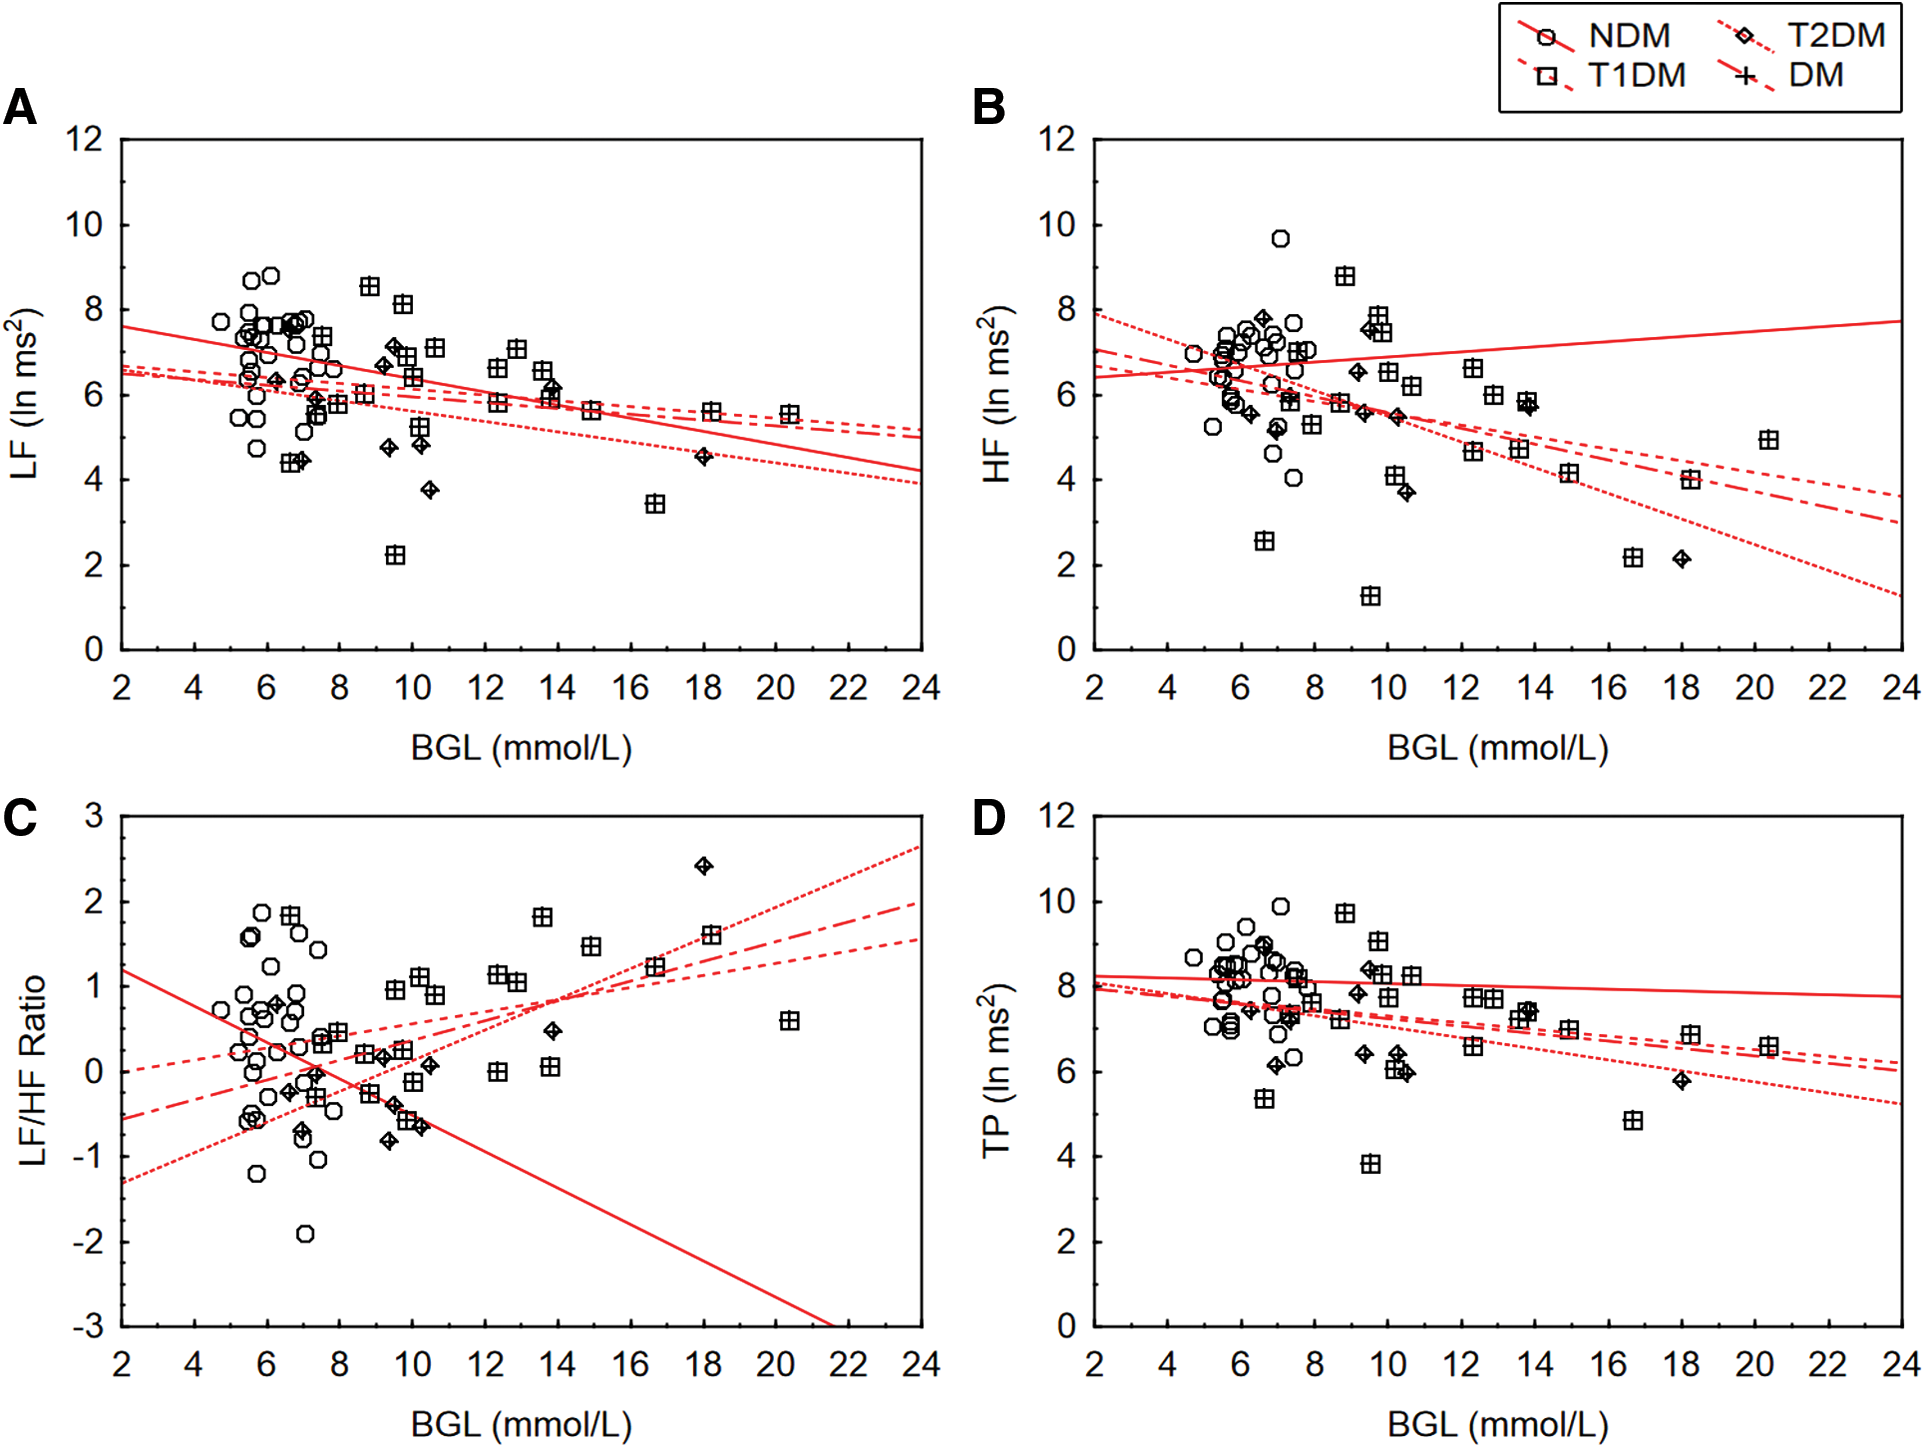
The associations between average heart rate variability and blood glucose level (BGL) in non–diabetes mellitus (NDM), type 1 diabetes mellitus (T1DM), type 2 diabetes mellitus (T2DM), and pooled diabetes mellitus (DM) participants (n = 32):
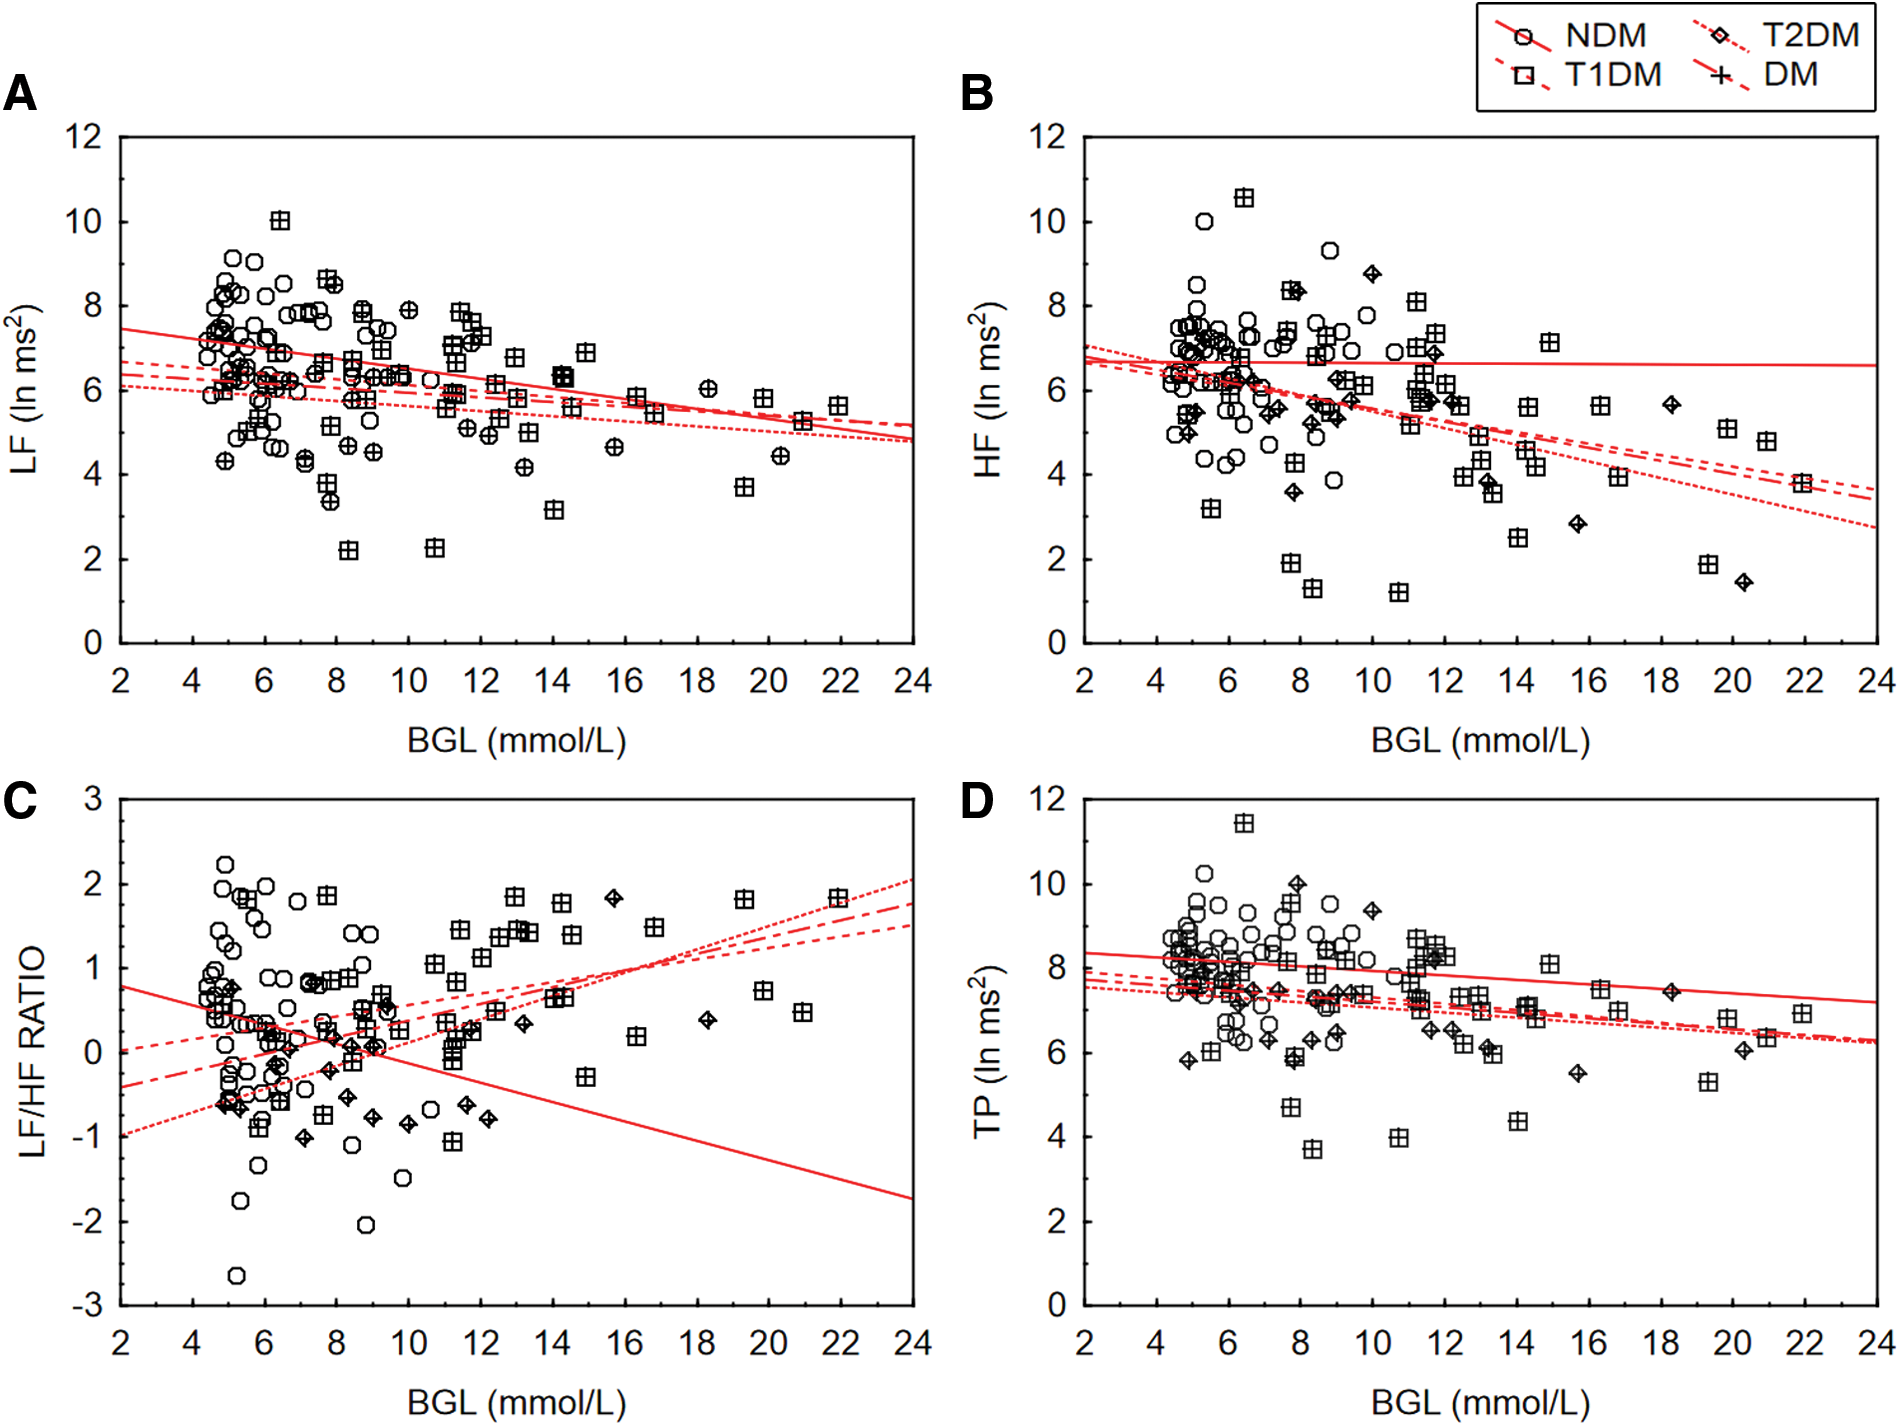
The associations between stacked average heart rate variability and blood glucose level (BGL) in non–diabetes mellitus (NDM), type 1 diabetes mellitus (T1DM), type 2 diabetes mellitus (T2DM), and pooled diabetes mellitus (DM) participants (n = 32):
DM, diabetes mellitus; HF, high-frequency; LF, low-frequency; NDM, non–diabetes mellitus; T1DM, type 1 diabetes mellitus; T2DM, type 2 diabetes mellitus; TP, total power.
As multiple significant correlations (HF, LF/HF, and TP) were found for BGL in the fasted pooled DM participants, stepwise forward regression was used to identify the strongest predictor. The regression was overall significant (P < 0.01) and included two variables (LF/HF and TP) (Table 5) that predicted 31% of the variance in BGL of fasted subjects: R = 0.56, R 2 = 0.31, adjusted R 2 = 0.26, df (2, 29), F = 6.49. Furthermore, the LF/HF ratio was identified as the strongest predictor (β = 0.46, P < 0.01).
Statistically significant, P < 0.05.
HF, high-frequency; LF, low-frequency; TP, total power.
When examining DM duration and HRV, significant associations were found between LF in fasted subjects (r = −0.45, P = 0.04), as well as postprandial (r = −0.49, P = 0.03), average (r = −0.49, P = 0.03), and stacked (r = −0.45, P = 0.04) LF and DM duration of T1DM participants (Table 6). Stepwise forward regression for aggregate for T1DM duration only included average LF (β = −0.52, P < 0.02) in the model, which significantly predicted 27% of the variance in T1DM duration: R = 0.52, R 2 = 0.27, adjusted R 2 = 0.23, df (1, 19), F = 6.91, P < 0.02).
Statistically significant, P < 0.05.
HF, high-frequency; LF, low-frequency; NDM, non–diabetes mellitus; T1DM, type 1 diabetes mellitus; T2DM, type 2 diabetes mellitus; TP, total power.
It is interesting that DM duration for T2DM participants was not associated with any HRV variable. Aggregating the data revealed significant negative associations between LF in fasted subjects and stacked LF (r = −0.44, P = 0.01 vs. r = −0.44, P = 0.01), HF (r = −0.42, P = 0.02 vs. r = −0.42, P = 0.02), and TP (r = −0.37, P = 0.04 vs. r = −0.37, P = 0.04) variables. Stepwise forward regression for aggregate DM duration included only LF in fasted subjects (β = −0.43, P = 0.016) in the model, which significantly predicted 18% of the variance in DM duration: R = 0.43, R 2 = 0.18, adjusted R 2 = 0.15, df (1, 30), F = 6.64, P < 0.02.
Discussion
HRV is a reputable method developed primarily to monitor cardiac health. 28 Currently, there is a limited amount of research observing the acute effect of hyperglycemia on HRV parameters; however, literature suggests that studies such as the present one are important because of the interdependent relationship between the ANS and blood glucose. 29
As to be expected there was a difference in blood glucose concentration between the non-DM and DM groups, with the diabetes participants possessing higher average values. Similarly, LF, HF, and TP HRV activity also varied between the two groups, with diabetes participants having lower overall HRV activity than their counterparts without diabetes, a series of results that is supported by previous research. 12,30,31 It has been previously suggested that poor glycemic control (as is the case in diabetes) may contribute toward the development of cardiac autonomic neuropathy 32,33 ; furthermore, an overall reduction in HRV has been previously used as a sensitive biomarker of subclinical cardiac autonomic neuropathy. 34 Thus it may be possible that the differences in HRV activity found in the current study are related to underlying neuropathic changes resultant from poor glycemic control. It should be noted that these differences were not observed between the T1DM and T2DM groups.
Relationship between HRV and BGL in DM
The present study identified several relationships between HRV and BGL. It is important to note that these relationships were only found in the T2DM group and the stacked DM group; the BGL of T1DM was not significantly correlated to HRV parameters, although a few tests bordered significance (P < 0.1). It is possible that the physiological and clinical disparities between T1DM and T2DM 26,27 could account for the lack of significant results for T1DM subjects.
The first series of results was an inverse association between HF HRV and BGL associating HF activity with high blood glucose concentration, a result that aligns well with previous research. 11,13,30 Liao et al. 35 reported an inverse association between the HF parameter of HRV and blood glucose concentration, which was attributed to the degree of cardiac autonomic neuropathy, potentially suggesting a physiological link between vagal function and impaired glucose regulation. 36 Weissman et al. 11 also reported an inverse relationship between the HF parameter and BGL; however, this was in gestational DM subjects (n = 12). Furthermore, this result also aligns with the Framingham Heart Study (n = 1,919) 30 and work from Jarczok et al., 13 with both these studies also reporting an inverse association between the HF parameter and BGL. Both studies suggested that this relationship is independent of other metabolic components including age, collectively postulating that blood glucose concentration can directly influence HRV parameters.
Several potential explanatory mechanisms for this influence of blood glucose on parasympathetic control have been proposed. It has been theorized that heightened systemic glucose is associated with increased systemic norepinephrine, which is a fundamental indicator of sympathetic activity and which frequently results in parasympathetic (HF) withdrawal. 37 However, the mechanisms for glucose activation of norepinephrine are still unknown. 8 Additionally, hyperglycemia promotes the activation of the polyol pathway by flooding high-affinity neuronal glucose transport proteins. 38 The subsequent accumulation of sorbitol can reduce neuronal Na+,K+-ATPase activity, substantially reducing nerve conduction velocity, 39,40 particularly in the longer, more exposed vagus nerve. 1 Animal models have also indicated that glucose sensors in the hepatoportal region may signal afferent fibers to the solitary tract nucleus in the brainstem, innervating sympathetic activity. 41 Finally, glycation end products and circulating cytokines such as tumor necrosis factor α are also suspected of promoting sympathetic activity. 42
The second series of relationships identified between HRV and BGL in the present study was an association between BGL and the LF/HF ratio (also known as the sympathovagal balance 20 ), as significant positive correlations between the LF/HF ratio and BGL were identified. This result aligns with previous research from Assoumou et al. 43 and Mirza and Lakshmi, 12 with both studies reporting a positive association between the LF/HF ratio and blood glucose concentration, although the result from the work of Assoumou et al. 43 was derived from female participants only. It is important to note that these authors 12,43 reported reductions in both LF and HF and suggested that because of the augmented neurotoxic effects of hyperglycemia on the exposed vagus nerve, HF parameters were further reduced. Consequently, it could be suggested those with DM and increased BGL may experience sympathetic predominance due to HF withdrawal, carrying a greater risk of cardiac morbidity and mortality. 1
Additionally, the present results are further supported by work from Di Flaviani et al., 44 who investigated glycemic variability in T2DM subjects (n = 26) via 24-h continuous BGL and 24-h continuous HRV recordings. It was found that following the dinner meal, as BGL rose a significant positive association between the LF/HF ratio and mean BGL was identified. However, work by Singh et al. 30 suggested the opposite, as they found a negative association between the LF/HF ratio and BGLs. However, the results of Singh et al. 30 may have differed from those of the current study and others reported in the literature 43,44 owing to the disproportionate sizes of glycemic groups (non-DM, n = 1,779; impaired fasting glucose, n = 56; DM, n = 84) 30 and the negative effects that circadian rhythms have on 24-h HRV recordings. 34 Nonetheless, these juxtaposed results indicate that future research, particularly real-time continuous 24-h investigation of HRV and BGL, is required to fully understand the relationship between these parameters.
Relationship between HRV and duration of DM
As expected, the present study revealed that duration of DM for T1DM participants was negatively associated with LF HRV. Additionally, in the stacked DM group HF and TP HRV were also negatively associated. It is important that duration of DM in T2DM participants was not significantly associated with HRV parameters. T2DM participants had a lower average duration of DM (9.90 ± 10.09 years) compared with their T1DM counterparts (14.40 ± 10.32 years); however, this was not statistically significant. Despite this, the clinical importance of 4.5 years of potential disease progression cannot simply be overlooked and may explain the difference in the results between the two DM groups.
These results align with previous reports such as the study by Nolan et al., 45 which similarly examined the association between HRV and duration of T2DM (n = 261) and reported an inverse association between vagal HRV parameters (namely, HF) with the duration of DM in male participants. Approximately 70% of DM participants in the present study were male, which may explain the similarities of the findings in the present study with those from Nolan et al. 45
Additional support for the present results can also be derived from other recent research, where Jaiswal et al. 46 reported an inverse relationship between HRV and the duration of DM in adult T1DM subjects (n = 354) and Chessa et al. 31 also identified an inverse relationship between HRV parameters and the duration of DM in children with T1DM (n = 50). Chessa et al. 31 reported that subclinical cardiac autonomic neuropathy was identified just 8 years from initial diagnosis, which suggests the importance of taking the duration of DM into account in future, much larger studies.
Finally, it is important to note that a major risk factor for the development of cardiac autonomic neuropathy is having DM for a period of between 12 to 15 years, 7 as the mean duration of DM (for all DM participants) in the present study was 12.60 ± 10.31 years. Hyperglycemia is known to invoke several neurotoxic glycolytic pathways, which may result in both central and peripheral neuropathy, conditions that have been shown to be progressive with the duration of DM. 45 Peripheral neuropathy may, among other effects, impair an individual's level of vagal tone and control, which may reduce his or her LF and HF HRV as well as TP HRV. It may also provide a potential explanation of the current findings with respect to DM duration and HRV.
Limitations
Although this initial exploratory study identified significant correlations between certain HRV parameters and BGL, its cross-sectional design is limiting as these parameters are known to fluctuate with the body's natural circadian rhythms, as well as from day to day. 47 As such, a longitudinal design would allow stronger, more accurate conclusions to be drawn about the present associations found between HRV and BGL, especially in the context of diabetes.
Similarly, obtaining a 24-h ECG and complementary CGM would also provide a more detailed representation of real-time HRV and BGL fluctuations over the course of a 24-h period. The CGM would also allow indices of glucose variability, such as the mean amplitude of glycemic excursion, blood glucose uptake, glucose storage, thermogenesis, and insulin concentrations to be calculated, 8 which would permit a stronger examination and understanding of the links between HRV and BGL and implications for DM.
Conclusions
The global impact and scale of DM is an escalating concern as the leading cause of nontraumatic limb amputation, blindness, and end-stage kidney disease. 48 DM is also implicated in a large portion of cardiovascular disease mortalities. 49 –51
A recent study by Cichosz et al. 9 shows a promising direction for future research. Cichosz et al. 9 used a novel HRV algorithm to predict hypoglycemic episodes. Hypoglycemia was induced in T1DM subjects (n = 10), and HRV was used in conjunction with a CGM to monitor the sensitivity and accuracy of the predictive algorithm. This hybrid methodology elevated sensitivity to 79% and specificity to 99%, correctly predicting 16 of 16 hypoglycemic events, with zero false-positives, and a 22-min lead time over CGM alone. Through the amalgamation of the present results and the aforementioned algorithm, it may be possible to develop a theoretical algorithm that would allow for the noninvasive prediction of both hypoglycemia and hyperglycemia events in real time. Furthermore, with today's advancing sensor technology, 52 –54 noninvasive HRV-based algorithms could potentially track ongoing BGL and generate alerts when glucose concentrations are outside a normal range and could also advance the “artificial pancreas” concept, by activating an insulin delivery pump via a closed-loop system. 55
The current study demonstrated that the dynamic nature of HRV may provide not only a unique and novel way to investigate both blood glucose concentration and diabetes duration, but also identify relationships with the potential to predict and/or manage DM. If a single or combined measure of HRV is able to predict real-time changes in BGL, this could lead to a novel method for noninvasive monitoring of BGL based on HRV parameters. Such novel technology 56 could eliminate the complications and fatalities associated with the daily glucose excursions that occur in diabetes. Inclusion of such HRV as a basis for CGM devices can substantially augment the safety aspects of existing invasive CGMs as well as provide a noninvasive practical alternative.
Footnotes
Acknowledgments
The authors would like to acknowledge the following organization and individual: Diabetes Australia and Mr. Jaymen Elliott for supporting the recruitment of participants in the present study, as well as Dr. Budi Jap for input into preprocessing of the ECG data.
Author Disclosure Statement
No competing financial interests exist.