
Abstract
The coronary artery calcium (CAC) scan has recently emerged as a reproducible noninvasive test to detect asymptomatic atherosclerotic coronary artery disease. It has several advantages over the traditional cardiac stress testing modalities, including lower cost, greater sensitivity for nonobstructing coronary artery lesions, and excellent prognostic value when combined with the Framingham risk parameters. Its chief disadvantage is that it does not identify obstructing coronary artery lesions or noncalcified coronary artery plaque. A CAC scan utilizes a chest computed tomogram and computer software to calculate the amount of calcium in the four main coronary vessels. Calcium is deposited in coronary plaques so that the greater the calcium score, the greater the plaque burden. This, in turn, is the basis for predicting a 10–15-year risk of a cardiovascular event. Individuals with a zero calcium score have a very low 10-year risk of a cardiovascular event. Obtaining a calcium score in a diabetic patient permits rational decisions for prescribing statin therapy. In patients with a zero score, the initiation of statin therapy is not recommended because the 5-year incidence of atherosclerotic cardiovascular disease is so low. In patients with diabetes, it is recommended to repeat the calcium scan in 4–5 years to permit timely therapy in the event that the score becomes positive. Since statins mildly increase coronary calcium as part of the stabilization of plaque, a reduction in the calcium score should not be anticipated. However, progression of the calcium score by more than 15%/year (calculated from a repeat CAC scan) provides additional prognostic information of an indication of progression of atherosclerosis. In summary, the coronary calcium score is a major clinical advance for noninvasively detecting coronary artery disease and managing antiatherosclerotic therapy in type 1 diabetes.
Introduction: Rationale for the Coronary Artery Calcium Scan
A

Primary causes of death in men and women who have type 1 diabetes from a U.S. database. Cardiovascular disease exceeds all other cases of death in both genders. Death information was obtained from available death certificates. Adapted from Secrest et al. 2
Adapted from Nasir et al. 39
ASCVD, atherosclerotic cardiovascular disease; CAC, coronary artery calcium.
Specifics of the Test
The CAC scan is derived from a computed tomogram (CT) of the chest, which visualizes the heart and takes multiple 3-mm slices through the coronary arteries between heart beats during a held breath. Calcium in the coronary arteries is readily visualized and quantitated with specific software. The radiology technician places a cursor on the CAC image and the computer calculates a score. Refinements in the last several years have reduced the radiation dose to less than 1 msv, which equals ∼3 months of background radiation in many U.S. cities, or the amount received from a mammogram. The score is verified by either a radiologist or a cardiologist to ensure that only the calcium in the coronary arteries (and not the aorta or other vessels) is sampled. A total score is calculated as the sum of scores for each of the four main coronary arteries (Fig. 2).
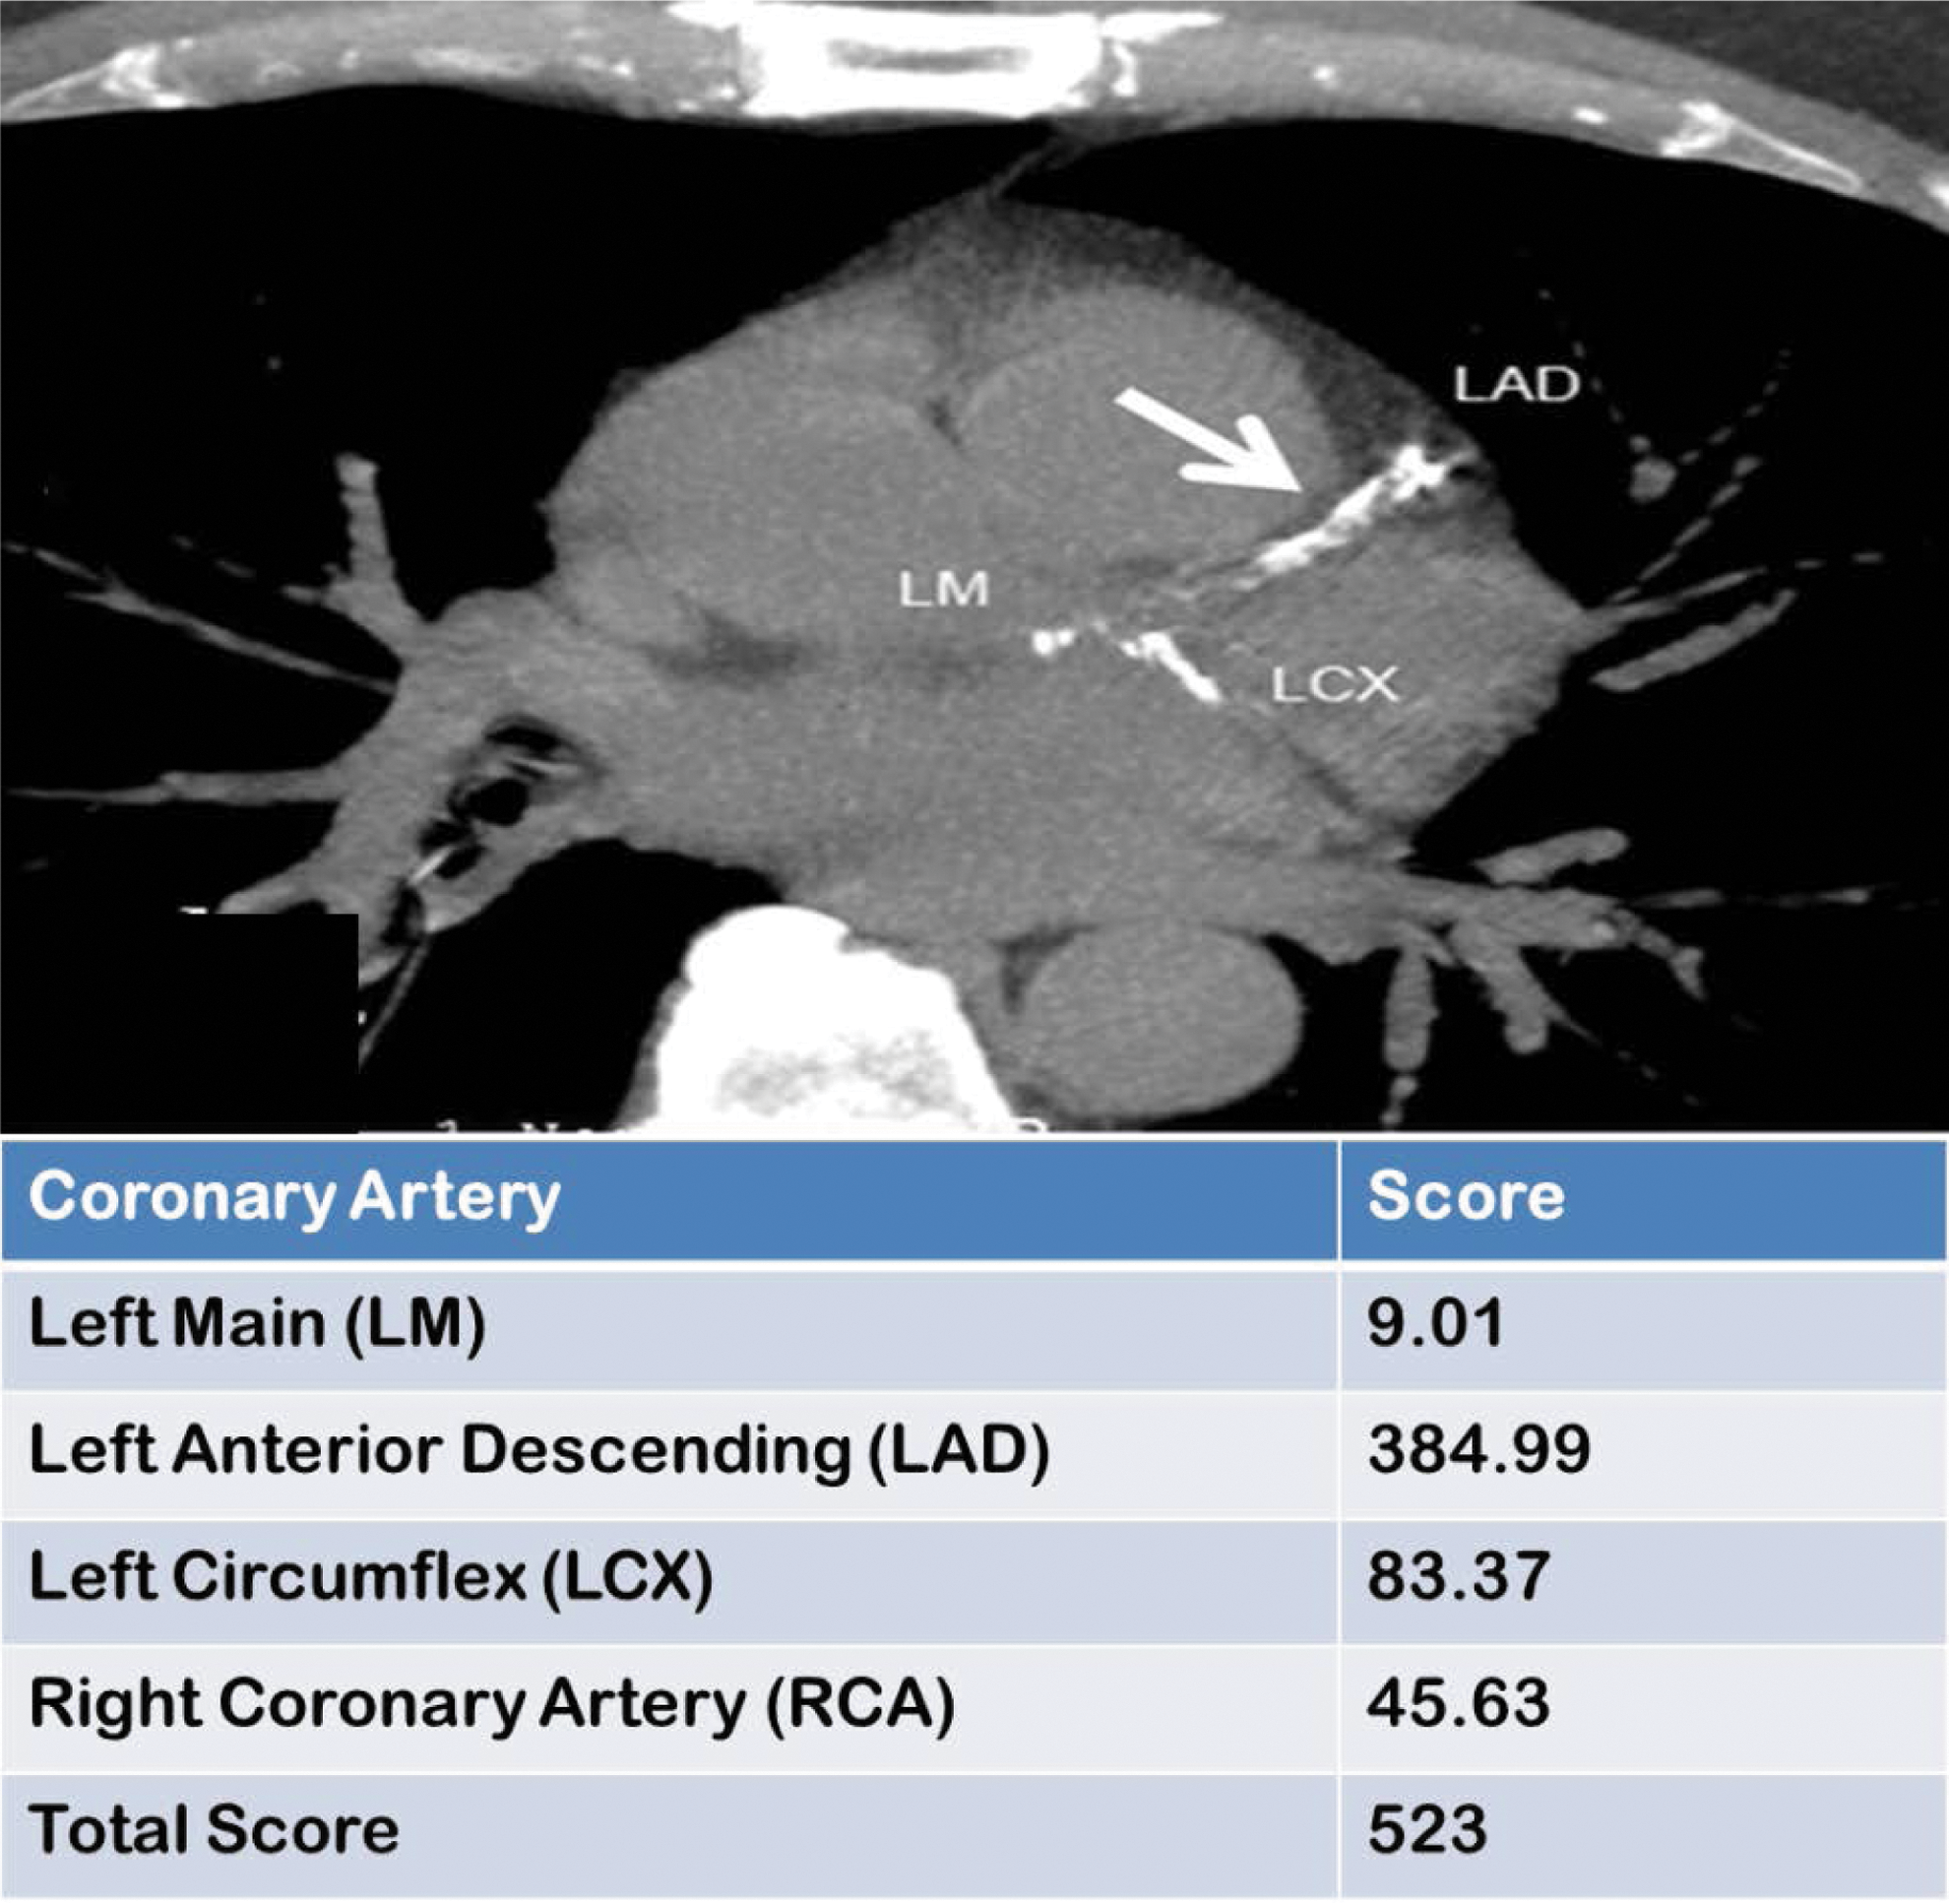
Typical CAC score report of calcium in the four main coronary arteries. The total score is the sum of the four individual scores and is used to quantitate the risk of a future cardiovascular event. The radiograph at the top is not usually included in the report, but is included in this figure for illustrative purposes. CAC, coronary artery calcium. The arrow designates coronary artery calcium in the Left Anterior Descending (LAD) artery.
Scoring the CAC Test
The score assigned to a CAC scan is intended to summarize the degree and extent of calcium contained in the four major coronary arteries. Many scoring systems exist, but the most commonly used scoring system is known as the Agatston Score. 10 The method involves identifying visually identifiable regions of interest that contain calcium within the coronary arteries and determining the area for all lesions >1 mm2, as well as the maximum calcific density for all lesions >130 Hounsfield Units in each identified lesion. Scores for individual lesions are determined by multiplying the lesion area by a weighted density factor, with denser lesions receiving a higher weighting [Score = (Weighting Factor) × (Area)]. The final score is derived by summing all of the individual scores (i.e., ∑Score). To account for variation in CT slice thickness and spacing, the normalized Agatston Score is expressed as [(Slice Increment/Slice Spacing) · (∑Score)], and this normalized score has been validated for both the common research methodology of electron beam computed tomography and the more commonly clinically utilized multidetector computed tomography in the general population. 11
Regarding the density of the atherosclerotic lesion, the Agatston Score treats increasing density as a detrimental change, but others have suggested that increasing plaque density (as occurs with statin therapy) is a quality of a mature more stable plaque. Criqui et al. have shown that among 3398 subjects in the MESA Trial, increasing plaque volume was associated with a hazard ratio of 1.81 (95% CI = 1.47–2.23) for a new coronary heart disease event, while increasing plaque density was associated with a hazard ratio of 0.73 (95% CI = 0.58–0.91) for a new coronary heart disease event (Fig. 3). 12 As such, it is probably most accurate to consider that for any level of CAC volume, CAC density is inversely associated with risk for a new ASCVD event.

Adjusted hazard ratios for ASCVD events according to quartiles of CAC volume score
Another limitation of the Agatston Score is the fact that variability in the score is not uniform across all levels of CAC. As such, using a percent change in the Agatston Score to define CAC progression may be misleading, depending upon the baseline CAC score value (e.g., a change in score from 10 to 20 represents a 100% increase, while a change from 400 to 500 represents a 25% increase). For this reason, a method that incorporates both the baseline value and the inherent measurement error of the test (i.e., people with higher CAC scores exhibit greater test-to-test variability) is desirable. To address this limitation, one group has shown that the interscan variability of CAC tests can be effectively reduced by using the square root of the calcium volume score and by defining a clinically meaningful change in volume as any change greater than 2.5 mm3. 13
As described above, the Agatston Score has several limitations, including the fact that the score increases nonlinearly with increasing calcification, a lack of relationship to actual anatomical physical measures (such as degree of arterial stenosis), and some variability due to substantial jumps in the weighting factor as lesion density increases. 11 Although there are other methods used to calculate CAC scores with reduced variability compared with the Agatston score, all scoring methods make assumptions that may ultimately affect their validity. These include the assumptions that (1) denser calcification is weighted more highly and (2) the distribution of calcium within the lesion is not taken into account. Nevertheless, the Agatston Score remains the most widely used method for calculating a CAC score and has proven very useful for clinical application.
Prognosis After the Test: Long-Term Follow-up
There are several studies in the general population that have examined the ability of the CAC score to predict future ASCVD events. In a relatively short follow-up period of 3 years, in young asymptomatic men, the presence of coronary artery calcification provided substantial, cost-effective, independent prognostic value in predicting incident ASCVD that was incremental to measured coronary risk factors. 14 A longer study identified 288 individuals who received CAC scans and who were followed up after a mean of 6.9 years. When a stepwise multivariable model was used, only age and the CAC score predicted hard endpoints (comprising cardiac death and nonfatal myocardial infarction). The investigators concluded that a CAC scan was highly predictive of future cardiac events. 15 Other authors have found that the CAC score is superior to traditional risk factor predictive models for future ASCVD events. 14 In another study, follow-up of 9715 asymptomatic patients for 14.6 years demonstrated that the extent of CAC accurately predicted the 15-year mortality in a large cohort of asymptomatic patients. 16 In fact, when a CAC score is combined with traditional risk factors, even better predictions have been achieved. 17 Attempts at trying to define specific risk factors for ASCVD in type 1 diabetes have been challenging. 18 The most recent attempt is the Steno Risk Engine, a primary prevention model of the first fatal/nonfatal cardiovascular disease event. 19 Although an improvement over the Framingham Risk model, all such models suffer from the difficulty of not including some risk factors (either known or unknown) and the duration and intensity of the each risk factor plus the sensitivity of an individual to that risk factor. The advantage of the calcium scan is that it integrates all of these model limitations into a composite picture of total risk. 20 Outcome data in type 1 diabetes based on CAC testing may soon become available from the Coronary Artery Calcification in Type 1 Diabetes (CACTI) and Epidemiology of Diabetes Interventions and Complications (EDIC) clinical trials.
CAC Scores in People with Type 1 Diabetes
Patients with type 1 diabetes have a two- to sevenfold increased risk of cardiovascular disease that is not completely accounted for by traditional cardiovascular risk factors (Fig. 4). 21 Genetics relative to polymorphisms of the renin–angiotensin system genes also play a significant role as well as glycemic variability, obesity, and polymorphisms of apolipoprotein A-IV. 22 –25 In addition, a significant portion of this increased risk is attributable to hyperglycemia, as shown in multiple long-term studies. 26 However, studies shorter than 5 years duration may be insufficient to demonstrate this effect. For example, the landmark study establishing the importance of glycemic control in the avoidance of microvascular complications of type 1 diabetes, the Diabetes Control and Complications Trial (DCCT), was initially unable to establish a definitive reduction of macrovascular or cardiovascular events among subjects receiving intensified diabetes therapy. This failure to reach statistical significance was probably due to the young age of the experimental cohort, low event rates observed in the study, and a possible type 2 statistical error. 27 Indeed, a significant beneficial effect of intensified therapy was eventually demonstrated, with patients in the intensified therapy group exhibiting a 42% reduction in cardiovascular events during an average 17 years of follow-up. 28 The DCCT follow-up study, the EDIC, was able to establish that subjects who received the intensified intervention for an average of 6.5 years during the DCCT had a 45% reduction in any cardiovascular events over the ensuing 10.5 years. 28 Unfortunately, the mechanism by which hyperglycemia and/or glycemic variability promotes the pathogenesis of ASCVD remains uncertain.

Fifteen-year mortality prediction based upon the CAC scan score. For any given score, the diabetic patient has both a worse prognosis and a higher risk. In type 1 diabetic individuals, treating the diabetes with intensive insulin therapy will reduce the risk compared with conventional therapy (see text). Adapted from Valenti et al. 21
CAC scans were obtained on the EDIC cohort in the year 2000. Overall, 31% of the DCCT/EDIC cohort had CAC scores greater than zero at the time of assessment. An analysis of these data established that EDIC patients from the Intensified Therapy group had significantly lower CAC scores than subjects who received Conventional Therapy (Fig. 5). 29 This effect was greater among subjects who had no signs of microvascular disease at the time of randomization (i.e., the primary prevention subgroup, n = 289) than among subjects who had established microvascular complications at the time of randomization (i.e., the secondary prevention subgroup, n = 308). This observation may be due to the fact that the secondary prevention group had additional risk factors for atherosclerosis, which may have overshadowed the effects of hyperglycemia.

Subjects with type 1 diabetes who received intensified therapy for an average of 6.5 years were significantly less likely to have a CAC score greater than 200 than subjects who received Conventional Therapy. Adapted from Cleary et al. 29
Statins and Calcium in the Plaque
One of the primary reasons to obtain a CAC scan is to assist in decision-making as to whether or not to start antiatherosclerotic preventative therapy in an asymptomatic patient. For the vast majority of such patients, HMG-CoA reductase inhibitors, or statins, would be the initial drug class of choice for such preventative therapy. However, statins increase CAC content as they stabilize plaques and reduce the risk of cardiovascular events, potentially confounding the interpretation of sequential CAC scores. 30 –32
The question of whether or not statins specifically increase CAC scores in patients with diabetes has also been investigated. There are several studies that have addressed this question in type 2 diabetes, but no studies have yet been reported in type 1 diabetes. Statin trials in type 1 diabetes are needed because the clinical progression, lipid profiles, treatment regimens, glucose control, and date of onset of the disease are different in these two forms of diabetes. For these reasons, it is problematic to apply statin trial results in type 2 diabetes to individuals with type 1 diabetes. With this limitation in mind, in 2005, a retrospective analysis was performed in 1310 subjects who received sequential CAC scanning at least 1 year apart to explore whether or not statins reduced the rate of progression of coronary artery plaque calcification. Of these subjects, 157 had type 2 diabetes. 33 For this analysis, the authors considered an annual increase in calcium score of >15% as evidence of significant progression. Compared with nondiabetic subjects, subjects with diabetes who were not taking statins exhibited a 33% greater progression of calcification (P < 0.001), and diabetic subjects who were receiving statins exhibited an 18% greater degree of progression of calcification (P < 0.001). The authors concluded that diabetes causes accelerated atherosclerosis of the coronary arteries, even in the presence of statin therapy.
Another study evaluated 163 asymptomatic subjects with type 2 diabetes who underwent two consecutive CAC scan studies 27 ± 15 months apart. 34 Eighty of the subjects were receiving statin therapy compared with 83 subjects not receiving statin therapy. The baseline CAC score was higher in the statin users than in the nonstatin users. As shown in Figure 6, CAC scores progressed significantly more rapidly in subjects who were not receiving statins, but CAC scores progressed in both groups. In multivariate analysis, annualized CAC score progression correlated negatively with statin therapy and positively with baseline CAC score. Additionally, A1C was weakly associated with CAC score progression on univariate analysis.
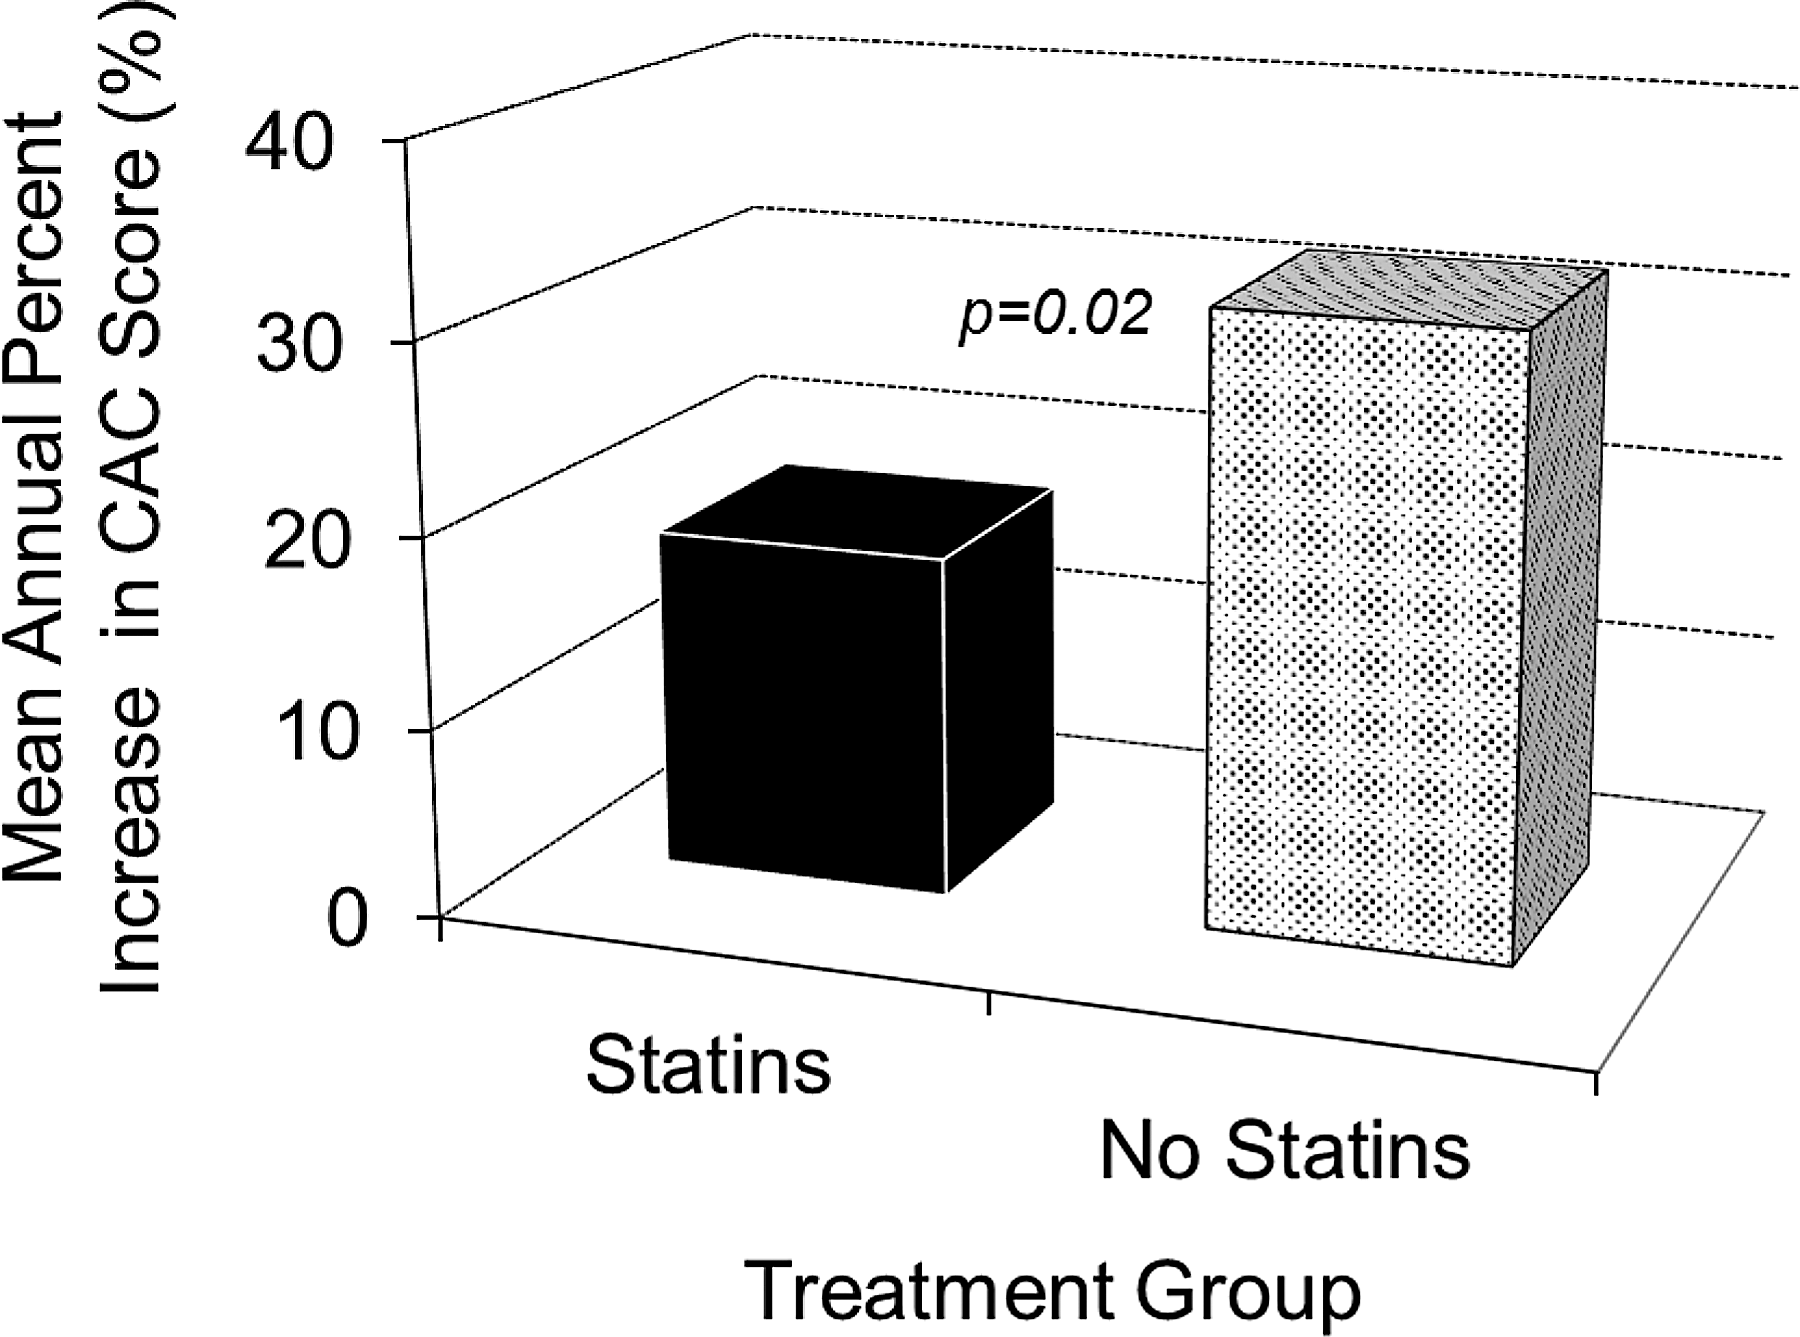
Mean annual change in CAC score among 163 asymptomatic subjects with type 2 diabetes who received sequential CAC studies 27 ± 15 months apart. Eighty subjects were receiving statins and 83 subjects were not. Adapted from Budoff et al. 34
More recently, an analysis was performed on 296 asymptomatic subjects with type 2 diabetes (163 of them on statins) and 300 matched control subjects (150 of them on statins) that highlighted the relationship between CAC score progression and cardiovascular events. 35 Subjects received CAC scans at baseline and again after at least 2 years. Annualized CAC score progression was greater in diabetic subjects than in subjects without diabetes, and as shown in Figure 7, hazard ratios for all-cause mortality were significantly greater in subjects with diabetes relative to those without diabetes at all rates of CAC score progression. Importantly, subjects with diabetes who did not demonstrate a progression in CAC score greater than 15%/year demonstrated no increase in hazard for all-cause mortality relative to nondiabetic subjects whose CAC score did not progress. Statin therapy reduced the risk of all-cause mortality in all groups relative to subjects with diabetes and CAC score progression. In summary, statins appear to slow the progression of CAC score over time in individuals with type 2 diabetes, but progression continues to occur.

Hazard ratios for all-cause mortality stratified by the degree of annualized CAC score progression for 296 subjects with type 2 diabetes compared with 300 matched nondiabetic controls; 95% Confidence intervals are shown within the bars. Adapted from Kiramijyan et al. 35
One recent study explored the direct pathological relationship between statin treatment and atheroma calcification (as well as atheroma volume) in great detail. 36 The investigators retrospectively analyzed CAC indices using the ultrasensitive technique of intravascular ultrasound (IVUS) in 3495 subjects from eight prospective randomized trials of statin therapy. As shown in Figure 8, patients receiving high-intensity statin therapy demonstrated a significantly greater reduction in atheroma volume (i.e., regression of atherosclerosis) compared with patients receiving low-intensity statin therapy or no statin therapy, despite the fact that patients receiving high-intensity statin therapy exhibited significantly greater coronary artery calcification than those receiving no statin therapy. The authors concluded that statins promote coronary artery calcification independent of their salutary effects on plaque regression and they postulate that this calcification reflects improved plaque stability. It should be noted that in this review, CAC scanning was not performed. The technique used was intravascular ultrasonography, which is much more sensitive than CAC scoring, but samples a much smaller area. Therefore, the results are not directly comparable with the CAC scan studies discussed above.

Does CAC Scanning Change Behavior?
All organizations that make recommendations for preventing ASCVD include improvements in lifestyle as the first therapeutic intervention. For many individuals, this means increasing aerobic exercise, obtaining a normal body weight, stopping smoking, and eating a diet high in fiber and vegetables with monosaturated or unsaturated oils substituted for saturated fat (often termed the Mediterranean diet). However, many individuals find these changes difficult and continue with their unhealthy lifestyle. Since the coronary calcium scan directly assesses the presence of calcified plaque in the coronary arteries, the question has been posed as to whether this test will motivate individuals to improve their unhealthy lifestyle. Several studies have examined this question and the results may depend upon the adequacy of communicating the results to the patient. A meta-analysis of these studies has concluded that in most cases, a CAC scan does motivate individuals to make the lifestyle changes necessary to improve their health. 37 In addition, individuals with a positive CAC score are much more likely to take their statin medication. 38 These studies emphasize the point that physicians who order the CAC scan should discuss the results with the patient and review the benefits of lifestyle changes and medication to improve their cardiac health.
Pros and Cons of the CAC Scan
Arguments for and against the routine utilization of CAC testing to screen asymptomatic individuals for subclinical atherosclerosis are shown in Table 1. The arguments essentially weigh the additional expense, radiation exposure, and inconvenience of CAC testing against the incremental information provided by the test. 39 The most compelling con argument asserts that the efficacy of statin therapy has been well established for most patients using traditional risk factors alone. The most compelling argument in support of CAC scan testing among asymptomatic individuals with diabetes stems from the ability of this test to accurately identify those who will and those who will not benefit from specific antiatherosclerotic therapy (i.e., statin therapy). As a functional test that reflects more than just low-density lipoprotein cholesterol (LDL-c) concentrations and incorporates genetic variations in cholesterol metabolism, no other screening test provides this information with such accuracy. 1 This strength of CAC scan testing derives primarily from the uniquely informative nature of a negative test. 39 Indeed, in the general population, the risk for a cardiovascular event for a patient with a CAC score of zero is ∼0.6% over a mean follow-up period of more than 4 years. 40 –42 However, a recent study has demonstrated that cumulative mortality rates after 5 years are greater in patients with diabetes than in those without diabetes, even if their CAC scores are zero. 21 In patients with moderately elevated serum cholesterol concentrations (e.g., LDL-c = 130 mg/dL), but a negative CAC score, the clinician must make a difficult decision about the efficacy of starting statins. Thus, a CAC scan score of zero allows the clinician to delay statin therapy for that particular patient for at least the next 5 years and to focus solely on appropriate lifestyle modifications. Not all diabetic patients will develop cardiovascular disease and these individuals should not receive statin therapy. Our approach is to not treat diabetic patients with a zero calcium score with statins. Besides the cost, statins have well-known side effects. Our approach is to repeat a calcium score every 4–5 years and, when it turns positive, to then initiate statin therapy. We believe that this is a conservative approach in line with other screening tests such as colonoscopies and mammograms.
American Diabetes Association Guidelines and Statin Use
The American Diabetes Association (ADA) currently recommends that all patients with diabetes mellitus aged 40–75 years and with LDL-c concentrations between 70–189 mg/dL (i.e., the vast majority of patients) be treated with moderate-intensity statin therapy. 43 Unfortunately, this treatment approach is rarely achieved in type 1 diabetes. 44,45 Other medical interventions, such as aspirin and fibrates, should be employed as indicated. Such guidelines necessarily incorporate statin treatment for an unknown proportion of patients who will not benefit from the therapy because their baseline risk for cardiovascular disease is so low. Indeed, most diabetes care providers can identify several of their patients for whom the addition of statins is very unlikely to definitively reduce their already low risk of a cardiovascular event. Moreover, our current methods of determining risk factor estimates do not necessarily incorporate information about all of the factors that contribute to ASCVD, including the patient's genetic background and the degree of inflammation in individual patients.
In an analysis of National Health and Nutrition Examination Survey (NHANES), ∼10% of patients with self-identified diabetes had an LDL-c concentration of less than 100 mg/dL during the period of 1988–1994. 46 Since this period was before aggressive statin therapy became widely accepted in diabetes, one might surmise that this percentage reflects the proportion of patients with diabetes who have low LDL concentrations without treatment, normal blood pressure, and normal A1C and who might not benefit from the addition of statin therapy. As such, one can extrapolate that more than 2.9 million patients (10% of 29.1 million Americans) with diabetes might escape knee-jerk, lifelong statin therapy if a clinical method were routinely employed to definitively ascertain that their risk of a cardiovascular event over the next 5 years was very low. Because the CAC scan score will provide this information in a highly accurate and reproducible manner, it is reasonable that patients receive a CAC scan score before instituting empiric cholesterol-lowering therapy. 1 Only in this way will clinicians avoid the unnecessary treatment of many of their patients.
Practical Utility of CAC Testing
The reason to perform CAC scoring is to obtain an accurate prediction of future risk of ASCVD events and to motivate patients in case their calcium scan is positive. This can best be achieved by combining traditional ASCVD risk factors with the CAC scan score by using the MESA risk calculator (
IVUS studies have demonstrated that reversal of atherosclerosis may be first observed in diabetic individuals at an LDL-c of 65 mg/dL. 48 However, this level of LDL-c does not include all individuals with diabetes and lower levels are desirable. As such, an LDL-c concentration of less than 50 mg/dL is an appropriate target in people with type 1 diabetes. There is much evidence in the literature that the lower the LDL-c, the fewer the cardiovascular events without an increase in side effects. 49 –51 This observation has been termed the LDL Principle 52 and a detailed review of this subject is available. 53 Since individuals with type 1 diabetes usually have normal lipid profiles and are not usually hyperlipidemic, the combination of statins (reduction of LDL by 50% with atorvastatin or rosuvastatin) and the addition of ezetimibe (a further 20% reduction) often will reduce the LDL-c concentration to 50 mg/dL. If not, the addition of the newer PCSK9 inhibitors will. 54 Furthermore, statin therapy should be continued for the life of the diabetic person. 55 Since multiple risk factors all contribute to the generation of atherosclerotic plaque, aggressive lifestyle changes plus an LDL-c level below 50 mg/dL are reasonable goals. Fortunately, this LDL-c goal is now achievable with today's FDA-approved medications. 56
Frequency of Testing and the Importance of Plaque Progression
The question frequently arises relative to the optimal age to first perform CAC scanning. There are no studies directly addressing this issue. However, there are studies in which diabetic patients received a CAC scan at a relatively young age and therefore provide insight into addressing this question. First, it should be recognized that atherosclerosis, per se, starts in the teenage years in individuals without diabetes. 57 Therefore, it would be expected that people with diabetes would be similar or have an even more accelerated progression of atherosclerosis. In the follow-up to the DCCT, 1205 individuals with diabetes received a coronary calcium scan. 29 The mean age of this group was 34 years, and 31% of these individuals had a positive calcium scan. Similarly, in the CACTI trial, 652 volunteers with type 1 diabetes received a CAC scan. 58 In this group, the mean age was 37 years and 48% of men and 28% of women had a positive calcium scan. These data suggest that the age of 40 years is not too early to obtain calcium scans in type 1 diabetic individuals.
If a CAC scan is obtained at a relatively early age in adult diabetic individuals, is there clinical value in repeating the scan several years later? As mentioned above, a recent study has demonstrated that the rate of increase in the calcium score has positive prognostic value. 59 A follow-up scan also provides information concerning the adequacy of therapy and/or compliance to therapy by the patient. If progression of the CAC score is less than 15%/year, the prognosis of being free from a myocardial infarction is very good, independent of the original CAC score (Fig. 9). 33 Alternatively, if progression is greater than 15%/year, then the initial CAC scan value determines the rate of myocardial infarction, with higher scores resulting in a worse prognosis. It must be acknowledged that there are very limited data defining the actual percentage rate of progression to determine increased ASCVD hazard in type 1 diabetes. A more conservative approach would be to use 30% progression per year as the cutoff level for progression. Until additional studies are available, defining the safe progression rate in subgroups of diabetic subjects with various risk factors, the physician will need to make a clinical judgment as to the appropriate safe rate of increase for their patient. 60 With this caveat in mind, the above data do suggest that repeat CAC scanning at periodic intervals (4–5 years) provides important clinical information to the physician and the patient.
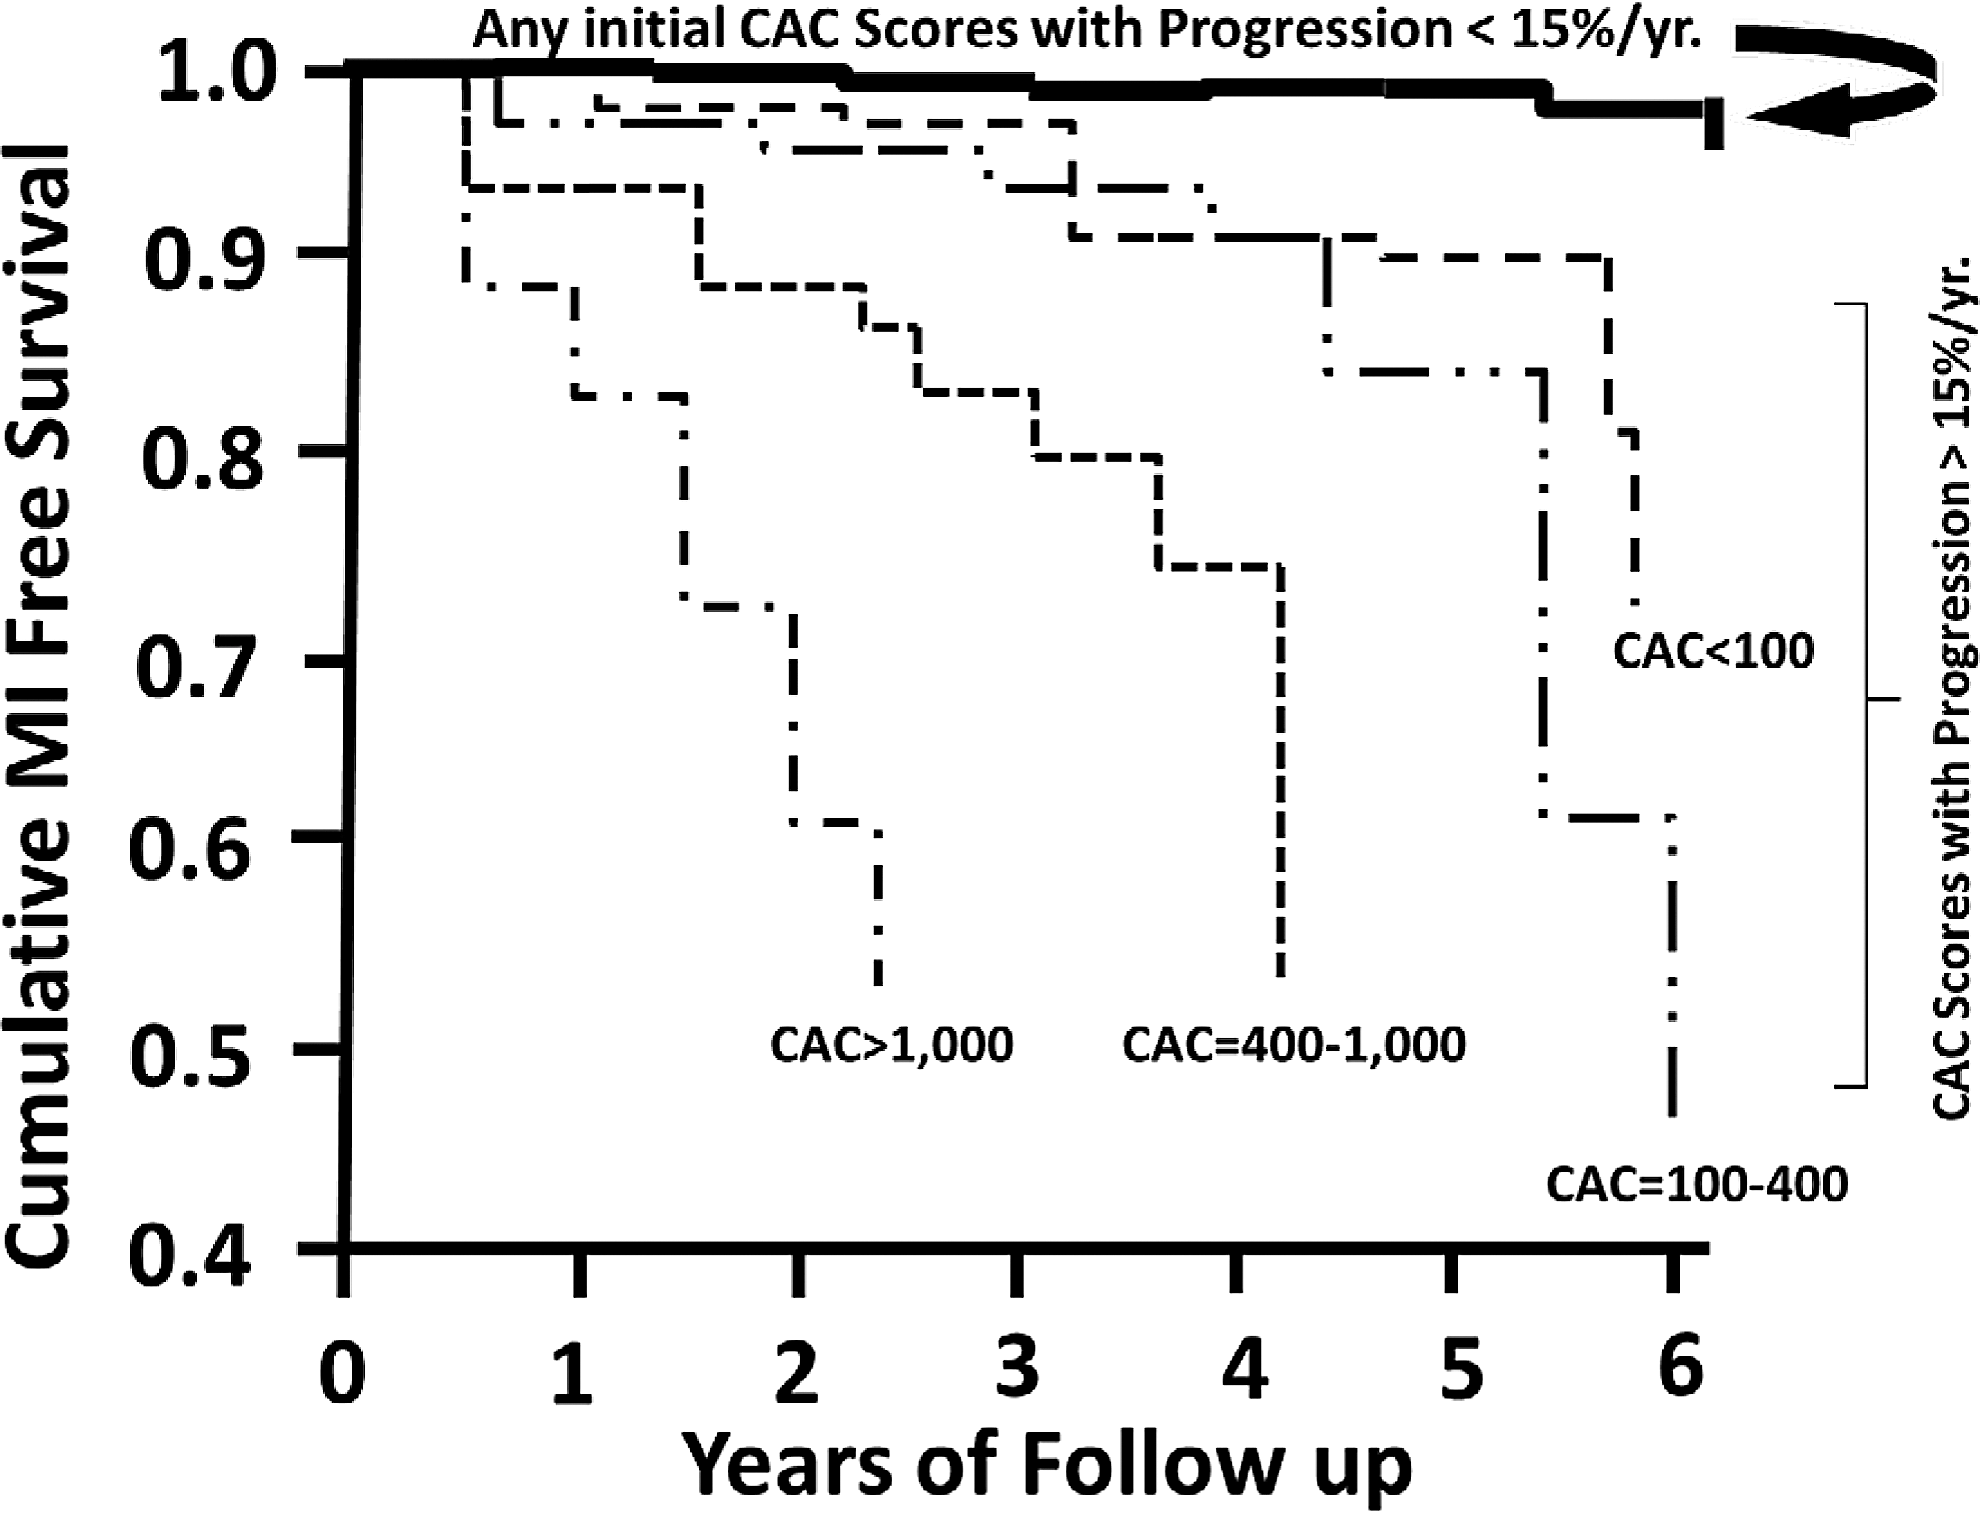
The yearly progression of the CAC score is a significant determinant of risk for myocardial infarction. If progression is less than 15%/year, practically no risk is associated with any baseline CAC score. In contrast, if progression of the CAC score is greater than 15%/year, then the additional risk is related to the original CAC score. For this reason, a repeat CAC score in 4–5 years is a useful prognostic indicator. Adapted from Raggi et al. 33
Is a CAC Scan Cost-Effective?
This question, although important, is not easy to answer for several reasons. First, there are no studies that directly address this issue in type 1 diabetes. Second, it is impossible to include the pain and suffering experienced by family members when a parent has a cardiovascular event. Third, the answer greatly depends upon the quality and quantity of the parameters entered into the model, such as the cost of the CAC scan, the cost of preventive therapy (i.e., statins), the magnitude of the risk of the population being evaluated, the level of CAC, which determines intervention therapy (i.e., CAC score of 0 or >100), and the duration of treatment necessary to prevent a cardiovascular event. If it is assumed that all type 1 diabetic patients are at least in the intermediate-risk category, then the most recent applicable cost analysis is the one that focused on intermediate-risk participants in the MESA trial. 61 These authors assumed that the cost of generic statins was $180/year, and the cost of a CAC scan was $100, which is the case in many U.S. cities. They also assumed that statin users had a 55% rate of adherence and that a positive CAC scan would increase adherence (by 10%) to this medication. 35,62 Employing these parameters, the authors found that the CAC scan was cost-effective in this group of individuals and further stated that a CAC-based strategy permits identification of appropriate candidates for statin therapy, enables clinicians to adjust the intensity of therapy to patient's risk, and avoids pharmacological interventions in a large group of truly lower risk patients. Whether performing a CAC scan in a high-risk patient is cost-effective (vs. treating all such patients with statins) has not yet been addressed, but as discussed in the paragraphs above, an initial CAC scan does provide the physician with the opportunity to repeat the CAC scan at periodic intervals to quantify progression of CAC and determine the effectiveness of statin therapy.
Conclusions
The clinical approach to the type 1 diabetic patient should be one of concern for the development of atherosclerosis (in addition to the microvascular complications of diabetes).
Since the long-term prognosis of type 1 diabetic patients has greatly improved with multiple developments in insulin preparations, insulin delivery devices, and glucose monitoring technology, additional focus must be directed at cardiovascular disease. Aggressive identification of ASCVD risk and treatment of risk factors are warranted.
The CAC scan is an important advance for the identification of ASCVD in the diabetic patient. However, to fully obtain its benefits, the practicing physician must understand its strengths and its limitations. Its strengths include its low cost, its noninvasiveness, its specificity for calcified plaque (which directly correlates with plaque burden), its use as a risk predictor, its relative ease and minimal time commitment for the patient, and its ability to provide a basis for medical intervention and risk prediction. In contrast, its drawbacks include that the CAC scan provides no information concerning the patency of the coronary artery lumen, its associated radiation exposure, its inability to detect noncalcified coronary artery plaque, and the fact that specialized reading software is necessary to quantitate the calcium score. This latter limitation is one reason that this test is not currently available in all major towns in the United States. A list of frequently asked questions regarding CAC scanning is provided in Table 2.
LDL-c, low-density lipoprotein cholesterol.
Based on recently published data, we concur with the recommendation that every diabetic patient have a CAC scan before initiating statin therapy. 63 If the score is 0, we do not start statin medications, but do recommend repeating the test in 4–5 years to reassess the need for this therapy. A similar recommendation has been made for aspirin therapy. 64 Furthermore, since the DCCT demonstrated that many type 1 diabetes mellitus patients had a positive calcium score at the mean age of 34 years, we recommend that all diabetic patients who have had diabetes for at least 10 years have a CAC scan beginning at the age of 40 years. If positive, a major effort should be made to reduce all modifiable risk factors, including an aggressive approach to reducing LDL-c and A1C. 4,49 If the CAC scan is positive, a repeat scan (after instituting aggressive risk factor reduction) in 4–5 years will provide additional data on the risk of atherosclerosis progression. Recent data indicate that aggressive therapy to reduce LDL-c in diabetic patients can alter the natural history of this disease and achieve regression of atherosclerosis. 48 The ultimate goal for all diabetes caregivers should be to reduce the incidence of ASCVD in type 1 diabetes to a nonsignificant level. Ordering a CAC scan is often the first step in achieving this goal.
Footnotes
Acknowledgments
M.B. received support from the University of New Mexico Clinical and Translational Science Center (NCATS #8UL1TR000041). D.S. received support from Case Western University/NIH 5 U01DK094157-05.
Author Disclosure Statement
No competing financial interests exist.