
Abstract
Background:
The cost of diabetes care accounts for a significant proportion of healthcare expenditures. Cost models based on updated incident complication rates and associated costs are needed to improve financial planning and quality assessment across the U.S. healthcare system. We developed a cost model using published data to estimate the direct medical costs of incident diabetes-related complications in a U.S. population of adults.
Materials and Methods:
A systematic literature review of MEDLINE, EMBASE, and TRIP databases was conducted on studies reporting the incidence and/or cost of diabetes-related complications (cardiovascular disease, neuropathy, nephropathy, ophthalmological disease, and acute metabolic events). A total of 54 studies met eligibility criteria. A baseline model was constructed for a U.S. population with type 1 and 2 diabetes mellitus and used to determine the expected costs of managing such a population over 1-, 3-, and 5-year time horizons.
Results:
The most costly incident complications in a population of 10,000 adults with diabetes were (1) congestive heart failure (CHF): annual expected cost of $7,320,287, 5-year expected cost of $50,697,865; (2) end-stage renal disease (ESRD): annual expected cost of $4,225,384, 5-year expected cost of $13,211,204; and (3) gangrene: annual expected cost of $2,844,381, 5-year expected cost of $17,200,417.
Conclusions:
This cost model estimates the direct healthcare costs of incident diabetes-related complications in a U.S. adult population with diabetes and provides a benchmark for evaluating the cost-effectiveness and potential leakage within a care delivery network.
Introduction
O
In the past decade, the healthcare landscape has undergone a substantial change toward shifting risk from payers to healthcare systems and self-insured employers in an attempt to contain rising healthcare costs. 3 Accountable care organizations (ACOs) have emerged to address the need for delivering high-quality care while also managing costs. 4,5 Ideally, ACOs are organized to deliver care within a predefined network to enhance performance and reduce overall expenditures. 6 Leakage occurs when individuals receive care outside of this network as the ACOs may remain accountable for those medical costs, which it cannot control or measure. 7 As this leakage may lead to higher out-of-network payments and reduced shared savings within the organization, it constitutes significant financial risk to the ACO. Thus, in the ACO model, the ability to estimate expected costs of medical care in a given patient population can provide a valuable benchmark for actively monitoring short- and long-term utilization to assess both cost-effective care and potential leakage.
As diabetes is a significant driver of cost, several cost estimation models have been developed. However, existing data and tools from both public and commercial sources (e.g., all-payer claims databases) are based primarily on retrospective costs within an organization that may not be generalizable across healthcare settings and patient populations. 8 –10 In addition, these tools are often restricted by accessibility and/or cost with limited availability in the public domain. We aimed to develop a cost model from the current literature capable of prospectively predicting the direct medical costs related to incident diabetes-related complications for a general population of adults with diabetes. Such a model would be able to identify areas of care leakage and overutilization and predict cost savings of potential interventions for the public domain.
Materials and Methods
Search strategy and study selection
To reflect current diabetes prevention and treatment practices, studies reporting cost and/or incidence of diabetes-related complications from 1995 to 2015 were included in our cost model. 11 MEDLINE, EMBASE, and TRIP databases were accessed in May 2015 and systematically searched for relevant citations during this time period. Additional articles were identified by manually searching through the references of reviewed articles. We used a combination of keywords and medical subject heading terms to generate two searches, each with three search subsets: (1) cohort subjects, diabetes-related complications, and cost of diabetes-related complications and (2) cohort subjects, diabetes-related complications, and incidence of diabetes-related complications. Results were then combined with “AND” (Appendix 1).
We focused on five main categories of diabetes-related complications given their significant contribution to direct medical costs of diabetes care 2 : cardiovascular disease, neuropathy, nephropathy, ophthalmological disease, and acute metabolic disease. Figure 1 details search strategy and selection of eligible studies based on criteria below.
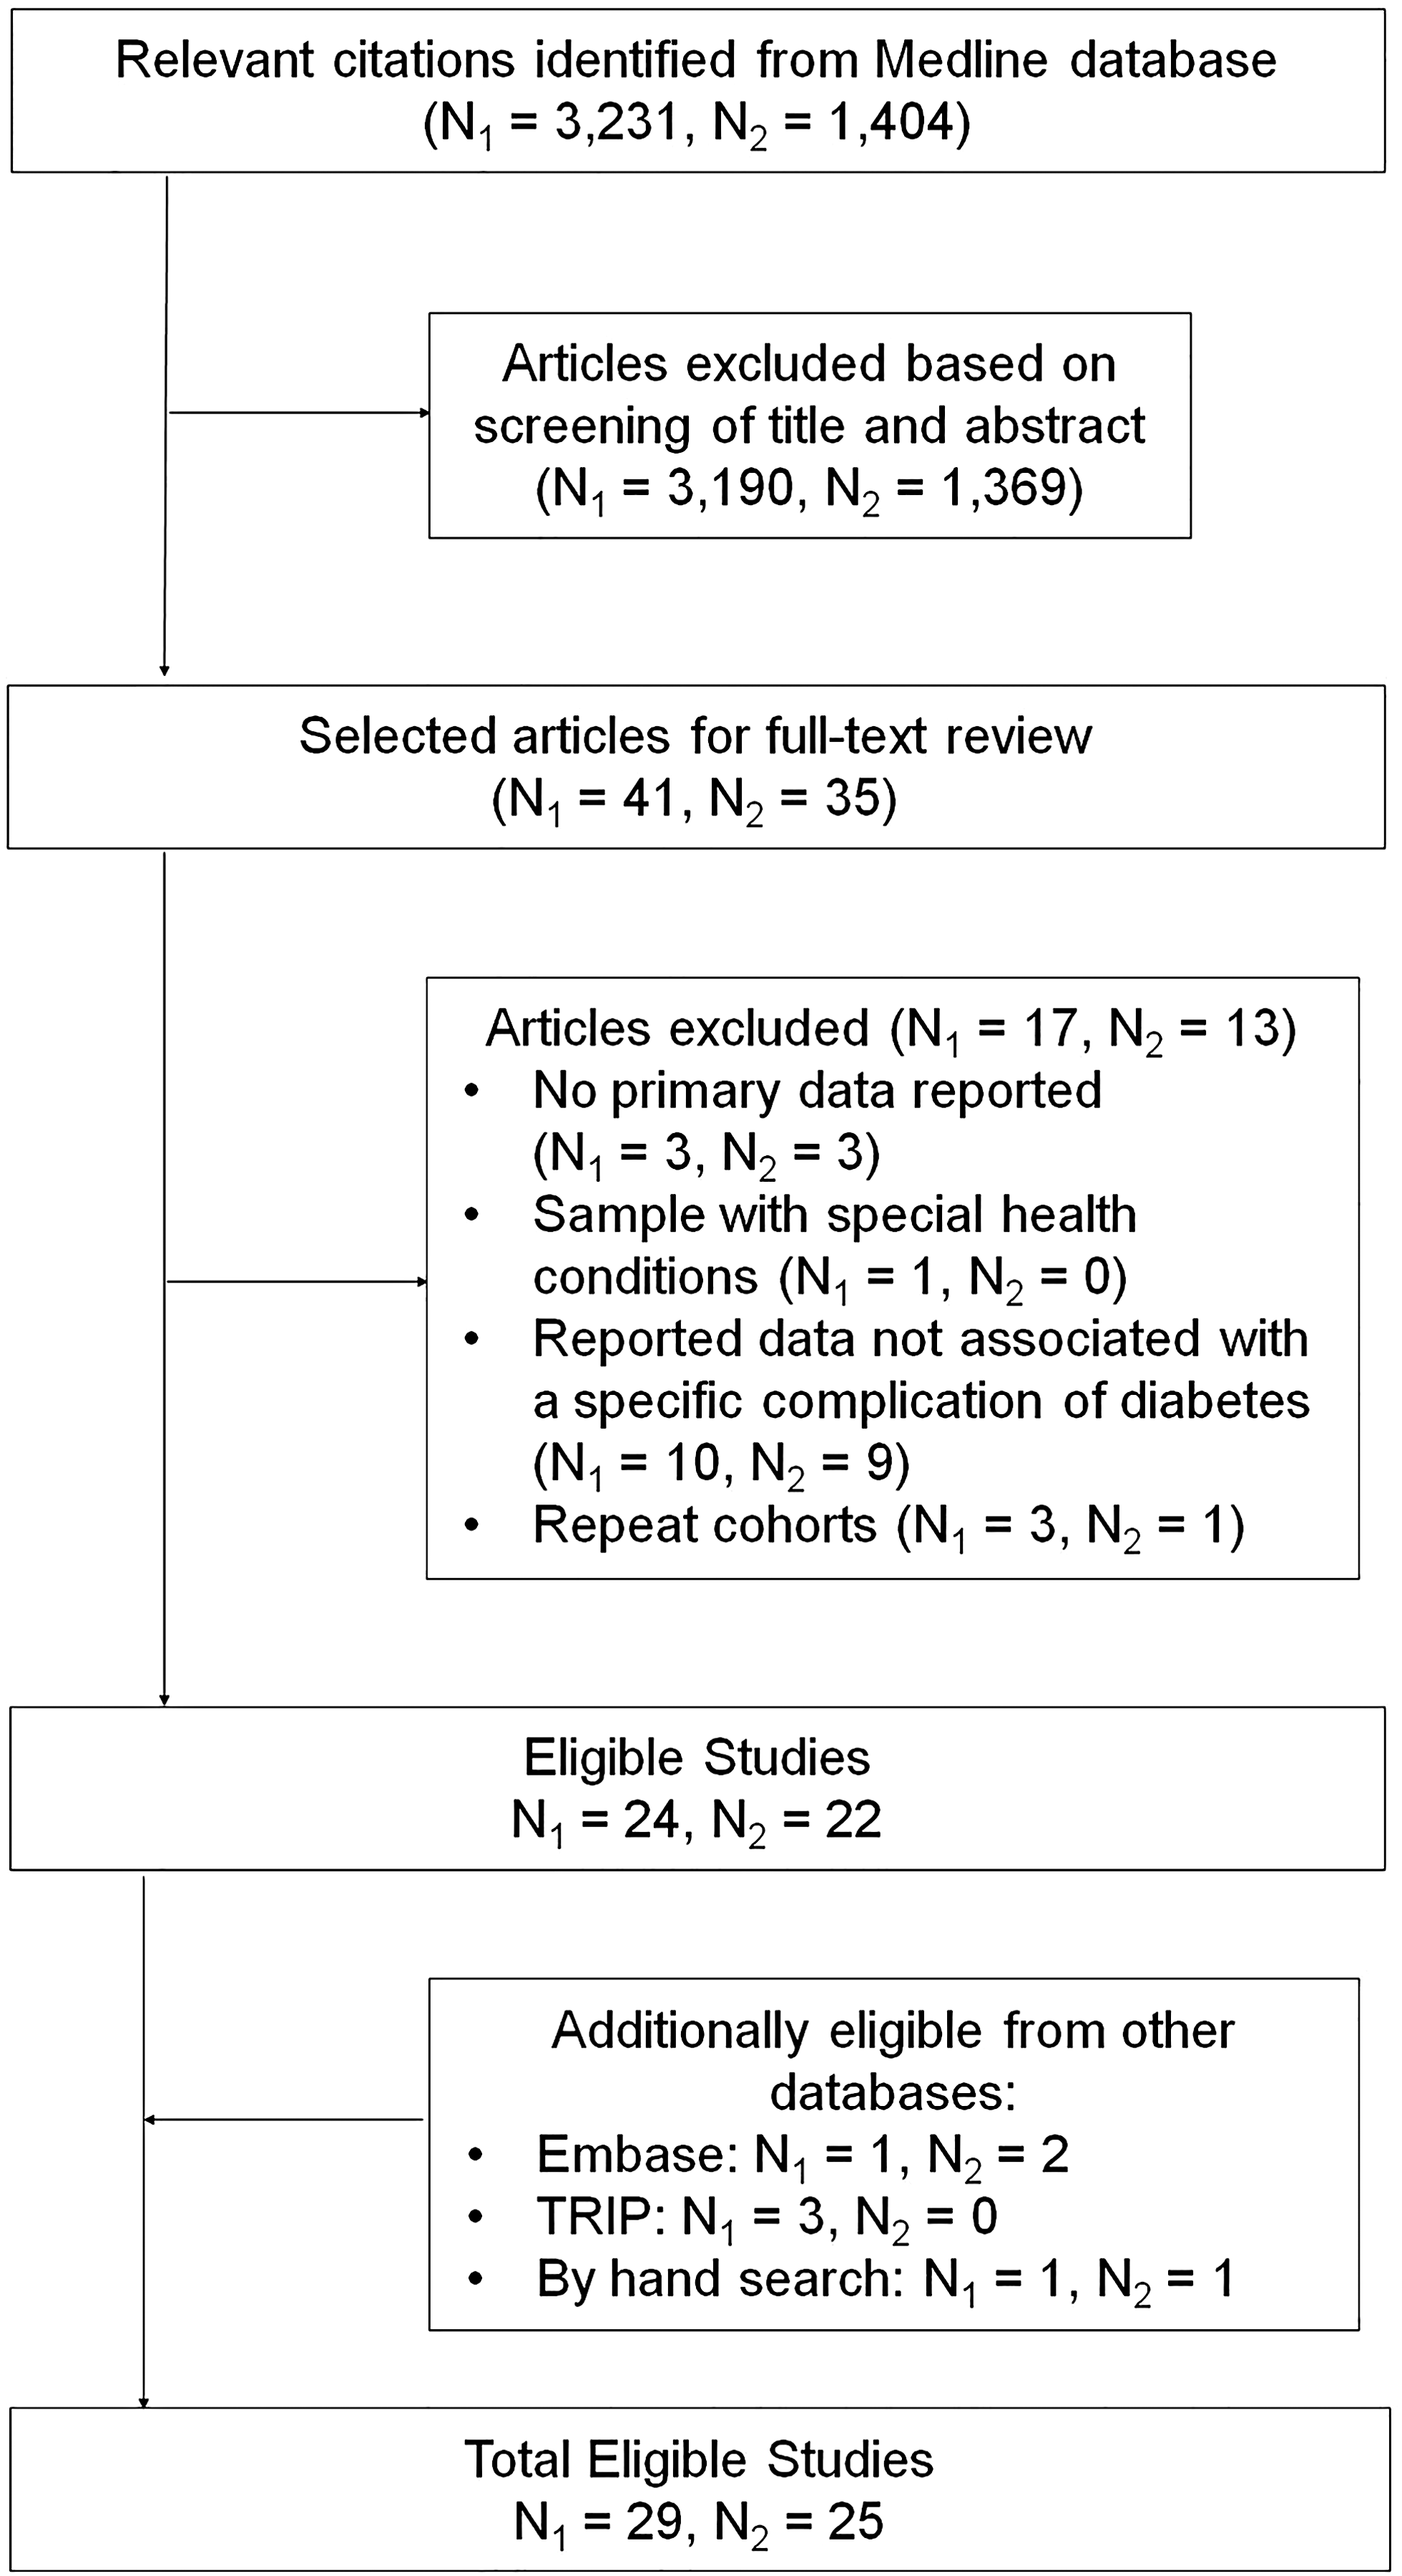
Flow chart of literature search. N1 denotes number of studies reporting incidence data; N2 denotes number of studies reporting cost data.
Inclusion criteria
• Include a U.S. population of individuals with type 1 or type 2 diabetes.
• For cost or incidence, data presented for at least one complication in the five complication categories.
• For cost in general studies, direct medical costs associated with diabetes-related complications, including, but not limited to, inpatient, outpatient, and pharmacy costs.
• For cost in studies specifically examining a procedure or hospitalization associated with a diabetes-related complication, direct medical costs associated with inpatient costs.
• Observational study design, whether prospective or retrospective.
Exclusion criteria
• Cohorts included only specific conditions, for example, individuals with diabetes and heart failure, as they might not be representative of the population as a whole.
• Studies that reported costs for an undefined unit of time, for example, costs of primary healing of a diabetic foot ulcer.
• Studies that reported incidence or cost data only in the context of a specific intervention or exposure, for example, incidence of cardiovascular disease associated with different levels of sodium intake.
• Studies that reported outcomes for only one racial or ethnic group.
• Any study without costs or incidence broken down by complication.
Data extraction
Each article was assessed separately by at least two authors, with data extracted into a Microsoft Excel (Microsoft Corporation, Redmond, WA) spreadsheet using the following predefined criteria: names of authors, publication year, study type, demographic characteristics of study subjects, study time period and location, definition of diabetes, cost data source, incidence data source, follow-up time period, and reported costs and/or incidence of diabetes-related complication. Discrepancies were discussed and resolved in open discussion.
Data analysis
Based on the available data and assuming a linear trend in incidence, we constructed a baseline cost model to estimate the expected costs of managing incident complications of diabetes over a period of 1, 3, and 5 years. Confidence in data lies between 1 and 5 years given anticipated nonlinear trend in incidence after a 5-year period. All incidences and costs are reported as means. Reported costs were adjusted to 2015 U.S. dollars according to the U.S. consumer price index.
To reflect population sizes comparable with a small or medium healthcare organization, reported incidences were adjusted to number of events per 10,000 persons. As studies often reported the cumulative incidence in a cohort over an extended period (up to 5 years), the annual incidences were estimated from reported data by dividing the reported incidence with the number of years followed. If available, the 3- and 5-year cumulative incidences were directly reported; for all other complications, it was calculated by multiplying the annual incidence by three or five, respectively. If a study reported data in events per person-years, we estimated incidences assuming a 1-year follow-up period and then adjusting the events to number per 10,000 persons.
Based on the data available for each model, the expected cost sums for diabetes-related complications were calculated by the following formulas under the assumption that in any given time period, there is an equal number of individuals within the population in each year of follow-up:
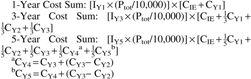
Key
IY1-5 = Incidence from 1 to 5 years as specified (No. per 10,000 persons)
Ptot = Total population
CIE = Cost of incident event
CY1-5 = Cost of follow-up in year 1 through 5 as specified; all follow-up costs are incremental to incident event and cumulative from year 1 to 5.
Of note, only follow-up costs for year 1 through 3 were reported in the literature and, in general, showed a decrease in cost from year 1 to year 3. Thus, the 5-year cost sum was calculated by extrapolating the cost of follow-up for year 3 or the last year available as shown above, assuming follow-up costs plateaued thereafter. The cost difference between the expected and actual cost sums for a given population can be subsequently calculated to identify areas of care underutilization (expected cost sums > actual cost sums) or overutilization (expected cost sums < actual cost sums) due to variation of costs within healthcare systems, (i.e., risk status of a cohort population, cost-effective interventions, or care leakage to out-of-network providers).
Baseline model assumptions
A baseline cost model was constructed with extracted data from the literature review. In general, articles reporting cost or incidence of diabetic complications in a representative U.S. cohort of adults with diabetes based on size, racial, or ethnic breakdown and geography were selected for the baseline model assumptions.
If more than one study reported data for a specific complication, the following algorithm was used: 1. Data source: Primary cost and incidence data preferred over data estimated from existing cost models. 2. Studies reporting all-inclusive cost estimates (inpatient, outpatient, pharmacy) preferred over studies reporting on specific aspects of care (hospital admission). 3. Demographics a. Population Characteristics: Diversity in age, sex, and racial makeup preferred over cohorts exclusively focused on specific subsets of age, sex, and/or racial groups. b. Medical Characteristics: Mixed populations of type 1 and type 2 diabetes and populations of type 2 diabetes preferred over populations of exclusively type 1 diabetes. c. Location: National studies preferred over regional studies, which were preferred over local studies. d. Insurance Coverage: Multiple insurance plans preferred over single type of insurance plan (i.e., Medicare, commercial). 4. Number of study participants: Larger studies were favored. 5. Year of study: More recent studies were favored.
Results
The 1-, 3-, and 5-year incidences of each diabetes-related complication extracted from a systematic literature search are provided in Table 1. The incident event and yearly follow-up costs for each complication are presented in Table 2. Incident event costs were reported for diabetes-related complications that typically present in the inpatient setting (i.e., acute myocardial infarction [MI]) and include any cost incurred during the hospitalization from admission to discharge associated with the complication. For diabetes-related complications that are primarily incident in the outpatient setting (i.e., foot ulcer and retinopathy), the cost of the incident event was included in the cost of follow-up for year 1. All other cost data in the baseline cost model were all-inclusive (inpatient, outpatient, and pharmacy).
Incidences for transient ischemic attack, angina, and kidney transplant were not available.
Ref., reference; No., number; Y, year; Mo, months; PY, person-years;—, not reported; PVD, peripheral vascular disease; MI, myocardial infarction; CHF, congestive heart failure; ESRD, end-stage renal disease; ED, emergency department.
If no incidence event cost was reported, year 1 includes cost of management of the acute incident event and/or diagnosis.
Costs in years 1–5 are incremental to incident event cost and cumulative from year 1 to 5.
TIA, transient ischemic attack.
All studies in the baseline model reported predominately primary data for a primarily or exclusively type 2 diabetes population. Characteristics of all incidence and cost studies included in the baseline cost model are summarized in Tables 3 and 4, respectively.
Cardiovascular complications
Stroke and acute MI incidences were derived from a study of multiple national databases, including National Health Interview Study (NHIS) and the National Hospital Discharge Survey (NHDS). 11 Peripheral vascular disease (PVD) incidence was extracted from a study of the Kaiser Permanente Northern California Diabetes Registry. 12 The incidence of CHF was extracted from a study of the Kaiser Permanente Northwest Division Diabetes Registry (Tables 1 and 3). 13
Stroke, transient ischemic attack, PVD, acute MI, CHF, and angina incident event and follow-up costs were derived from a published study of cost estimates from the transactional billing records from the PharMetrics Patient-Centric Database (Tables 2 and 4). 14
Neuropathy
Incidences for amputation, foot ulcer, and gangrene were estimated from published studies of the NHDS, 11 Group Health Cooperative of Puget Sound (large HMO in Washington State), 15 and Medicare Claims data, 16 respectively (Tables 1 and 3).
The incidence event and follow-up costs for amputation and foot ulcers were derived from published reports of cost from O'Brien et al. 17 and Ward et al. 18 based on a combination of inpatient and ED databases, physician and laboratory fee schedules, government reports, and published literature. Gangrene follow-up costs were derived from transactional billing records from the PharMetrics Patient-Centric Database (Tables 2 and 4). 19
Nephropathy
Of the renal complications, only the incidence of ESRD has been previously published with 1-year 20 and 5-year incidences 11 extracted from the U.S. Renal Data System (USRDS) (Tables 1 and 3).
The cost of ESRD management was extracted from a published report of cost estimates using databases from Kaiser Permanente Northwest (KPNW) and Georgia (KPGA) (Tables 2 and 4). 21
Ophthalmological complications
The incidence of blindness, 16 macular edema, 22 and proliferative and nonproliferative retinopathy 22 was estimated from published studies of diabetic patients from a Medicare sample. Cataract incidence was derived from a published report of the Beaver Dam Eye Study of the population of Beaver Dam, Wisconsin (Tables 1 and 3). 23
The management costs of blindness, macular edema, and proliferative retinopathy were derived from Ward et al.'s published analysis of multiple databases. 18 Costs associated with nonproliferative retinopathy and cataract were derived from transactional billing records from the PharMetrics Patient-Centric Database (Tables 2 and 4). 19
Acute metabolic complications
The incidence and the incident event costs of a hypoglycemic episode were derived from published studies analyzing the MarketScan Database (Tables 1 –4). 24 The follow-up costs of a hypoglycemic episode were extracted from Ward et al.'s published analysis of multiple databases (Table 2 and 4). 18
Expected direct medical costs in patients with type 2 diabetes
Table 5 presents the expected direct medical costs for a population of adults with diabetes calculated from the baseline model assumptions of incidence (Table 1) and cost (Table 2). The most costly complications per 10,000 individuals across three time horizons from most costly to least costly were CHF, ESRD, and gangrene (Table 5).
ESRD 3-year cost sum not reported due to similar reports in incidence over 1- and 5-year periods (Table 1).
Discussion
Care of diabetes and its associated medical complications continues to impose a significant economic burden on the U.S. healthcare system. As healthcare costs continue to rise, both large and small accountable care and other value-based healthcare delivery systems must be able to prospectively estimate the costs of care for long-term financial planning. However, few publicly available tools exist to model the cost of managing incident complications in a cohort of adults with diabetes. This cost model integrated published incidence and cost data from 1995 to 2015 on five principle diabetes-related complications into a tool to prospectively estimate the incident costs of managing these complications over 1-, 3- and 5-year time horizons.
Most significantly, this tool may help identify areas of care underutilization due to leakage to out-of-network providers, a major financial risk factor ACOs and other self-sustaining health systems face. 7 By prospectively identifying subspecialty care areas with high leakage, an organization would be able to quickly target short-term interventions to minimize out-of-network care, such as an expedited internal referral plan for specialty providers. In addition, this tool can also identify potential areas of care overutilization due to poor or inadequate control of diabetes or higher risk cohorts (i.e., older age), another financial risk factor that ultimately leads to reduced shared savings in an ACO or other self-sustaining health system. To address areas of excessive healthcare utilization and cost, the organization could employ evidence-based screening programs for disease markers, such as hemoglobin A1c, urinalysis for nephropathy, or annual eye exams for retinopathy. In certain care models, areas of care underutilization could also highlight cost-effective screening or treatment interventions. Over time, a healthcare system could model the potential cost savings of such targeted health interventions.
Commercial models are available; however, tools such as those designed by Kyruus (Boston, MA) 8 or IMS Health (Danbury, CT) 9 rely on proprietary retrospective data sets collected by the company themselves or private vendors. Specifically, Kyruus offers a patient retention tool to manage network patient referrals. 8 In many states, all-payer claims databases containing retrospective information for commercial and governmental insurance sources remain challenging to analyze due to technical (e.g., lack of common patient identifier) and regulatory (e.g., lack of access to governmental insurance claims) issues. 25 Thus, existing models are restricted by accessibility, limited by the retrospective nature of data, and prohibited by cost to the public domain, which has an increasing need to predict costs in the managed healthcare era.
Strengths of our study include the use of publicly available data to analyze the cost of diabetes care and the use of flexible model assumptions that can be tailored to local variations in incidence or related costs. These data can also be used in systems largely driven by fee-for-service billing to estimate the downstream revenue associated with gaining a larger diabetes market share. Furthermore, this tool estimates costs on an annual basis or for more extended 3- or 5-year durations.
Limitations include the limited amount of published data, in particular incidence data, on diabetes-related complications. Some studies report only the 5-year incidences for specific complications and thus annual incidences, in some cases, were derived. As the incidence of diabetes-related complications increases over time, these derivations may not accurately represent the actual incidence or costs of these complications. However, when available, actual reported incidences and costs were preferred over estimations. Notably, the cost estimates do not capture the indirect costs attributable to diabetes, including lost productivity or care provided by unpaid caretakers, and thus likely underestimate the true economic burden of diabetes. Our baseline model may also not reflect certain healthcare organizations with specific racial, ethnic, or socioeconomic profiles. However, each study is characterized in our model, and as a result, the users can customize the model assumptions to best fit their specific diabetes population.
Data on the cost and incidence of diabetes-related complications remain limited in both number and scope. Although comprehensive data sets exist from commercial and public insurers, access is limited and may be cost-prohibitive. Small data sets are available for specific states such as New York 26 and organizations, such as the CDC 10 and the USRDS. 27 However, there is no public national database to integrate all existing data. As transparency increases, cost models capable of identifying leakage and modeling cost savings are likely to become more robust in the future.
Footnotes
Author Disclosure Statement
No competing financial interests exist.